


Services on Demand
Journal

Article
 text in
  English (pdf)
 Article in xml format
 Article references
 Send this article by e-mail
Indicators
-
 Cited by SciELO
Related links
-
 Similars in
SciELO
Similars in
SciELO
Share

 Permalink
Industrial Data
Print version ISSN 1560-9146On-line version ISSN 1810-9993
Ind. data vol.24 no.2 Lima July/Dec. 2021 Epub Dec 31, 2021
http://dx.doi.org/10.15381/idata.v24i2.17371
Production and Management
Contractor Management Model to Improve Safety and Productivity Conditions in an Industrial Company

2 Industrial Engineer from Universidad Nacional de San Agustín de Arequipa. Currently working as Safety Engineer at Yura S.A. (Arequipa, Peru).E-mail: frojas87@gmail.com
Outsourcing contributes to business development. On some occasions, in order to secure low-cost bids, contractors agree to work under unsafe conditions; on other occasions, the client exerts pressure so that the service is completed ahead of schedule, causing contractors to take “shortcuts” and evade safety controls, which increases the risk of serious injury, chronic illness or even death. In Peru, there is no contractor management model in place to improve safety conditions and promote third-party productivity. Via statistical tests and correlation of variables, this research has developed and implemented a management model that describes the minimum requirements that must be met to avoid incidents and improve contractor productivity. It includes regulations from recognized national and international agencies and encompasses the best work practices acquired in more than 30 years of experience in the management of incidents in manufacturing, construction, steelmaking and mining.
Keywords: contractor management; third-party work safety; contractor productivity.
INTRODUCTION
This research provides a management model designed for service providers (contractors) and organizations that contract services from third parties (clients). This model is designed to:
protect contractor personnel from injury and illness caused by client activities
safeguard the assets of both parties involved
avoid loss of productivity due to injuries or illnesses of contractor workers
avoid cost inflation and project or service lead times
improve contractor welfare, social image, public opinion and trust in the marketplace
clarify the legal responsibility before labor accident investigations or public audits
prevent the increase of accident rates and insurance cost overruns
continuously improve performance and promote a safe work culture
This research is relevant and novel for the Peruvian manufacturing sector, since no standard or model exists for managing the safety and productivity of contractors that goes beyond the requirements of Peruvian legislation on outsourced work. The objective of this article, as well as its hypothesis, is to demonstrate that the implementation of a contractor management model (CMM) improves the safety conditions and productivity of third-party contractors in an industrial sector company.
This study was conducted in a metal-mechanical company in the manufacturing sector, which turns steel into consumables for the mining industry. Such company has three industrial plants distributed throughout Peru. For security and confidentiality reasons, the name of the company and the final products will not be disclosed; however, for the purposes of this research, the company will be referred to as RODAS S.A.
The results of this study can be extended to other organizations in the manufacturing sector, given the great similarity in the way the industry's activities were managed during the study period. Such similarity, in terms of outsourcing and occupational accidents in the sector, is shown in the following paragraphs.
In 2018, the Asociación de Empresas de Tercerización y Trabajo Temporal del Perú (AETT Perú) and Corporativo Overall reported that 8 out of 10 companies in Peru opted for outsourcing services (Diario Gestión, 2018), among which are: recruitment, food, payroll, transportation, surveillance, cleaning, gasfitting, masonry, waste disposal, maintenance, construction, etc. “Tres sectores encabezan la tercerización: Minería y Petróleo con el 50%, Servicio Retail y Consumo con el 30% y Otros [Three sectors lead outsourcing: mining and oil with 50%, retail and consumer service with 30% and others (agriculture, construction, manufacturing) with 20%] (Agricultura, Construcción, Manufactura) con el 20%” (Diario Gestión, 2015, para. 1).
In its Anuario estadístico sectorial 2016, the Ministerio del Trabajo y Promoción del Empleo (MTPE) declared that during the whole year, 20 876 occupational accidents were reported, 17 084 (81.8%) of which occurred in Lima and Callao, making it the region with the most cases (MTPE, 2017a). The number of occupational accidents reported to MTPE, however, is an underestimated figure, since many formal companies, but particularly unlicensed ones, fail to report them due to fear of facing serious sanctions imposed by SUNAFIL for non-compliance with safety conditions (Ministerio de Energía y Minas [MINEM], 2020). Table 1 summarizes such statistics for the purpose of this study.
Table 1 Comparative Ranking of Occupational Accidents and their Types.
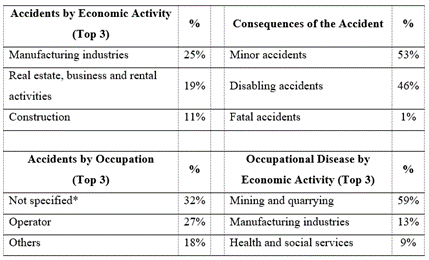
*Including outsourced workers or operators.
Source: Anuario MTPE, 2017.
Occupational Safety and Health (OSH)
Occupational safety and health is a fundamental aspect of decent work, and decent work is safe work. All workers must be safe in their workplaces, they must have the peace of mind of knowing that they are not exposed to risks and hazards. The physical conditions and mental demands of work and the work environment in general have a strong impact on the well-being and living conditions of workers. Occupational accidents and diseases have a significant human, social and economic cost, so we must strive to prevent them by ensuring that all workplaces are safe (International Labour Organization [ILO], 2020).
La salud laboral se construye en un medio ambiente de trabajo adecuado, con condiciones de trabajo justas, donde los trabajadores puedan desarrollar una actividad con dignidad y donde sea posible su participación para la mejora de las condiciones de salud y seguridad [Occupational health is built in an adequate working environment, with fair working conditions, where workers can perform an activity with dignity and where their participation in the improvement of health and safety conditions is possible]. (Instituto Sindical de Trabajo, Ambiente y Salud [ISTAS], 2008, para. 1)
According to the ILO and the WHO, occupational health is
the promotion and maintenance of the highest degree of physical, mental, and social well-being of workers in all occupations by preventing departures from health, controlling risks and the adaptation of work to people, and the people to their jobs. ((Organización Panamericana de la Salud [OPS], 2020, para. 1)
Occupational health is not limited to safeguarding the physical well-being of the worker, but also deals with the psychological aspect. For employers, occupational health implies support for the improvement of the worker and his or her working capacity (OPS, 2020).
OSH and Productivity Indicators
Frequency rate of injury incidents (FRII). According to the ILO, this rate is obtained by dividing the number of work-related incidents with injury that occurred during the study period by the number of man-hours worked in the reference group. The ratio is multiplied by an adjustment number, which, for better interpretation, is adjusted according to the magnitude of the hours worked, which can be 100, 1000, 100 000, 1000 000, etc. (ILO, 2020).

Frequency rate of non-injury incidents (FRNI). This rate is obtained to validate the results presented during the elaboration of the CMM.

It is important to note that man-hours (MH) are obtained from multiplying the number of workers in the reference group by the number of hours worked by them (ILO, 2020). In this case, the reference group is made up of contractor workers.

Time available for service (TAS). Similar to the indicators for goods and products, the time available to provide a service has the following formula:

Where available time refers to the time allocated by the organization that contracts the service (client) and effective time is the available time minus the time of unscheduled stops due to service interruptions such as incidents, delays in delivery of material, equipment, defective tools, other activities or priorities, etc.


Contractor Management Model (CMM)
This model is designed to suit different companies in the industrial sector, be it manufacturing, steelmaking, construction or mining, regardless of their size.
The process starts when the approved work plan for a project or service involves contractors. Figure 1 shows the 4 main sub-processes of the CMM:

Figure 2 shows the stages of the process to establish the occupational safety and health (OSH) conditions necessary to carry out the activities in the approved plan. The level of risk associated with each activity is then identified to obtain the basic and specific requirements, depending on their complexity, so that the organization can bid for the service or project with contractors on equal terms.

Once the proposals are received, they are evaluated (Figure 3). If the contractor has previously worked for the organization, the comprehensive evaluation records are reviewed, a comparative table is drawn up and the contractor with the highest score is selected to undertake the project or service:

Before starting, the selected contractor must go through an induction process to the OSH culture of the organization, which includes trainings on high-risk jobs required in the plan. After passing the proficiency test, a personal entry credential is issued (see Figure 4).
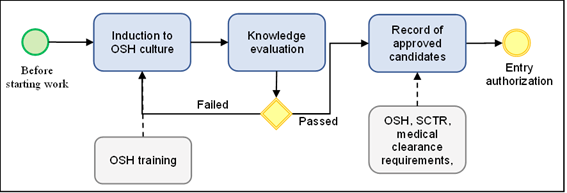
Source: Prepared by the author.
Figure 4 Entrance authorization to the contractor to the work center.
Once the entry authorization is issued, the rest of the OSH requirements are reviewed and validated (MTPE, 2017b), such as the complementary risk labor insurance (SCTR in Spanish), the medical clearance, the work tools inspection and other safety documents required by the client. The work authorization process is in charge of the task supervisor assigned by the client. All inspections, observations, occupational accidents or OSH events are recorded in the CMM (see Figure 5).

Once the work is completed, the contractor is comprehensively evaluated based on the criteria and indicators pre-established in the CMM (see Figure 6).

METHODOLOGY
According to the book Metodología de la Investigación by Hernández, Collado, and Baptista (2010), the scope of the present research is correlational, since it aims to determine the relationship or degree of association that exists between the independent variable X, “Implementation of the contractor management model”, and two dependent variables: Y, “Safety conditions”, and Z, “Productivity”, in the context of a company in the industrial sector.
The percentage of implementation of the CMM (% Imp. CMM) was measured quarterly through internal audits. It reflects the percentage of compliance at the time, that may vary over time, but maintains a marked trend. Observed changes in safety conditions (frequency of incidents) and productivity (time available for service) were measured using the units of analysis collected during the period 2012 - 2016.
A causal correlation between variables was demonstrated, that is, that the improvement observed in the dependent variables Y and Z resulted from the improvement in the independent variable X. Table 2 shows this relationship.
Table 2 Unit of Analysis and Measurement.
| Variable | Unit of Analysis | Measurement |
|---|---|---|
| Contractor Management Model (X) | 1. Percentage of implementation | - Quarterly, based on audit results - Appendix 01 |
| Safety conditions (Y) | OSH indicators: 2. Frequency rate of injury incidents 3. Frequency rate non-injury incidents | - Incidents with and without injury - Number of man-hours worked by contractor workers |
| Productivity (Z) | 4. Time available for service | - Contractor downtime due to incidents |
Source: Prepared by the author.
“Una población es el conjunto de todos los casos que concuerdan con una serie de especificaciones [A population is the set of all cases that meet a set of specifications]” (Selltiz, 1980, cited by Hernández, 2010, p. 65). For this study, 100% of the data collected in the period 2012 - 2016 from the company Rodas S.A. regarding the percentage of implementation of the contractor management model, the number of man hours worked, the incidents of its contractors and the amount of downtime from the incident until the client determined that it was safe to continue were considered.
Data were collected based on the ILO standard and criteria established in the publication “Statistics of Occupational Injuries, Sixteenth International Conference of Labour Statisticians” (ILO, 1998), updated in the “Quick guide on sources and uses of statistics on occupational safety and health” (ILO, 2020). The method used is described in Table 3.
Table 3 DataCollection Method.
| Var. | Measurement | Data Collection Method |
|---|---|---|
| X | Quarterly, based on audit results | Documentation, field observations, interviews and surveys that can be verified are required to carry out the audit of the CMM. Appendix 01 contains a sample of this audit. |
| Y | Number of man-hours worked by contractor workers and injury and non-injury incidents | Measurement, analysis and evaluation of 100% of the data collected during the period 2012 - 2016 in the company Rodas S. A. is required. As this is a strictly quantitative analysis of variables, no interviews or surveys are required. |
| Z | Contractor downtime due to incidents | Measurement, analysis and evaluation of 100% of the data collected during the period 2012 - 2016 in the company Rodas S. A. is required. |
Source: Prepared by the author.
As recommended by the International Labor Organization, fatal and non-fatal incidents were statistically separated in order to avoid biased data and/or values that deviate excessively from the trend and distribution of values (ILO, 2020).
A summary of man-hours and injury and non-injury incidents occurred per year is shown in Table 4.
Table 4 Number of Contractor Worker Incidents per Year.
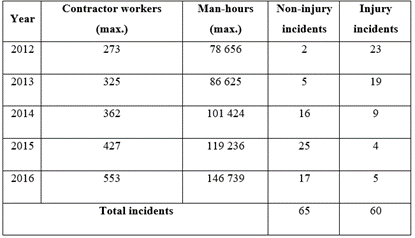
Source: Prepared by the author based on information provided by the company.
Table 5 summarizes the downtime per incident per year.
Table 5 Summary of Service Downtime by Year.
| Year | Service downtime (hrs) |
|---|---|
| 2012 | 170.38 |
| 2013 | 165.73 |
| 2014 | 66.93 |
| 2015 | 25.08 |
| 2016 | 33.41 |
| Grand total | 461.53 |
Source: Prepared by the author based on information provided by the company.
Table 6 summarizes the percentage of implementation of the CMM by year, calculated quarterly using the audit template in Appendix 01:
RESULTS
An understanding of the descriptive or inferential statistical properties of the resulting data is key to interpreting and evaluating the results. Table 7 shows the summary of the descriptive statistics of the variables’ indicators.
Table 7 Descriptive Statistics of the Variables’ Indicators.
| FRNI | FRII | TAS | |
| Mean | 1.32 | 1.67 | 7.69 |
| Median | 1.51 | 1.19 | 4.37 |
| Mode | 0.00 | 0.00 | 0.00 |
| Standard deviation | 1.15 | 1.83 | 9.22 |
| Sample variance | 1.32 | 3.35 | 85.07 |
| Kurtosis | -1.05 | 0.62 | 4.94 |
| Skewness coefficient | 0.29 | 1.10 | 1.84 |
Source: Prepared by the author.
Median and mean values are close in the case of FRNI and FRII; however, mode values, for all the other indicators, suggest that the distribution is probably not normal. A Shapiro Wilk test, used to test the normality of a data set (Shapiro & Wilk, 1965), was applied to corroborate that the data are non-uniformly distributed. The null hypothesis (H0) is that a sample x1, ..., xn comes from a population with normal distribution (see Table 8).
Standard deviation and variance values of IFIS show that the dispersion is close; in contrast, the remaining variables exhibit high variability for the averages with respect to the sample trend. The kurtosis and skewness coefficient give an idea of how the distribution curve is formed, and the prominence and symmetry of its tails (Minitab, 2019).
Table 8 Normality Testing.
| Indicator | Shapiro-Wilk (W) | p-value (0.05) | Testing (H0) | Result |
|---|---|---|---|---|
| % Imp. CMM | 0.7324 | 3.94e-09 | Rejected | Non-normal distribution |
| FRNI | 0.8901 | 5.82e-05 | Rejected | Non-normal distribution |
| FRII | 0.8473 | 2.54e-06 | Rejected | Non-normal distribution |
| TAS | 0.7852 | 5.88e-08 | Rejected | Non-normal distribution |
Source: Prepared by the author.
Based on the results of the normality testing, the Spearman correlation test, which is applied to evaluate relationships involving ordinal variables with nonlinear distributions (Zar, 1984), was used.
Figure 7 shows a summary of the incidents that occurred per year to compare the evolution between incidents with injury and without injury, and their interaction with the implementation of the CMM. In the first two years of the study, the number of incidents with injury is significantly high with respect to the percentage of implementation of the CMM; by contrast, the opposite occurs in the last two years of the study. Thus, an inverse or negative proportional relationship exists between the variables.

Figure 8 depicts the annual average of the FRNI in order to compare its evolution over time with respect to the percentage of implementation of the CMM. In the first two years of the study, both the FRNI and the CMM implementation percentage are significantly low; on the contrary, they are significantly high in the following two years. Thus, a direct or positive proportional relationship exists between the variables.

Figure 9 depicts the annual average of the FRII in order to compare its evolution over time with respect to the percentage of implementation of the CMM. In the first two years of the study, the FRII is significantly high and the CMM implementation percentage is low; on the contrary, the opposite occurs in the last two years of the study. Thus, an inverse proportional relationship exists between the variables.

Figure 10 shows the annual average of the TAS in order to compare its evolution over time with respect to the percentage of implementation of the CMM. Throughout all the years of the study, both the TAS and the percentage of implementation of the CMM vary proportionally over time. Thus, a direct or positive relationship exists between the variables.

DISCUSSION
Spearman's rating scale presented in Table 9 was used to interpret the results and contrast them with their respective hypothesis (evaluation); the result of this correlation is shown in Table 10.
Table 9 Spearman’sRho.
| Range | Strength |
|---|---|
| 0.00 - 0.25 | Little to none |
| 0.26 - 0.50 | Weak |
| 0.51 - 0.75 | Moderate to strong |
| 0.76 - 1.00 | Strong to perfect |
Source: Rangos de Spearman (Martínez, Tuya, Martínez, Pérez y Cánovas, 2009).
Table 10 Correlation Between the Variables and the CMM implementation.
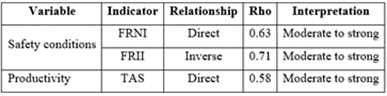
Source: Prepared by the author.
From the hypothesis testing, it was found that the implementation of a contractor management model has a moderate and strong influence on the safety conditions and productivity of contractors in a company in the industrial sector.
This assertion is supported by the Spearman correlation results obtained for the indicators of the Safety conditions variable which indicate that 63% of the FRNI is directly explained by the percentage of implementation of the CMM; while 71% of the FRII is inversely explained by the percentage of implementation of the CMM. For the productivity indicator, 58% of the TAS is directly explained by the implementation percentage of the CMM. Thus, a moderately strong correlation between variables of the general hypothesis is observed.
CONCLUSIONS
The research objective was achieved. Through correlation testing, it was demonstrated that the implementation of a contractor management model in a company in the industrial sector has had and continues to have a positive impact on the improvement of occupational safety conditions for its contractors.
As shown in Figure 7, through data analysis and the application of correlation testing between variables, it was demonstrated that the CMM implemented at 60% has a significant impact on the frequency rate of contractors’ injuries.
It has been demonstrated that the implementation of the CMM improves the productivity of contractor companies in terms of the availability of time to perform the service by avoiding service interruptions due to the occurrence of injury incidents.
The risk of performing an activity with contractor personnel influences inversely proportional to the level of implementation of the contractor management model, this means that the risk will be high if the contractor management is deficient.
A positive correlation exists between the contractor management model and the frequency of non-injury incidents, since the model encourages and motivates the workers themselves, contractors or not, to report all incidents before encountering dangerous situations that can cause permanent or fatal injuries.
Finally, it can be concluded that the implementation of a contractor management model improves safety and productivity conditions in a company of the industrial sector.
RECOMMENDATIONS
It is important that senior management and managers understand, are trained and are motivated to implement 100% of the management model, for without the allocation of personnel and resources, focus on improving the well-being of third-party employees in the organizations that require it is easily lost.
Appendix 01 contains the complete audit in accordance with the minimum guidelines described in the CMM. Contractors should be aware that they can be audited at any time, not only on OSH notions, but also on the sub-processes that comprise the contractor management described in Annex 01.
For future research, this study should be expanded by considering the economic and financial variables of the contractor companies and the client that are impacted by the cost of third party occupational injuries and illnesses due to their poor management.
Depending on the degree of responsibility and the findings of investigations, incidents involving injuries or accidents at work result in increased insurance premiums, claims, lawsuits, judgments, compensation payments, administrative and criminal penalties for the legal representatives of the company. Nonetheless, the most significant “sanction” is imposed by the people involved in the accident. The problem does not end once we know if the injured person recovered or if his/her health or physical condition will be permanently affected, because the person who suffered the injury, whether he/she is a contractor or not, has family and friends. Managers must be aware of all the people affected in an incident; likewise, they should pay special attention to the social image they convey to the community, especially for the care and welfare of their collaborators, whether they are contractors or direct workers.
REFERENCES
Diario Gestión. (27 de abril de 2018). Outsourcing: 86% de empresas en Perú tercerizan servicios. Recuperado de https://gestion.pe/economia/outsourcing-86-empresas-peru-tercerizan-servicios-232422-noticia/?ref=gesr [ Links ]
Diario Gestión. (15 de septiembre de 2015). Ocho de cada diez empresas en el Perú tercerizan y son 90% más productivas. Recuperado de https://archivo.gestion.pe/economia/ocho-cada-diez-empresas-peru-tercerizan-y-son-90-mas-productivas-2142885 [ Links ]
Hernández, R., Fernández, C., y Baptista, P. (2010). Metodología de La Investigación. México D.F., México: McGraw-Hill. [ Links ]
Instituto Sindical de Trabajo, Ambiente y Salud. (s.f.). Salud laboral. Recuperado de https://istas.net/salud-laboral [ Links ]
International Labour Organization. (6-15 de octubre de 1998). Statistics of occupational injuries. Sixteenth International Conference of Labour Statisticians. Recuperado de https://www.ilo.org/wcmsp5/groups/public/---dgreports/---stat/documents/meetingdocument/wcms_088373.pdf [ Links ]
International Labour Organization. (2020). Quick Guide on sources and uses of statistics on occupational safety and health. Switzerland: International Labour Organization. Recuperado de https://ilo.org/wcmsp5/groups/public/---dgreports/---stat/documents/publication/wcms_759401.pdf [ Links ]
Martínez, R., Tuya, L., Martínez, M., Pérez, A., y Cánovas, A. (2009). El Coeficiente de Correlacion de Los Rangos de Spearman. Revista Habanera de Ciencias Médicas, 8(2). Recuperado de http://ref.scielo.org/842jks [ Links ]
Ministerio de Energía y Minas. (marzo de 2020). La minería peruana en modo COVID-19. Actualización estadística a marzo de 2020. Recuperado de https://www.minem.gob.pe/minem/archivos/file/Mineria/PUBLICACIONES/VARIABLES/2020/BEMMAR20.pdf [ Links ]
Ministerio de Trabajo y Promoción del Empleo. (2017a). Anuario Estadístico Sectorial. Recuperado de http://www2.trabajo.gob.pe/archivos/estadisticas/anuario/Anuario_2016_020717.pdf [ Links ]
Ministerio de Trabajo y Promoción del Empleo. (2017b). Ley de Seguridad y Salud en el Trabajo, su Reglamento y Modificatorias. Edición Concordada. Recuperado de https://cdn.www.gob.pe/uploads/document/file/349382/LEY_DE_SEGURIDAD_Y_SALUD_EN_EL_TRABAJO.pdf [ Links ]
Minitab. (2019). ¿Qué es estadística descriptiva y estadística inferencial? Recuperado de https://support.minitab.com/es-mx/minitab/18/help-and-how-to/statistics/basic-statistics/supporting-topics/basics/what-are-descriptive-and-inferential-statistics/ [ Links ]
Organización Panamericana de la Salud. (2020). Salud de los Trabajadores: Recursos - Preguntas Frecuentes. Recuperado de https://www3.paho.org/hq/index.php?option=com_content&view=article&id=1527:workers-health-resources&Itemid=1349&limitstart=2&lang=es [ Links ]
Shapiro, S., y Wilk, M. (1965). An analysis of variance test for normality (complete samples). Biometrika 52, (3-4): 591-611. [ Links ]
Zar, J.H. (1984) Biostatistical Analysis. 2nd Edition, Prentice-Hall, Inc., Englewood Cliffs. [ Links ]

Received: February 03, 2020; Accepted: August 23, 2021
 Este es un artículo publicado en acceso abierto bajo una licencia Creative Commons
