Servicios Personalizados
Revista
Articulo
Indicadores
-
 Citado por SciELO
Links relacionados
-
 Similares en
SciELO
Compartir
Tecnia
versión impresa ISSN 0375-7765versión On-line ISSN 2309-0413
Tecnia vol.29 no.2 Lima jul. 2019
http://dx.doi.org/10.21754/tecnia.v29i2.705
10.21754/tecnia.v29i2.705
CONTRIBUCIONES ESPECIALES
Experimental study of the composite steel deck in terms of geometric and mechanical parameters
Jean Cueva1*, Miguel Diaz 1
1 Japan-Peru Center for Earthquake Engineering Research and Disaster Mitigation, Lima, Peru.
ABSTRACT
The behavior of the composite steel deck is conditioned, mainly, to the interaction that exists between the concrete and the steel deck, the shear connection between these two materials is provided by the mechanical adherence, which exists in its interface. In order to study these characteristics, a series of full-scale slab tests have been carried out, such as bending tests to identify the slipping load, which is directly related to the shear bond strength of the slab. The study of the shear bond strength is very important because in most cases the geometric conditions of the section and the slenderness of the slab will lead to this type of failure. For this reason, this research will be in charge of studying this failure condition, based on previously full-scale slab tests and newly constructed specimens, in order to cover as many situations as possible. The experimental results of these tests, such as the slipping load and the corresponding deflection, will allow establishing a new relationship between the slipping load, the geometric and mechanical parameters. This proposed relationship will be carried out for each of the steel deck profiles under study and this formulation will be validated as an alternative proposal to the "m y k method".
Keywords: shear bond, slipping load, composite slab, parameters.
1. INTRODUCTION
The composite steel deck became known in Peru at the end of the 1990s, thanks to the advantages that this type of slab showed worldwide, in comparison to the traditional systems that existed at that time. A composite slab is defined by ASCE (1992) as a system comprising of normal weight or lightweight structural concrete placed permanently over cold-formed steel deck in which the steel deck performs the dual role of acting as a form for the concrete during construction and as positive reinforcement for the slab during service [1] .
This type of slab is composed of concrete and the galvanized steel deck, the type of galvanized is G90 and must follow the requirements established in ASTM A653 [2] . The connection between these two materials is through the mechanical adhesion (provided by the embossments), this allows the system to work as a composite section and reach its maximum capacity if the embossments work correctly.
The composite slab has three important advantages over the typical slabs, first, the steel sheet acts as a principal reinforcement in replacement of the rebar, also during construction the steel deck acting as a work platform and no formwork is necessary, because the steel deck profile provide adequate stiffness and
strength to support construction live loads and wet concrete [3] .
There are three failure modes in these composite slabs (flexural, shear and shear-bond), but most of these slabs are conditioned to shear bond stress at the interface within the steel deck and concrete, and this has a direct relationship with the embossments that exists in the deck profile. The degree of interaction between these materials will determinate the maximum load reached. That is why the importance of study these slabs subjected to a bending test because it allows determining which is the slipping load (limit of shear bond stress) and the corresponding deflections, to know if it is within the permissible limits in its service state.
Furthermore, the bending test allows studying the behavior of the composite slab and analyzes the failure modes for the different combinations of geometric and mechanical parameters, such as steel profile shape, span length (L), total slab thickness (t) and steel deck thickness (gage).
The shear bond "m y k" method, presented by Porter, M, & Ekberg, C[4] , is a composite slabs design that is including in different standards specifications and is widely accepted worldwide, as in the ASCE and Eurocode 4[5] . This method consists of a full-scale
bending test and related the slipping load and geometric parameters for each profile deck and thickness.
In the tests carried out to date, it has been observed how deflection affects the functionality of the system and the need to include it in the design criteria.
2. BACKGROUND
In the previous investigations, presented by Miguel Diaz[6] , 36 composite steel deck were tested by bending with AD-600, AD-900 and AD-730 profiles for the different configurations of geometric parameters and thicknesses of the steel sheet 0.909 mm and 0.749 mm (gage 20 and 22 respectively)[7] .
Also, in the same investigation, the pull-out tests were carried out, which is an adhesion test that allows quantifying the shear bond stress in a piece of the slab.
Further with the results that were obtained the parameters m and k were determined for each profile and each gage so to have a first proposal for the design of composite steel deck conditioned by the shear bond failure.
3. DESCRIPTION OF THE SPECIMENS
With the purpose of increasing the results obtained until now, 15 new specimens were built with the AD-730 and AD-600 profiles for the thickness 1,504 mm (gage 18) shown in Figure 1 y Figure 2 respectively. This in order to study better the bending behavior of the slabs according to its geometric parameters and so complement this information with the other 36 specimens.
The specimens were built in 3 groups, 2 castings of 6 slabs each one, and finally the last casting of 3 slabs (longer slabs).
4. TEST PROGRAM
The newly built specimens will be subjected to static bending tests following the recommendations of ANSI/ASCE 3-91 "Standard for the Structural Design of Composite Slab" Chapter 3 Performance Test.
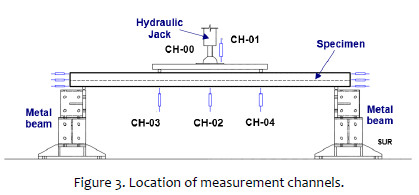
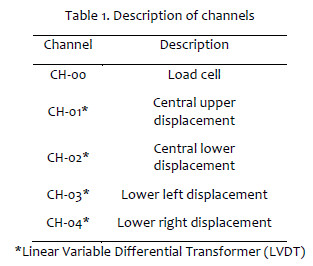
The Figure 3 shows the distribution of the channels that will measure the vertical displacements and the load during the test. It also shows the location of the slab, as it is supported on rollers and is on metal beams that will be adapted to the length of the specimens. Additionally, in Table 1 , the channels used in this research are briefly described.
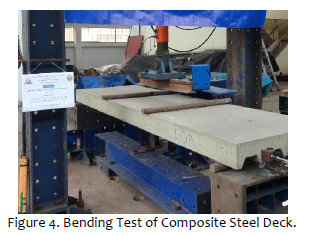
The load capacity of the hydraulic jack was 500 kN and the load was transmitted through a rail to apply the load to the thirds, as is presented in Figure 4 .
Additionally, other channels will be placed to measure the end slip to study the horizontal shear bond and following the recommendations given by Abdullah, R. and Easterling, W. S.[8] .
5. RESULTS BENDING TEST
The load will increase until reaching the failure load, this progressive increase will allow visualizing the slipping load and the deflections at each moment.
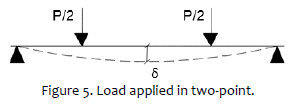
The load applied through the hydraulic jack is transmitted under two-point loads in the slab, as indicated in Figure 5. Furthermore, given the load condition, the shear force (V=P/2) is constant throughout the length of the cut.
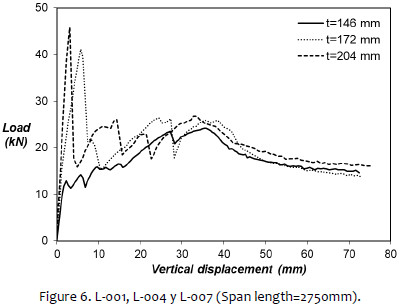
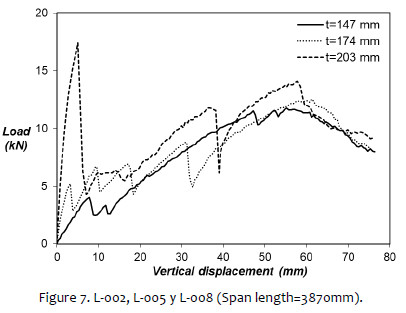
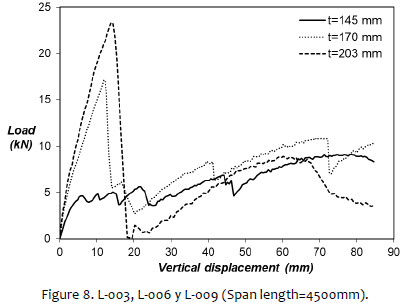
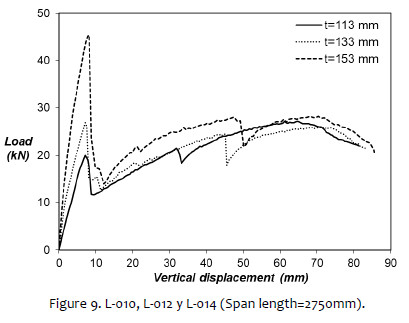
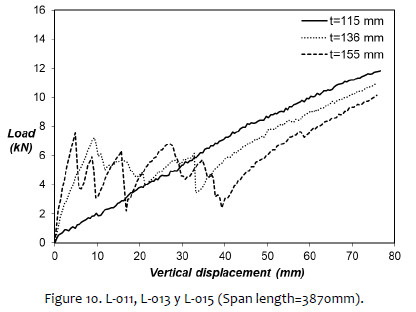
The graphs of vertical displacement and applied load are shown in the Figure 6, Figure 7 and Figure 8 for the AD-730 profile and the Figure 9 and Figure 10 for the AD-600 profile.
In the graphs with the AD-730 profile, it can be noticed that the slipping load increases when increasing the thickness of the slab. In addition, it can be observed that after reaching the detachment load, a fall occurs in the curve to later give way to over-resistance, which in some cases can overcome the slipping load or be below it.
A similar situation occurs with the AD-600 profile, with the exception of specimen L-011 (thinner), in which it is not possible to appreciate the slipping load due to the slenderness of the slab.
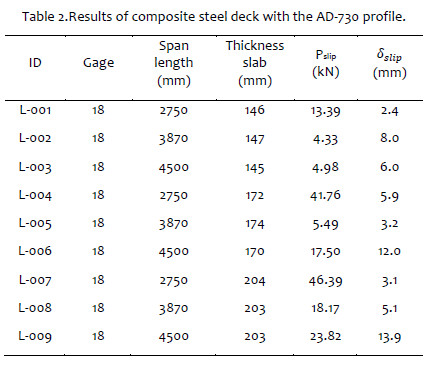
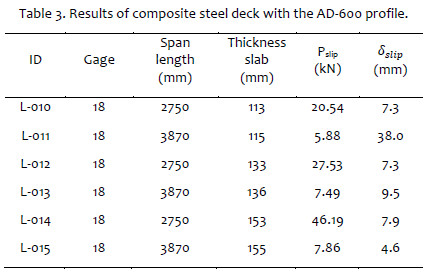
The geometrical properties of each specimen, the slipping loads and the deflection in which it occurs are indicated in Table 1 and Table 2 for the AD-730 and AD-600 profile respectively.
Also indicate that Pslip corresponding slipping load and δslip is the deflection associated with the slipping point.
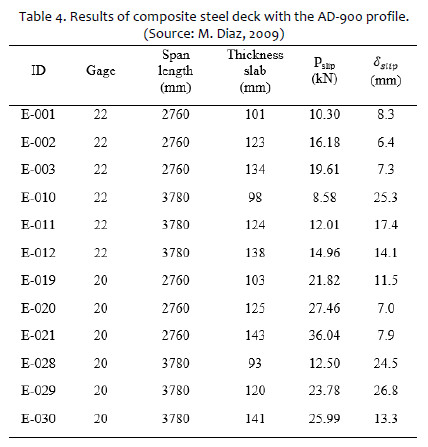
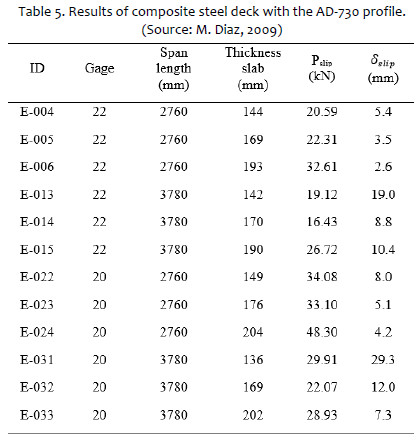
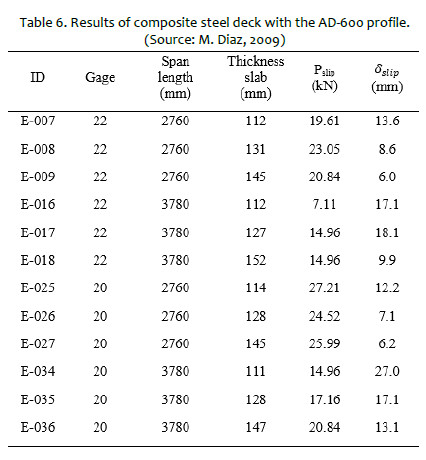
The Table 4, Table 5 and Table 6 show the values for the AD-900, AD-730 and AD-730 profiles respectively, according the results obtained in 2009.
6. FUNCTIONALITY OF THE SYSTEM
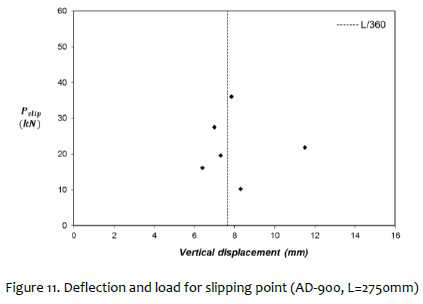
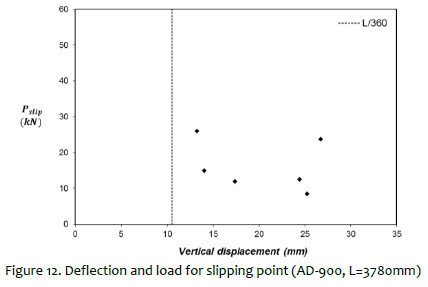
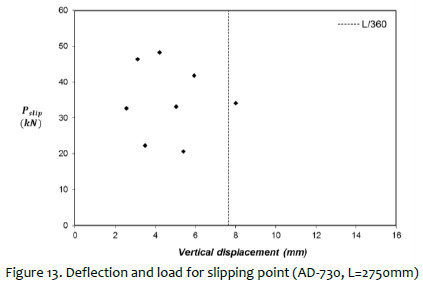
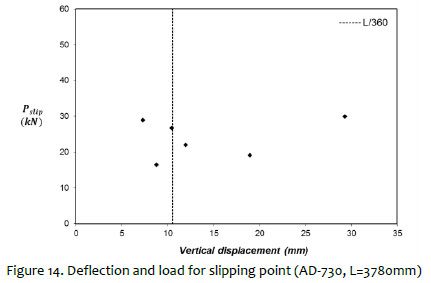
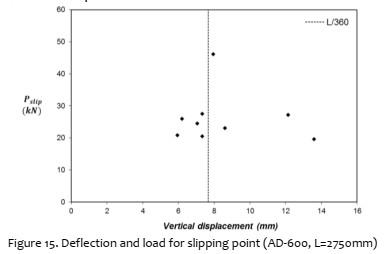
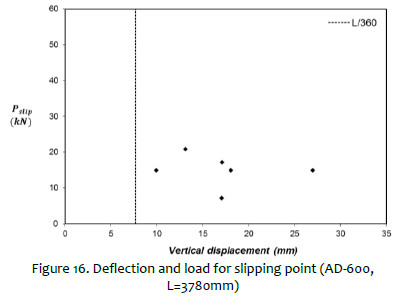
The behavior curves of the composite steel deck show that the functionality of the system can be conditioned mainly by two factors, the first factor is the slipping load, since from that point the interaction between both elements is partial and doesn't work as a composite section. The second factor is the maximum deflection (L/360), which determined the functionality of the system.
Therefore, it is important to identify under what deflection the slipping load occurs, since in some cases it is visualized that the slipping load occurs after having exceeded the limit deflection, in this case, the load corresponding to (L/360) must be determined to establish the maximum service load.
In other specimens, it can be seen that the slipping load occurs before reaching the limit deflection, in this event, the functionality of the system is conditioned to the shear bond strength.
Then, all the slipping loads (including all the tests) will be plotted, separated by profile and span length, in order to visualize under which deflection occurs the slipping in comparison to the limit deflection.
The Figure 11 shows the results for the AD-900 profile with a span length of 2750 mm and it can be noticed that there are specimens in which the slipping load occurs before and after the limit deflection. However, in Figure 12, for span length 3780 mm, all specimens have a slipping point after having exceeded the limit deflection.
Also, the Figure 15 and Figure 16 show the results for AD-600 profile.
7. THE SHEAR BOND m y k METHOD
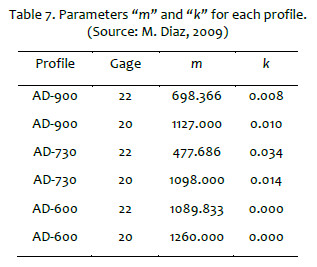
In the tests carried out previously (M. Diaz, 2009) the parameters "m" and "k" were determined for each profile and for each gage (20 and 22) from expression (1), thus giving the first experimental results for the design of these structural elements. The parameters "m" and "k" obtained in that study are shown in Table 7, according to the type of profile and the gage.
8. NEW PROPOSED METHOD
For the new design proposal, a new linear regression will be made between the slipping load and the geometrical and mechanical parameters of each specimen.
Unlike the method "m" and "k", this new correlation gathers all the results obtained for a specific profile (AD-900, AD-730 or AD-600), that is, it groups all the slipping loads regardless of the type of gage, since within the geometric parameters the area of the section of the profile is included.
This way of studying the results will allow to directly relate the slipping load with the thickness slab, span length, and the steel area, the expression (2) shows the relationship between all the mentioned parameters.
In addition, in this new proposal, the verification of the functionality of the system will be incorporated, since this could be limited by the deflection or the shear bond strength.
This is a very important difference in comparison to "m" and "k" method, because it only provides the slipping load through the linear regression that is performed for each profile and gage, leaving the verification by deflection as an additional calculation that is theoretical, and that in many cases it is usually the one that conditions the functioning of the system.
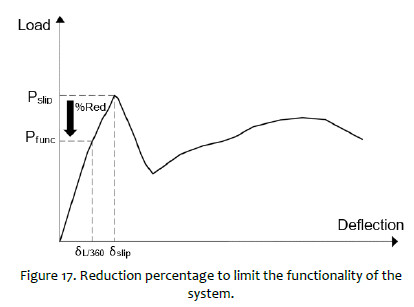
For the incorporation of this criterion in the new proposed method, the figures that showed the deflection measured in the slipping point were analyzed, and the percentage of reduction of the load was quantified for the cases in which the slipping occurred after exceeding the limit deflection, this procedure is seen in Figure 17.
For the case in which the slipping occurs before the limit deflection, the reduction will be zero percent, and the functionality will be conditioned by the shear bond strength.
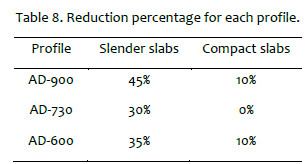
This percentage was analyzed for each profile, as seen in Table 8, and it was noted that the reduction is greater in the slender slabs compared to the compact slabs.
In the previous table, it is observed that the percentages of reduction vary according to the type of profile, with the AD-900 profile having the greatest reduction, contrary to the AD-730 profile. In addition, it can be seen that in the AD-730 profile there is a 0% reduction, which indicates that for this slenderness region the functionality is conditioned by the slipping load, which occurs before the limit deflection (L/360).
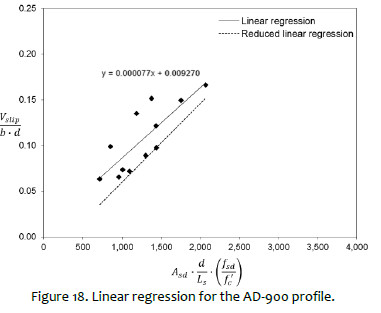
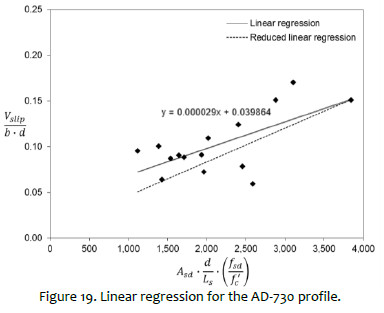
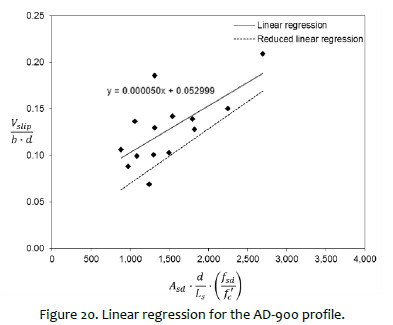
The experimental results, plotted as shown in Expression 1, are shown in Figure 18, Figure 19 and Figure 20 for AD-900, AD-730 and AD-600 profiles respectively. Also, in these graphs, the linear regression of the experimental data and the reduced linear regression are added from the reduction percentages shown in Table 8.
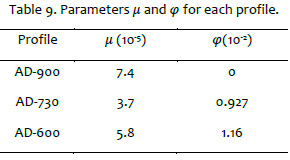
The parameters μ and φ of the reduced linear regression are obtained from the graphs shown, and these are summarized in Table 9, in order to obtain the shear force associated with the functionality of the system (Vfunc).
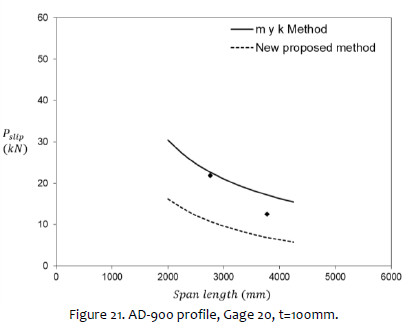
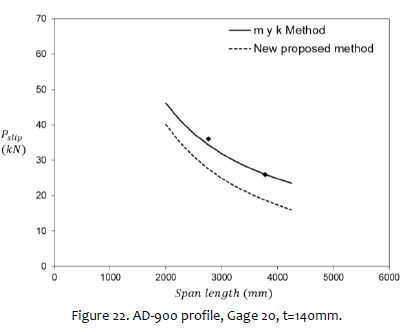
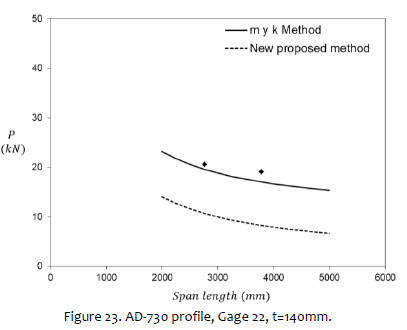
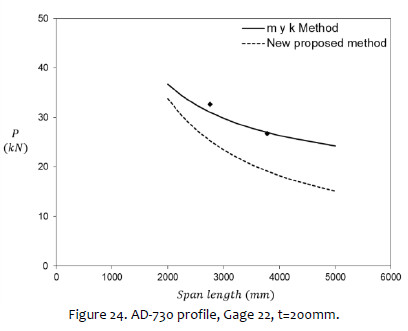
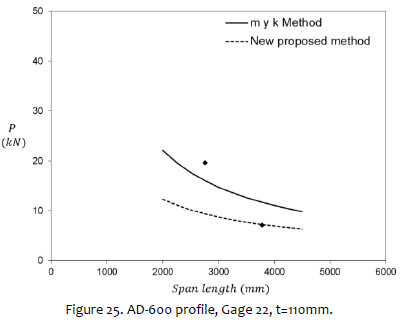
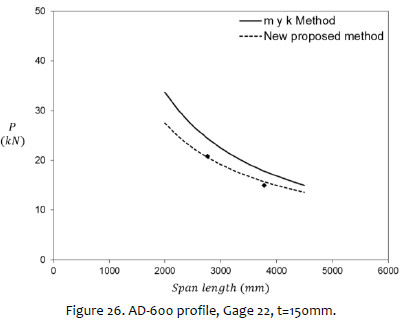
Now the graphical comparison between the m and k Method and the new proposal is presented, to see how the Loads Pslip and Pfunc vary according to the span length and the thickness slab, the latter will vary according to the profile. In addition, experimental results will be added to analyze the proximity of the methods described.
Figure 21 and Figure 22 show the results for the AD-900 profile, with gage 20 and slab thicknesses of 110 and 140 mm, which were smaller and larger thickness of the constructed specimens.
In these first results it is observed that there is a difference of values between the two methods, but it can be noticed that this difference is shortened in the compact slabs, that is, in slabs with greater thickness.
Similarly, Figure 23 and Figure 24 are shown for the AD-730 profile, but with gage 22 and thicknesses of 140 and 200 mm.
Finally, the theoretical values for the AD-600 profile are indicated, again with the 22 gage. Figure 25 shows the values for a thickness of 110mm and covering span length from 2000mm to 4500mm.
In the same way Figure 1 is plotted, but with 150mm slab thickness.
In the case that the compressive strength of concrete in the design is lower from the strength obtained in the tests carried out, the recommendation indicated by the ASCE will be followed and use the expression (3) to determine the shear force associated with the functionality limit.
CONCLUSIONS
- In the slender slabs, it is visualized that the slipping load occurs under a deflection that exceeds the limit deflection (L/360), therefore a percentage of reduction must be calculated in order to determine the load that conditions the functionality of the composite steel deck.
- The reduction percentage is much higher for the AD-900 profile, reducing up to 45% for the slender slabs, compared to the AD-730 profile, which has a 20% reduction.
- The linear regression performed on the experimental data, according to the proposed method, presents a better relationship for the AD-900 and AD-600 profile, while for the AD-730 profile there were some scattered results.
- In the comparison of loads for both methods, m and k Method and the new proposed method, it can be seen that the loads obtained by the second method are smaller compared to the m and k Method, but this difference is shortened in the slabs with greater thickness.
- The new proposed method can be used as a new design alternative since it is a tool that allows determining the load that limits the functionality of the system based on the study of the slipping load and the maximum deflection allowed in its service state.
- From the load obtained by the new method, the permissible distributed live load can be calculated for each combination of slab thickness and span length; as well as for specific concrete strength.
ACKNOWLEDGEMENT
This research was elaborated with the financing of Aceros Procesados S.A., also a special thanks to the Structures Laboratory of Japan-Peru Center for Earthquake Engineering Research and Disaster Mitigation (CISMID) and to Professor Miguel Diaz for his support during the experimental study.
REFERENCE
[1] American Society of Civil Engineers 1992 ANSI/ASCE 9-91 Standard Practice for Construction and Inspection of Composite Slabs. New York [ Links ]
[2] American Society for Testing and Materials. ASTM A653/A653M - 09: Standard Specification for Steel Sheet, Zinc-Coated (Galvanized) or Zinc-Iron Alloy-Coated (Galvannealed) by the Hot-Dip Process. ASTM standard, West Conshohocken, Pennsylvania. [ Links ]
[3] Steel Deck Institute 2017 ANSI/SDI C-2017 Standard for Composite Steel Floor Deck-Slabs. Pennsylvania [ Links ]
[4] Porter M and Ekberg C 1976 Design recommendations for steel deck floor slabs. J. Struct. Eng, ASCE, 102(ST11), pp 2121–2136 [ Links ]
[5] Eurocode 4 2004 Design of composite steel and concrete structures, part 1.1: general rules and rules for buildings. EN1994-1-1:2004. Brussels: European Committee for Standardization [ Links ]
[6] Diaz M 2009 Estudio Experimental de la Resistencia de Adherencia al Corte en Losas con Placa Colaborante. Lima [ Links ]
[7] Departamento de Ingeniería e Investigación Aceros Procesados S.A 2009 Manual Técnico. Lima [ Links ]
[8] Abdullah R 2004 Experimental Evaluation and Analytical Modeling of Shear Bond in Composite Slabs. Virginia [ Links ]
* Corresponding author:
Received: 29/06/2019
Accepted: 07/08/2019


