


 Inglés (pdf)
 Articulo en XML
 Referencias del artículo
 Enviar articulo por email
 Citado por SciELO
  Similares en
SciELO
Similares en
SciELO 
 Permalink
INTRODUCTION
The mining industry is the main economic activity in Peru, contributing to the country's industrial development and economic growth1. However, mining can also have adverse environmental impacts that affect water quality2. Inadequate management of mining wastewater and tailings can alter nearby rivers and streams, affecting the quality of surface water resources and the quality of life of nearby populations3,4. Therefore, the development of water quality studies is important to verify compliance with mining water quality control regulations in accordance with each country's current legislation Hydrogeochemistry is the study responsible for evaluating the quality of water based on its chemical composition and interaction with geology and mineralization of the area5. In the mining context, hydrogeochemistry allows us to evaluate how mining processes affect the quality and quantity of water, as well as the development of measures to prevent detrimental effects on water resources6. Therefore, the development of such studies will be key to promoting responsible and sustainable mining in relation to water.
Water is a fundamental resource for the quality of life of both humans and other living beings. To guarantee its safety, it is essential to control various parameters that determine its quality and possible uses in society. In this context, hydrogeochemical studies fulfill an important role in determining the quality and identifying possible sources of contamination7,8. The pH level of water can have a significant impact on its use for agriculture and flood irrigation, as a pH that is too high or low can cause soil acidification or alkalization, which can make it infertile9,10. The dispersion of heavy metals in mining areas towards water resources can be a threat to water quality and human health since these metals can eventually be introduced into the human body through consumption when in suspension11. In relation to these studies, this paper aims to carry out a hydrogeochemical analysis of surface waters in a polymetallic mining zone in central Peru, to identify and evaluate possible adverse effects on water quality generated by mining activity in the area. Additionally, the results obtained will be compared with the standards established by Peruvian Regulation Supreme Decree 004-2017-MINAM, which sets the parameters for water quality12.
EXPERIMENTAL SECTION
The polymetallic mine area belongs stratigraphically to the Cretaceous sedimentary basin, where thick Cretaceous sediments are distributed throughout the area, forming three well- defined horizons. The lower part is composed of clastic rocks such as siliceous sandstones, limestones, and shales. The middle part is composed of calcareous rocks associated with dolomites and shales, and the upper part contains red layers. The mineralization of the deposit is a hydrothermal replacement, made up of zinc, lead, silver, and copper minerals. On the surface, mineralization appears in the form of iron and manganese oxides, resulting from the oxidation of primary sulfides, mainly composed of sphalerite, marmatite, and subordinately galena and chalcopyrite.
The operational area is located on the western flank of the Andean Western Cordillera, at an altitude ranging from 4500 to 5000 meters above sea level. The topography shows a glacial landscape, where remnants of ancient activity can be observed, such as moraine deposits on both sides of the natural channels or courses of the lagoons.
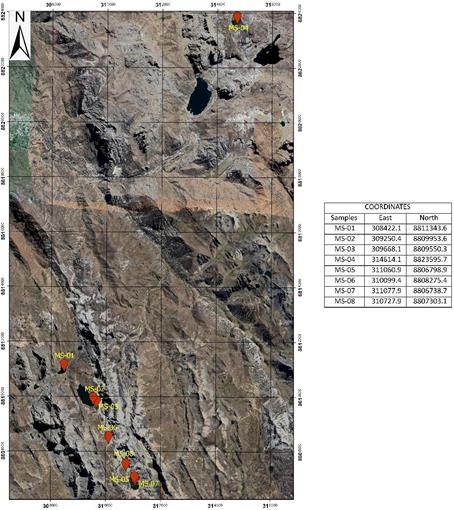
For the collection of surface water samples, parameters were measured in the field at 8 control points corresponding to stations (MS-01, MS-02, MS-03, MS-04, MS-05, MS-06, MS-07, and MS-08). The location of the sampling was recorded by a portable GPS from the brand GARMIN, see Figure 1. Field instruments were used to measure the pH (pH meter), electrical conductivity (conductivity meter), and temperature (thermometer) from the brand EXTECH. To evaluate salinity, total dissolved solids, and other chemical elements, such samples were sent to an accredited quality laboratory in Perú.
For the development of the present hydrogeochemical study, the necessary graphs were prepared to understand the chemical composition present in surface waters and the influence of the terrain on their quality, for which the Piper and Stiff diagram methods were used. In this regard, the results obtained from the analysis of water samples were represented by the Piper and Stiff diagrams using RockWorks v2022 software. The Piper diagram is a graphical representation of the chemistry of water samples, where the present cations and anions are shown through separate ternary graphs, and both ternary graphs are projected onto a central diamond. This graphical representation allows for identifying hydrogeochemical groups and interpreting some chemical processes represented by the
data set being analyzed13,14. On the other hand, the Stiff diagram represents different types of water and their degrees of mineralization in the form of polygons through three horizontal axes, with the cations located to the left of the diagram and the anions to the right. This diagram allows appreciating the values of the ionic relationships with respect to unity and the variation of the relationships between cations and anions of a sample15.
RESULTS AND DISCUSSION
Electrical Conductivity
The electrical conductivity of water occurs due to the presence of dissolved ions in its composition (Na+, Ca2+, K+, Mg2+, Cl-, SO 2-, NO 2- , CO 2-, and PO 3-), which acts as conductive charges. The greater the presence of these ions, the greater the conductivity present. Additionally, the temperature of these ions will drastically affect the measurement of conductivity, since higher temperatures lead to greater resistivity, resulting in lower conductivity16. In relation to the above, the in-situ data obtained for electrical conductivity were taken at a temperature lower than 16.2°C, with a maximum value of 1105 µS/cm corresponding to the MS-06 station and a minimum value of 129 µS/cm corresponding to the MS-07 station, see Figure 2.
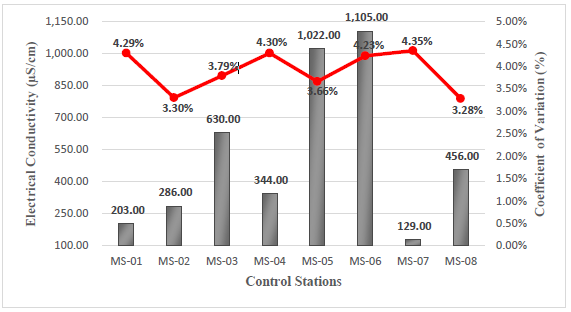
The MS-03 and MS-04 stations show a different trend compared to the others due to the data collection at the MS-04 station was conducted at a point distant from the other stations, allowing for comparison with an environmentally balanced area. On the other hand, the MS-03 station is being taken as a reference point of the other stations near the mining zone. This comparison allows us to quantify and compare the details related to mining activity in relation to the surrounding water resources of the area.
pH
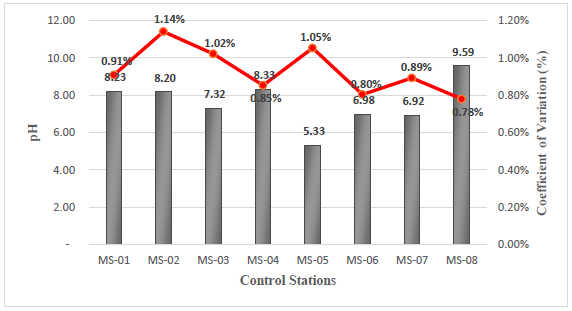
The results obtained from the field analysis indicate pH values that vary from slightly acidic to slightly alkaline, with a minimum pH value of 5.33 corresponding to station MS- 05 and a maximum value of 9.59 corresponding to station MS-08, see Figure 3. According to the Supreme Decree 004-2017-MINAM corresponding to Category 3, for vegetable irrigation, the limits for pH are between 6.5 - 8.5. Comparing it based on the data obtained at the 8 stations, it can be observed that stations MS-05 and MS-08 are outside the permissible limits. Additionally, Category 3 for animal drinking water establishes a pH between 6.5 - 8.4, and based on the data obtained, stations MS-05 and MS-08 are also outside the established limits.
Total Dissolved Solids (TDS)
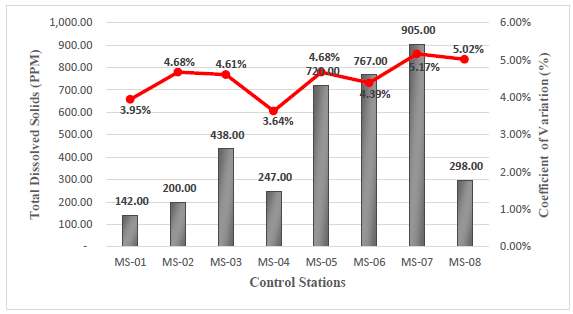
The data obtained in the field for this parameter indicate a minimum value of 142 ppm, corresponding to station MS-01, and a maximum value of 905 ppm, corresponding to station MS-05, see Figure 4. Close monitoring of TDS is necessary because at high levels, they can cause scaling and corrosion when used17,18.
Salinity
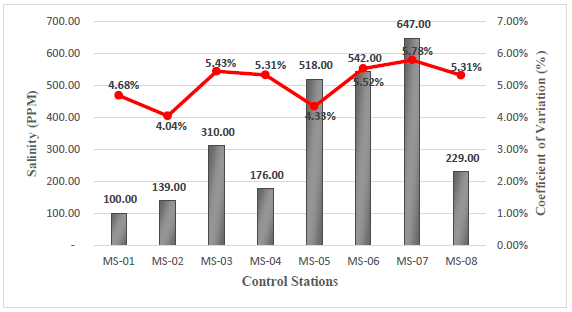
The salinity parameter in the field had a minimum value of 100 ppm, corresponding to station MS-01, and a maximum value of 647 ppm, corresponding to station MS-07, see Figure 5. The control of this parameter is of vital importance to avoid significant damage to the soil, since high concentration of salt affect the quality of vegetation and organic matter in the area19.
Temperature
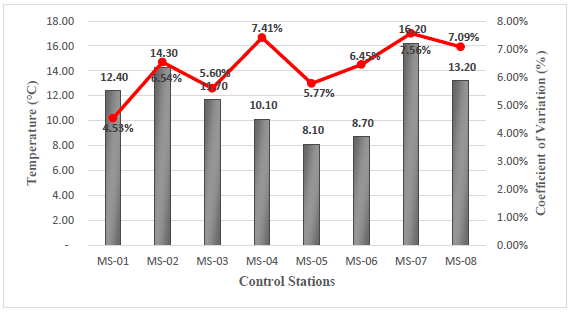
The results obtained from the temperature field measurements vary from 8.1°C corresponding to station MS-05, to 16.2°C corresponding to station MS-07, see Figure 6.
Ionic Balance
Ionic balance is an indicative parameter that establishes that there must be a balance between the chemical components of water, where cations and anions must be in the same proportions. In addition, the result of the ionic balance will determine the quality of the chemical analysis 20,21. For this purpose, a maximum allowable percentage of error is established, which is determined by the following formula.
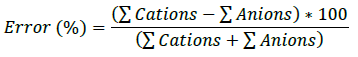
The allowed error varies depending on each author, but generally ranges from ±5% to a maximum of ±10%22,23. The variability in terms of the percentage of error is mainly caused by the presence of minor ions that are not evaluated in the chemical analysis. The results of the chemical analysis for the different stations indicate a maximum error percentage in station MS-07 with -53.30% and a minimum error percentage in station MS-08 with -2.63%. Thus, station MS-01 with a result of -8.73% is the only one that falls within the permissible limit, see Table 1. This does not mean that the other stations do not have reliable chemical analyses, but the presence of minor ions causes this variability when developing the corresponding chemical analyses.
| Ca2+ | Mg2+ | Na+ | K+ | HCO3- | SO42- | Cl- | |
|---|---|---|---|---|---|---|---|
| M.W. | 40.08 | 24.31 | 22.99 | 39.1 | 61.02 | 96.06 | 34.45 |
| MS-01 | 26.80 | 4.66 | 2.00 | 0.40 | 79.00 | 31.00 | 8.00 |
| mmole/l | 0.67 | 0.19 | 0.09 | 0.01 | 1.29 | 0.32 | 0.23 |
| meq/l | 1.34 | 0.38 | 0.09 | 0.01 | 1.29 | 0.65 | 0.23 |
| ∑meq/l | 1.82 | 2.17 | |||||
| Error (%) | -8.731 | ||||||
| MS-02 | 33.50 | 6.29 | 1.60 | 0.60 | 49.00 | 124.00 | 12.00 |
| mmole/l | 0.84 | 0.26 | 0.07 | 0.02 | 0.80 | 1.29 | 0.34 |
| meq/l | 1.67 | 0.52 | 0.07 | 0.02 | 0.80 | 2.58 | 0.34 |
| ∑meq/l | 2.27 | 3.72 | |||||
| Error (%) | -24.163 | ||||||
| MS-03 | 50.00 | 12.64 | 0.90 | 1.50 | 14.00 | 297.00 | 18.00 |
| mmole/l | 1.25 | 0.52 | 0.04 | 0.04 | 0.23 | 3.09 | 0.51 |
| meq/l | 2.50 | 1.04 | 0.04 | 0.04 | 0.23 | 6.18 | 0.51 |
| ∑meq/l | 3.61 | 6.92 | |||||
| Error (%) | -31.409 | ||||||
| MS-04 | 43.70 | 8.24 | 2.60 | 0.60 | - | 69.00 | 8.00 |
| mmole/l | 1.09 | 0.34 | 0.11 | 0.02 | - | 0.72 | 0.23 |
| meq/l | 2.18 | 0.68 | 0.11 | 0.02 | - | 1.44 | 0.23 |
| ∑meq/l | 2.99 | 1.66 | |||||
| Error (%) | 28.493 | ||||||
| MS-05 | 50.00 | 14.85 | 4.50 | 6.00 | 0.99 | 527.00 | 4.00 |
| mmole/l | 1.25 | 0.61 | 0.20 | 0.15 | 0.02 | 5.49 | 0.11 |
| meq/l | 2.50 | 1.22 | 0.20 | 0.15 | 0.02 | 10.97 | 0.11 |
| ∑meq/l | 4.07 | 11.10 | |||||
| Error (%) | -46.386 | ||||||
| MS-06 | 50 | 12.99 | 25.30 | 5.80 | - | 571.00 | 8.00 |
| mmole/l | 1.25 | 0.53 | 1.10 | 0.15 | - | 5.94 | 0.23 |
| meq/l | 2.50 | 1.07 | 1.10 | 0.15 | - | 11.89 | 0.23 |
| ∑meq/l | 4.81 | 12.11 | |||||
| Error (%) | -43.137 | ||||||
| MS-07 | 50.00 | 14.01 | 9.90 | 10.80 | 0.99 | 675.00 | 8.00 |
| mmole/l | 1.25 | 0.58 | 0.43 | 0.28 | 0.02 | 7.03 | 0.23 |
| meq/l | 2.50 | 1.15 | 0.43 | 0.28 | 0.02 | 14.05 | 0.23 |
| ∑meq/l | 4.35 | 14.30 | |||||
| Error (%) | -53.304 | ||||||
| MS-08 | 50.00 | 6.26 | 4.00 | 5.30 | - | 164.00 | 3.00 |
| mmole/l | 1.25 | 0.26 | 0.17 | 0.14 | - | 1.71 | 0.08 |
| meq/l | 2.50 | 0.52 | 0.17 | 0.14 | - | 3.41 | 0.08 |
| ∑meq/l | 3.32 | 3.50 | |||||
| Error (%) | -2.634 |
Piper Diagram
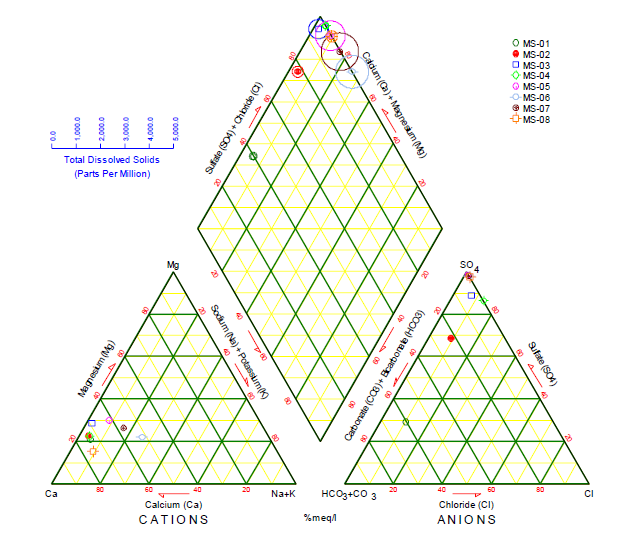
The Piper diagram represents, through a graph, the chemical compounds of water samples, where cations and anions are shown in separate ternary graphics, which, through their projection, are graphed on a diamond in the center of the diagram24. In each ternary graph, there is a representation of the main ions, in the case of cations (Na+, Ca2+ K+, and Mg2+) and for anions (Cl-, SO 2-, CO 2-, and HCO -), where their intersection indicates the representation of the complete chemical composition of the water sample25. Its function is to visualize the possible mixtures between different types of water, as well as to understand the present geochemical evolution of the site26.
s shown in Figure 7, the predominant water type for stations MS-02 to MS-08 is calcic sulfate water, due to the high presence of sulfate ions in the different stations, while station MS-01 is classified as calcic bicarbonate wáter, due to the bicarbonate present in that station.
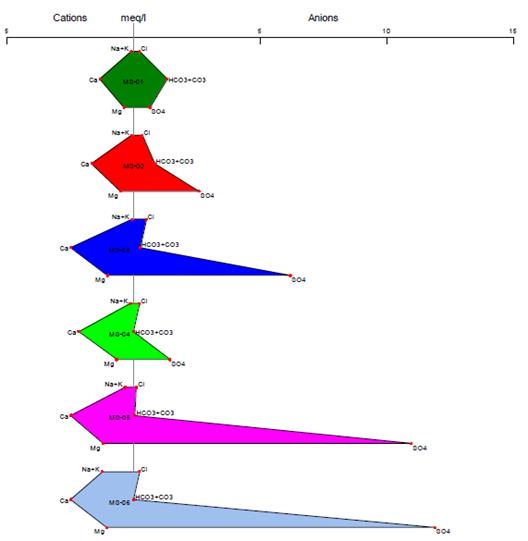
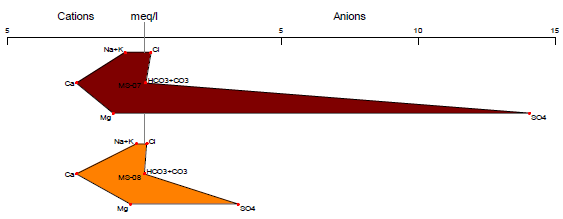
Stiff Diagram
The Stiff diagram represents graphically the ionization present in the chemical composition of the water where the anions are located on the left side of the graph and the cations on the right27. The graph allows us to identify the amount of ions and cations present, by forming a polygon resulting from the union of the negative and positive ion ends28. The Stiff diagram is useful for visualizing the ions and their distribution, making it a widely used tool for identifying possible sources of contamination or the geology of the site29.
In Figures 8 and 9, we can see the anions and cations for each station, according to the provisions of Supreme Decree 004-2017-MINAM. All stations are below the Environmental Quality Standards established in Category 3, both for vegetable irrigation and animal drinking. The results of the Stiff diagram show that the predominant ions for station MS-01 are calcium and bicarbonate, while for the other stations, the predominant ions are calcium and sulfate.
The high presence of bicarbonates in the MS-01 stations may be a result of the weathering of carbonate rock minerals, as well as the weathering and dissolution of clastic and calcareous rocks that make up the lithology of the study area30. On the other hand, for the other stations, the high presence of sulfate may be a result of the oxidation of minerals such as sphalerite, chalcopyrite, and marmatite, which are present in the study area31, 32.
Results and Discussions of Chemical Analysis
In accordance with the provisions of Supreme Decree 004-2017-MINAM, a comparison was made between the data obtained at each station and the limits established in Category 3 of the aforementioned decree, for physical, chemical, and microbiological parameters as well as parasitic ones, see Tables 2 and 3.
Regarding pH, the decree establishes a limit between 6.5-8.4, and stations MS-05 and MS-08 exceed these permissible limits with a pH of 5.33 and 9.59, respectively. This indicates that the water at the first-mentioned station is slightly acidic, while the water at the second station is slightly alkaline.
In both cases, appropriate treatment is required to neutralize them. For station MS-05, which has slightly acidic water, treatment with calcium carbonate (CaCO3) or slaked lime, or calcium hydroxide (Ca(OH)2) can be performed, as both additives are effective in neutralizing acidic water. In the case of station MS-08, which has slightly alkaline water, acidification treatment can be carried out using sulfuric acid (H2SO4) or hydrochloric acid (HCl) to reduce pH and neutralize alkalinity33.
Regarding the inorganic parameters evaluated, stations MS-05 and MS-06 exceed the permissible limit for iron, which is 5 mg/l, with values of 21.9 and 32.4 mg/l, respectively. Excess iron in water must be treated using methods that oxidize iron, such as treatment with potassium permanganate (KMnO4), or with products like chlorine, which also oxidize iron, followed by removal through filtration or decantation.
In the case of manganese, stations MS-03, MS-05, MS-06, and MS-07 exceed the permissible limit of 0.2 mg/l, with values between 1.22 and 1.83 mg/l. Treatment for this chemical element is similar to that for iron, using potassium permanganate (KMnO4) to oxidize the manganese and remove it through filtration.
Finally, we have zinc, which has a permissible limit of 2 mg/l for vegetable irrigation and 24 mg/l for animal drinking. All stations except MS-01, MS-04, and MS-08 exceed the permissible limit, with values between 2.08 and 6.01 mg/l. Treatment for this element is generally carried out through chemical precipitation. The chemicals used for this process depend on the characteristics of the water, with the most common being calcium hydroxide (Ca(OH)2), calcium sulfate (CaSO4), sodium hydroxide (NaOH), and aluminum sulfate (Al2(SO4)3), followed by filtering the zinc
For other physical, chemical, inorganic, microbiological, and parasitological parameters, the stations are below the permissible levels or those established in Supreme Decree 004- 2017-MINAM for Category 3, both for vegetable irrigation and animal drinking.
Table 2 Chemical Analysis Results for Stations MS-01 to MS-04
| Parameters | Unit of Measurement | D1: Vegetable Irrigation | D2: Animal Drinking Water | Surface Water Samples | |||||||
| Unrestricted Irrigation Water (c) | Restricted Irrigation Water | Animal Drinking Water | MS-01 | MS-02 | MS-03 | MS- 04 | |||||
| PHYSICAL - CHEMICAL PARAMETERS | |||||||||||
| Bicarbonates | mg/l | 518 | ** | 79 | 49 | 14 | - | ||||
| Chlorides | mg/l | 500 | ** | 8 | 12 | 18 | 8 | ||||
| Conductivity - Nitrates (NO3 -N) | (µS/cm) | 2500 | 5000 | 203 | 286 | 630 | 344 | ||||
| Nitrites (NO2 - N) | mg/l | 100 | 100 | 0.09 | 0.09 | 0.4 | 0.09 | ||||
| Potential of Hidrogen (pH) | Unidad de pH | 6.5 - 8.5 | 6.5 - 8.4 | 8.23 | 8.2 | 7.32 | 8.33 | ||||
| Sulfates | mg/l | 1000 | 1000 | 31 | 124 | 297 | 69 | ||||
| Temperature | °C | Δ3 | Δ3 | 12.4 | 14.3 | 11.7 | 10.1 | ||||
| INORGANIC PARAMETERS | |||||||||||
| Barium | mg/l | 0.7 | ** | 0.025 | 0.028 | 0.025 | 0.033 | ||||
| Boron | mg/l | 1 | 5 | 0.09 | 0.09 | 0.09 | 0.09 | ||||
| Copper | mg/l | 0.2 | 0.5 | 0.002 | 0.006 | 0.025 | 0.002 | ||||
| Iron | mg/l | 5 | ** | 0.09 | 0.09 | 0.2 | 0.2 | ||||
| Lithium | mg/l | 2.5 | 2.5 | 0.009 | 0.009 | 0.009 | 0.009 | ||||
| Magnesium | mg/l | ** | 250 | 4.66 | 6.29 | 12.64 | 8.24 | ||||
| Manganese | mg/l | 0.2 | 0.2 | 0.019 | 0.215 | 1.22 | 0.001 | ||||
| Lead | mg/l | 0.05 | 0.05 | 0.003 | 0.003 | 0.003 | 0.003 | ||||
| Zinc | mg/l | 2 | 24 | 0.004 | 2.08 | 6.01 | 0.055 | ||||
| MICROBIOLOGICAL AND PARASITOLOGICAL PARAMETERS | |||||||||||
| Thermotolerant Coliforms | MPN/100ml | 1000 | 2000 | 1000 | 1.79 | 1.79 | 1.79 | ||||
a. For clear waters. No abnormal changes (for waters that present natural coloration).
b. After simple filtration. (c): For the irrigation of public parks, sports fields, green areas, and ornamental plants, only the microbiological and parasitological parameters of the unrestricted irrigation type apply. ∆ 3.00: means a variation of 3 degrees Celsius with respect to the multi-year monthly average of the evaluated area. The symbol ** within the table means that the parameter does not apply to this Subcategory. Parameter values are reported in total concentrations unless otherwise indicated.
Source: Adapted from MINAM12.
| Parameters | Unit of Measurement | D1: Vegetable Irrigation | D2: Animal Drinking Water | Surface Water Samples | |||||||
|---|---|---|---|---|---|---|---|---|---|---|---|
| Unrestricted Irrigation Water (c) | Restricted Irrigation Water | Animal Drinking Water | MS-01 | MS-02 | MS-03 | MS- 04 | |||||
| PHYSICAL - CHEMICAL PARAMETERS | |||||||||||
| Bicarbonates | mg/l | 518 | ** | 0.9 | - | 0.9 | - | ||||
| Chlorides | mg/l | 500 | ** | 4 | 8 | 8 | 3 | ||||
| Conductivity | (µS/cm) | 2500 | 5000 | 1022 | 1105 | 129 | 456 | ||||
| Nitrates (NO - - N) Nitrites (NO - - N) | mg/l | 100 | 100 | 1.1 | 1.9 | 2.1 | 0.4 | ||||
| Potential of Hidrogen (pH) | Unidad de pH | 6.5 - 8.5 | 6.5 - 8.4 | 5.33 | 6.98 | 6.92 | 9.59 | ||||
| Sulfates | mg/l | 1000 | 1000 | 527 | 571 | 675 | 164 | ||||
| Temperature | °C | Δ3 | Δ3 | 8.1 | 8.7 | 16.2 | 13.2 | ||||
| INORGANIC PARAMETERS | |||||||||||
| Barium | mg/l | 0.7 | ** | 0.018 | 0.016 | 0.032 | 0.05 | ||||
| Boron | mg/l | 1 | 5 | 0.09 | 0.09 | 0.09 | 0.09 | ||||
| Copper | mg/l | 0.2 | 0.5 | 0.132 | 0.033 | 0.024 | 0.002 | ||||
| Iron | mg/l | 5 | ** | 21.9 | 32.4 | 3.1 | 0.5 | ||||
| Lithium | mg/l | 2.5 | 2.5 | 0.01 | 0.009 | 0.009 | 0.01 | ||||
| Magnesium | mg/l | ** | 250 | 14.85 | 12.99 | 14.01 | 6.26 | ||||
| Manganese | mg/l | 0.2 | 0.2 | 1.764 | 1.56 | 1.83 | 0.077 | ||||
| Lead | mg/l | 0.05 | 0.05 | 0.045 | 0.016 | 0.011 | 0.003 | ||||
| Zinc | mg/l | 2 | 24 | 6.01 | 6.01 | 6.01 | 0.06 | ||||
| MICROBIOLOGICAL AND PARASITOLOGICAL PARAMETERS | |||||||||||
| Thermotolerant coliforms | MPN/100ml | 1000 | 2000 | 1000 | 1.79 | 1.79 | 1.79 | 1.79 | |||
Table 3. Chemical Analysis Results for stations MS-05 to MS-08
a. For clear waters. No abnormal changes (for waters that present natural coloration).
b. After simple filtration. (c): For the irrigation of public parks, sports fields, green areas, and ornamental plants, only the microbiological and parasitological parameters of the unrestricted irrigation type apply. ∆ 3.00: means a variation of 3 degrees Celsius with respect to the multi-year monthly average of the evaluated area. The symbol ** within the table means that the parameter does not apply to this Subcategory. Parameter values are reported in total concentrations unless otherwise indicated.
Source: Adapted from MINAM12.
CONCLUSIONS
The results of the comparison between the physico-chemical parameters and the permissible limits of Supreme Decree 004-2017-MINAM were positive, since the decree establishes a permissible limit for pH based on category 3, for vegetable irrigation of 6.5-
8.4 and for animal drinking of 6.4-8.4. All stations comply with this established limit, except for stations MS-05 and MS-08, which have a pH of 5.33 and 9.59, respectively.
Station MS-05, with a pH of 5.33, would be classified as slightly acidic and requires treatment to neutralize it. For this, the use of calcium carbonate (CaCO3) or lime slurry or calcium hydroxide (Ca(OH)2) is recommended to neutralize the acidity of the water. On the other hand, station MS-08, with a pH of 9.59, would be classified as slightly alkaline, for which acidification treatment is recommended using sulfuric acid (H2SO4) or hydrochloric acid (HCl) to reduce the pH and neutralize the alkalinity. Regarding other evaluated physicochemical parameters such as electrical conductivity, salinity, temperature, and total dissolved solids, all evaluated stations comply with the permissible limits established in the Supreme Decree.
The elaboration of the Piper diagram allowed us to classify the types of water present in the different stations, resulting in the predominance of calcium sulfated water, and for station MS-01, calcium bicarbonate water. On the other hand, the Stiff diagram allowed us to observe the predominant ions in each station, resulting in sulfate (SO4 2-) as the predominant ion and for station MS-01, the predominance of bicarbonate (HCO3 -). Regarding the evaluation of inorganic parameters and what is established in the Supreme Decree, the most outstanding ions were evaluated, such as barium, boron, copper, iron, lithium, magnesium, manganese, lead, and zinc, for which high levels of iron, manganese, and zinc content were found.
For iron, stations MS-05 and MS-06 exceed the permissible limits of 5 mg/l, with values of 21.9 and 32.4 mg/l, respectively. It is recommended to treat the water with potassium permanganate (KMnO4) or with products such as chlorine to oxidize the iron, and then remove it through filtration or decantation.
In the case of manganese, stations MS-03, MS-05, MS-06, and MS-07 are above the established limits of 0.2 mg/l, with values between 1.22 and 1.83 mg/l. For this, the use of potassium permanganate (KMnO4) is recommended to oxidize the manganese and eliminate it through filtration.
Finally, zinc, which establishes permissible limits of 2 mg/l for vegetable irrigation and 24 mg/l for animal drinking, all stations except MS-01, MS-02 and MS-08, exceed the permissible limit, with values between 2.08 and 6.01 mg/l. It is recommended to carry out treatment through chemical precipitation, using chemical elements based on the water characteristics, such as calcium hydroxide (Ca(OH)2), calcium sulfate (CaSO4), sodium hydroxide (NaOH), and aluminum sulfate (Al2(SO4)3), then proceed with zinc filtration.
For the case of other inorganic elements, as well as microbiological and parasitological parameters, the stations are within the established permissible limits.
In conclusion, the water resources in this study show acceptable values according to the environmental quality standards established in Supreme Decree 004-2017-MINAM. However, they can still be used for vegetable irrigation and animal drinking, with proper treatment to minimize or control the values of the exceeded parameters, such as pH and the concentration of iron, manganese, and zinc.

