


 Inglés (pdf)
 Articulo en XML
 Referencias del artículo
 Enviar articulo por email
 Citado por SciELO
  Similares en
SciELO
Similares en
SciELO 
 Permalink
1. Introduction
Purple corn cob is a by-product of purple corn processing that is used as fuel and for animal feed. The cob has a high content of bioactive compounds, including phenolic compounds considered as antioxidant, anti-inflammatory and anti-carcinogenic substances, for which its use has high potential (Aguilar, 2022; Hee Yeon et al., 2023).
The extraction of phenolic compounds from purple corn is carried out through an aqueous, alcoholic or hydroalcoholic maceration applying different times and temperatures that can range from 30 minutes to 4 days and from room temperature to 90 °C, respectively (Rafael & Castro, 2023; Aguilar, 2022). The solvent used also plays an important role since it must have an affinity with the analyte, low viscosity and low toxicity; additionally, the use and disposal of large volumes of solvents cause environmental damage. It has been verified that long extraction times can increase the viscosity of the solvent because the concentration gradient decreases and that high temperatures can degrade thermolabile compounds such as anthocyanins (Rafael & Castro, 2023).
Currently, there are emerging technologies for the extraction of bioactive compounds from food that allow the extraction temperature and time to be significantly reduced, avoiding the degradation of these compounds and considered as eco-friendly technologies. Among them are ohmic heating, ultrasound, microwaves, high hydrostatic pressure and high dynamic pressure (Eslami et al., 2023). Halahlah et al. (2023) used high dynamic pressure to process bilberry juice with added polysaccharides (galactoglucomannans and glucuronoxylans) at 80 MPa and different numbers of steps (1, 3 and 5), to evaluate the anthocyanin content. It was found that the number of steps decreases the anthocyanin content (p < 0.05); in the first step, the content was approximately 1000 mg/mL, while in third and fifth step decreased between 10% - 20%. On the other hand, Zhang et al. (2023) showed that high dynamic pressure processing of burdock root (148 MPa / 63 °C / 1 hour) allows extracting polysaccharides composed mainly of fructose, glucose and arabinose with antioxidant power. The mean inhibitory capacity of free radicals of the processed sample was 3.93 mg Trolox/mL, suggesting its use as an ecological and efficient extraction process of the polysaccharide.
In a study carried out by Szczepańska et al. (2022) it was verified that the application of high dynamic pressure (DHP) in carrot juice (150 MPa, 5 steps and temperature less than 35°C) decreases the viscosity of the juice, increases the content of carotenoids by 151% (Z -β-carotene) and prolongs its shelf life by three days when stored at 4°C. Liu et al. (2022) also carried out a study on the application of high dynamic pressure in carrot juice combined with peach (250 MPa, 1 step and 25 °C), concluding that pressures higher than 200 MPa retain a greater amount of carotenoids and polyphenols in compared to juice not processed by DHP. Pirozzi et al. (2022) applied high dynamic pressure to agroindustrial residues such as tomato pomace in order to isolate cellulose for biorefinery. Cellulose was isolated using sequential chemical hydrolysis in combination with mechanical pretreatment via DHP. The results showed that the DHP pretreatment (80 MPa and 10 passes) promoted a slight increase in cellulose extraction yield (more than 9%) correlated with the decrease in lignin content and a significant increase in acid extraction yield. phenolics and carotenoids (77.9%). These results suggest that the DHP treatment caused structural changes in the cellular compartments and the disruption of the cell membranes of the sample, releasing intracellular substances such as bioactive compounds.
Scientific evidence shows that high dynamic pressure is a non-thermal technology widely used to, partially or totally, replace conventional extraction processes, preserving the sensory and nutritional characteristics of the fluid product. The pressure originated within the system causes physical phenomena such as cavitation, shear and turbulence that are responsible for the extraction and preservation of the bioactive compounds of the product (Lima & Rosenthal, 2022). Despite this, in recent years there is little scientific literature that shows its use in the extraction of bioactive compounds in by-products such as purple corn cob, unlike its use in the extraction of polysaccharides. For example, Zhang et al. (2023), He et al. (2022), and Zhao et al. (2020) used DHP to optimize yields in the extraction of polysaccharides from burdock root, Polygonatum kingianum Coll. et Hemsl. and barley, respectively, reaching values of 29%, 32% and 10%, for each plant material.
In this context, the objective of this study was to extract the bioactive compounds from the purple corn cob by high dynamic pressure at different processing temperatures, as an alternative to the conventional extraction technique and show its potential for use in the Development of beneficial food products for health.
2. Methodology
Conditioning of the sample
The purple corn was acquired from a popular market located in the city of Chimbote, Ancash region, Peru. The purple corn cob was dried in an oven with air circulation at 50 °C for 24 hours, cut and ground to reduce the particle size, and sieved through a 60-mesh sieve for 5 minutes. The purple corn cob powder was placed in low-density polyethylene (LDPE) / ethylene vinyl alcohol (EVOH) bags and sealed using a vacuum sealer (Baseline P 100 / 300 w, MULTIVAC, Germany). The samples were stored at 4 °C until used.
Physical characteristics and composition of the purple corn cob powder
The particle size was determined using a particle analyzer (SIROCCO 2000, MALVER INSTRUMENTS, ENGLAND). The moisture and ash contents were determined by gravimetric methods (AOAC, 2005); the crude protein content was determined using the Kjeldahl method (IAL, 2008) with a conversion factor of 6.25; and the lipid content was determined using the Bligh & Dyer (1959) method.
Conventional extraction (CE)
The corn cob extracts were prepared using a powder: solvent ratio of 1:30 (w / v), and the solvent used was a 20% (v / v) ethanol-water solution acidified to pH 2 with 1 N HCl. The mixture was placed in flexible LDPE / EVOH / activated carbon packages, sealed using a vacuum sealer and heated in a thermostatic bath (MOD 116, FANEM ®, Brazil) for 2.5 hours at temperatures of 25 °C, 45 °C and 65 °C. The extracts were filtered through Whatman filter paper No. 1 under vacuum, placed in amber bottles, covered with aluminum foil and stored at 4 °C.
Extraction by dynamic high pressure (DHP)
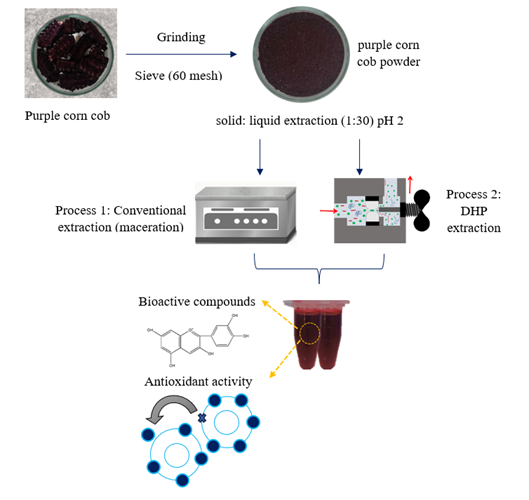
The DHP processes were carried out using a continuous homogenizer (Panda Plus, GEA Niro Soavi, Italy) with a maximum flow rate of 9 L / h. The corn cob powder: solvent mixtures were prepared in a 1:30 (w / v) ratio, placed in 400 mL beakers, covered with aluminum foil, and subjected to high dynamic pressure varying the pressures (20 MPa, 40 MPa and 60 MPa / 1 step) and inlet temperatures (25 °C, 45 °C and 65 °C). At the exit from the homogenizer, the samples were collected in other beakers, covered with aluminum foil and cooled in a water/ice bath. The extracts were centrifuged at 1000 x g for 20 minutes at 25 °C, placed in amber bottles, covered with aluminum foil and stored at 4 °C. The Figure 1 shows the scheme of the purple corn cob extraction process.
Color Analysis
The color of the extracts was measured using a digital colorimeter (HUNTERLAB, UltraScan PRO, USA) based on the CIELAB color space system (L *, a * and b *) (Montes et al., 2005). The cylindrical coordinates Cab * (chroma) and hab (Hue angle) were calculated from the parameters L *, a * and b *, which define the intensity and tone of the samples according to equations 1 and 2 respectively.
 ()
()
 ()
()Total monomeric anthocyanin content (TAC)
The TAC was determined using the AOAC differential pH method (2005). Aliquots of the extract were diluted in amber tubes with 0.025 M potassium chloride (pH 1) and 0.4 M sodium acetate (pH 4.5) buffer solutions, and the absorbance of the solutions determined in the visible region at 520 nm and 700 nm using a spectrophotometer (UV-VIS DU® 800, Beckman Coulter, USA).
The anthocyanin content was expressed as cyanidin 3-O-glucoside according to the following equation 3.
Where ‘ε’ is the molar absorptivity, ‘l’ is the length of the passage through the cell, ‘A’ is the absorbance, ‘MW’ is the molecular weight of the reference standard and ‘DF’ is the dilution factor. The equation was converted to express the results in milligrams of cyanidin 3 glucoside per gram of dry weight or mg Cy3G/g dry weight.
 ()
()Total phenolic compound (TPC) content
The TPC content was determined using the Folin-Ciocalteu colorimetric method according to Singleton & Rossi (1965), with some modifications. 0.5 mL aliquots were taken and transferred to amber tubes, 2.5 mL of the Folin-Ciocalteu solution added, and the volume completed (10 mL) with the extraction solution used in the extraction (20% ethanol-water / pH 2). The samples were left to rest in the dark for 5 minutes, 2 mL of a 7.5% sodium carbonate solution added, and the tubes left in the dark for a further 2 hours. The absorbance was measured at 760 nm using a spectrophotometer (DU® 800 UV/Visible Spectrophotometer, Beckman Coulter, USA). The phenolic compound content was the concentration read multiplied by the corresponding dilution factor and the results were expressed in milligrams of gallic acid (GAE) per gram of dry weight or mg GAE / g dry weight.
In vitro study of the antioxidant activity of purple corn cob extracts processed by dynamic high pressure
Oxygen Radical absorbance capacity - ORAC
The ORAC procedure was carried out according to Ou et al. (2013) in 75 mM phosphate buffer (pH 7.4), with a final reaction mixture of 200 uL. Twenty-five microliters of the antioxidant solutions plus 150 uL of a 11.12 x 10⁻² (M fluorescein solution were placed in the microplate wells, the microplate preincubated for 10 min at 37 °C and twenty-five microliters of AAPH (2, 2’-azobis (2-methylpropionamidine) dihydrochloride) then added rapidly to each well using a multichannel pipet. The readings were carried out using a microplate reader (Synergy HT, Biotek® Instruments Inc., USA) and the fluorescence recorded every minute for 120 min, the microplate being automatically shaken before each reading. The results were expressed in μmol of Trolox (TE) per gram of dry weight.
Ferric Reducing Antioxidant Power assay - FRAP
In this case the antioxidant activity was determined according to Benzie & Strain (1996). The FRAP reagent was prepared daily by mixing 2.5 mL acetate buffer (0.3 M pH 3.6), 2.5 mL of a 10 mM TPTZ solution (2,4,6-Tris (2-pyridyl) -s-triazine) and 2.5 mL of a 20 mM aqueous solution of ferric chloride, and maintained at 37 °C. The test solutions were prepared by mixing a 90 μL aliquot of each extract dilution, 270 μL distilled water and 2.7 mL of FRAP reagent, homogenized using a tube shaker and maintained in a water bath at 37 °C.
The absorbance was measured at 595 nm after 30 min using a microplate reader (Synergy HT, Biotek® Instruments Inc., USA) and the results expressed in μmol of Trolox (TE) per gram of dry weight.
Identification of the anthocyanins in the purple corn cob extracts by Ultra-performance liquid chromatography tandem mass spectrometry (UPLC-MS/MS)
An ultra-performance liquid chromatography system (Waters Xevo I-Class, Milford, USA) coupled to a tandem mass spectrometry detector (Waters Xevo TQD, Milford, USA) with electrospray source ionization (ESI) in the negative mode was used to identify the anthocyanins in the purple corn cob extracts. The chromatographic separation was carried out using an ACQUITY UPLC® HSS T3 column (100 mm x 2.1 mm x 1.8 µm, Waters, Milford, USA) with a flow rate of 0.6 mL/min. The mobile phase was composed of solvent A (0.1% TFA in water) and solvent B (acetonitrile). The gradient started at 10% B, rose to 35% over 5 min, and then increased to 100% B in 7 min. The MassLynx software (Waters Co. Milford, USA) version 4.1 was used for instrument control and data processing.
The samples were analyzed in the MS scan mode, and the compound masses extracted according to Pascual-Teresa et al. (2002) using the following operating conditions: capillary voltage 3.5 kV, source temperature 150° C, de-solvation temperature 550 °C, cone gas flow 20 L/h and de-solvation gas flow 900 L/h.
3. Results and discussion
Characterization of the purple corn cob powder
The average diameter of the particles was expressed as D [4,3] (Brouckere average diameter), which indicates the central point around which the frequency of the volume of the distribution rotates (Tonon et al., 2009). The moisture, ash, protein and carbohydrate were 12.02 ± 0.04 %, 3.41 ± 0.03 %, 5.21 ± 0.06 % and 79.33 ± 0.03 %, respectively. According to Strack & Wray (1989) some pigments such as simple anthocyanins, can be found esterified to one or several carbohydrates, or acylated anthocyanins, which can be found esterified to carbohydrates and an acyl radical.
Effect of DHP on the TAC of purple corn cob extracts
Figures 2 shows the effects of DHP on the TAC values (mg Cy3G / g dry weight) in the purple corn cob extracts processed at three temperatures, as compared to the contents determined using CE and in the non-pressurized extracts obtained at the same temperatures. Parameters such as the solvent and the solid: solvent ratio were kept constant.
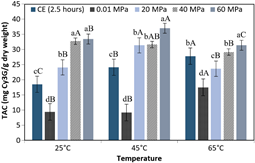
Figure 2 TAC of the extracts obtained by different processing methods and at different temperatures. CE for 2.5 hours, non-pressurized at 0.01 MPa for 3 minutes and DHP (20 MPa, 40 MPa and 60 MPa). The bars are means ± standard deviation (n = 3). Means with the same lower-case letters in the same column indicate that there is no significant difference (p > 0.05, Tukey test) between the extracts subjected to different processing methods considering the same temperature. Different uppercase letters mean there is significant difference (p < 0.05, Tukey test) for different temperatures considering the same processing method.
Figure 2 shows the DHP process at 25 °C, 45 °C and 65 °C for three minutes, demonstrates that the increment in DHP from 20 MPa to 60 MPa significantly increased (p < 0.05) the value for TAC in the extracts by 39%, 18%, and 33%, respectively. It was also observed that the extracts obtained by the process at 20 MPa / 25 °C presented 32% more TAC than the extracts obtained by CE at 25 ºC for 2.5 hours (p < 0.05). The DHP process at 40 MPa / 25 °C could produce an extract with a high value for TAC corresponding to approximately 14% more TAC than that obtained in the extract produced by CE at 65 ºC for 2.5 hours. According to Lima & Rosenthal (2022), these results are those expected in processes involving dynamic pressure, due to the shear exerted by DHP on the plant cells, causing a reduction in particle size and consequently the extraction of metabolites. However, for DHP processes, increases in temperature only produced favorable responses for increases from 25 °C to 45 °C. Anthocyanins have been reported to be easily degradable at increasing temperatures from 70 °C to 100 °C (Rossi et al., 2017). Therefore, it is inferred that temperatures higher than 45 °C accompanied by the mechanical action caused by dynamic high pressure contribute to the decrease in the anthocyanin content of the extracts.
Effects of DHP on the TPC of purple corn cob extracts
Figure 3 shows the effects of DHP, respectively, on TPC (mg GAE / g dry weight), in purple corn cob extracts processed at three temperatures, as compared to the contents found in extracts obtained using CE and in non-pressurized extracts obtained at the same temperatures. Parameters such as the solvent and solid: solvent ratios were maintained constant.
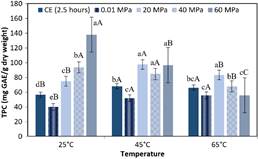
Figure 3 TPC of the extracts obtained by different processing methods at different temperatures. CE for 2.5 hours, non-pressurized at 0.01 MPa for 3 minutes and DHP (20 MPa, 40 MPa and 60 MPa). The bars are means ± standard deviation (n = 3). Means with the same lower-case letters in the same column indicate that there is no significant difference (p > 0.05, Tukey test) between the extracts subjected to different processing methods, considering the same temperature. Different uppercase letters mean there is a significant difference (p < 0.05, Tukey test) between the different temperatures, considering the same process, example 60 MPa at 25 °C, 45 °C and 65 °C (p < 0.05), 40 MPa at 25 °C and 65 °C (p < 0.05), 20 MPa at 45 °C and 65 °C (p < 0.05), and CE at 25 °C and 45 °C (p < 0.05).
The dynamic processes at 25 °C, an increase in DHP from 20 MPa to 60 MPa resulted in a significant increase of 84% in the TPC contents of the extracts. However, at 65 °C there was a decrease in the TPC contents of 33% (p > 0.05) which may have been because of the heat produced by the rapid depressurization during the process at 60 MPa or an additional increase of ~10 °C in the temperature (Kaneiwa et al., 2013). Zapata et al. (2015) reported that another possible cause of the decrease in TPC could be the storage conditions, which could affect the stability of the phenolic compounds due to chemical degradation and losses caused by volatilization (Gonzáles et al., 2010). These compounds may have been degraded and taken part in the formation of isomers and low molecular-weight compounds (Clifford, 2000).
The results obtained for the TPC contents of the extracts were higher than those reported by Sauceda-Galvez et al. (2021) for apple juice obtained by DHP at 300 MPa / 20 °C and Karacam et al. (2015) for strawberry juice obtained by DHP at 60 MPa / room temperature / 2 steps. In the results obtained for the TAC and TPC contents in extracts obtained DHP the process at 60 MPa / 25 °C produced the best results for TPC, while for TAC it was 60 MPa / 45 °C.
Effects of DHP on the color of the purple corn cob extracts
Table 1 shows the color parameters of the purple corn cob extracts obtained DHP at different temperatures and the visual appearances of the purple corn cob extracts obtained from the different processes.
Table 1 shows that the L* and C* parameters of the extracts were not significantly altered (p > 0.05) by increases in the DHP at 25 °C and 65 °C. All the processes presented positive values for a * and negative values for b *, which indicates that the extracts were represented by the colors red and blue, respectively. These color trends resemble those reported by Itthisoponkul et al. (2018) and by Monroy et al. (2016). Regarding the value for h° at a constant processing temperature, an increase in DHP did not significantly alter this parameter (p > 0.05). All the processes presented values for h° within the range from 270.18 ° to 292.09 °, values higher than those obtained using non-pressurized and CE processes. Considering the cylindrical chromatic space CIE-L* C* hº system proposed by Padrón et al. (2012) as the reference, the hue angles correspond to a blue-violet color.
Table 1 Colorimetric parameters (L*, a *, b *, C and h °) in the purple corn cob extracts obtained DHP at three temperatures, compared with the parameters obtained through CE (static maceration-2.5 hours) and non-pressurized extract in the same temperatures
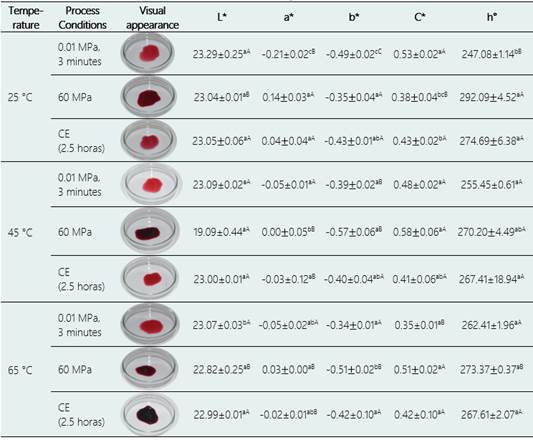
* Colorimetric parameters (L*, a*, b*, C* and h°) of the extracts obtained by different processing and at different temperatures. CE (conventional extraction) for 2.5 hours, 0.01 MPa (non-pressurized) for 3 minutes and DHP. The bars are means ± standard deviation (n = 3). Equal lower-case letters mean that there is no significant difference (p > 0.05, Tukey test) between the extracts subjected to different processing considering the same temperature.
In vitro study of the antioxidant activities of the purple corn cob extracts obtained by DHP
Table 2 shows a comparison of the antioxidant activities (AA) of the non-pressurized extracts, and those obtained by DHP and CE under the conditions that showed high bioactive compound contents. The AA values of the extracts were determined using the ORAC and FRAP assays and the results expressed in μM Trolox (TE) / g dry weight in both cases.
Of the extracts obtained by CE, those obtained in 2.5 hours/ 65 ° C showed the highest AA values according to ORAC. The extract obtained by DHP at 60 MPa/25 ° showed 37% and 123% more AA than that obtained by CE in 2.5 hours/ 65 °C (p < 0.05), according to FRAP and ORAC, respectively. Similar results were obtained by Sauceda-Galvez et al. (2021) in apple juice obtained by DHP at 300 MPa/20 °C, the antioxidant activity of the juice increased by 238% for the ferric ion reduction capacity and 286.4% for the absorption of free radicals.
The methodologies used revealed that the AA values of the purple corn cob extracts obtained by DHP were significantly higher than the values in the extracts obtained by CE, results which are consistent considering that the extracts obtained using high-pressure presented higher TPC contents (Jurić et al., 2019). Several studies have shown a direct relationship between the antioxidant activity and the contents of these compounds (Jurić et al., 2019; Saikaew et al., 2018; Wang et al., 2016; Andrés et al., 2016).
Table 2 Comparative of the antioxidant activity as determined by the ORAC and FRAP assays in the conditions of greater efficiency of DHP
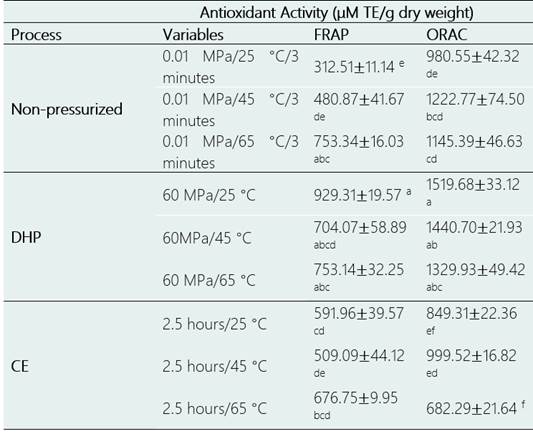
* The data are presented as the means ± standard deviation (n = 3). Same letters in the column indicate that there are no significant differences among the different process conditions (p < 0.05, Tukey test).
UPLC-MS/MS analysis of the anthocyanins in the purple corn cob extracts obtained by DHP and CE
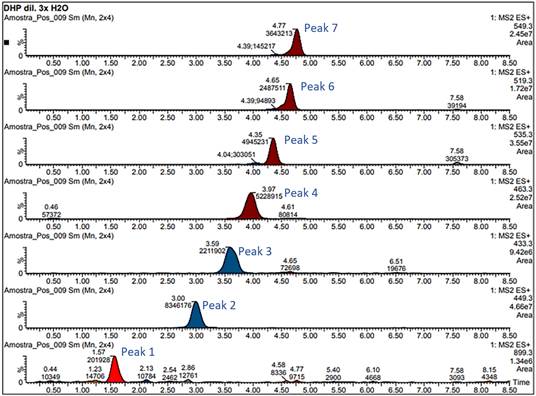
UPLC-MS/MS was applied to the anthocyanin compositions of the purple corn cob extracts obtained by high-pressure technologies and CE. The compounds were identified by comparing their retention times (Pascual-Teresa et al., 2002). Seven anthocyanins were tentatively identified: cyanidin-3-glucoside, pelargonidin-3-glucoside, peonidin-3-glucoside and their respective malonyl derivatives.
The areas of the chromatographic bands of the anthocyanins obtained using the different extraction processes (DHP and CE) (Table 3). Figure 4 shows the mass chromatograms obtained by UPLC-MS/MS for the DHP process. In this study, the chromatographic profiles were like those found by Aoki et al. (2001) in an extract from purple corn seeds, and by Pascual-Teresa et al. (2002) in a commercial extract from purple corn, but different from those reported by Yang et al. (2009) who did not detect the presence of the malonyl derivatives.
Table 3 Areas of the chromatographic bands obtained by technology for the compounds found in the extracts of purple corn
| Peak | Compounds | DHP | CE |
| 1 | Unknown | 199436 | 120026 |
| 2 | Cyanidin-3-glucoside | 8121862 | 11242858 |
| 3 | Pelargonidin-3-glucoside | 2062073 | 2497220 |
| 4 | Peonidin-3-glucoside | 5188770 | 6995596 |
| 5 | Cyanidin-3-(6-malonylglucoside) | 4825857 | 7855386 |
| 6 | Pelargonidin-3-(6-malonylglucoside) | 2480925 | 3792038 |
| 7 | Peonidin-3-(6-malonylglucoside) | 3483688 | 4622761 |
4. Conclusions
The present work demonstrated that dynamic pressures greater than 20 MPa and temperatures below 60°C had a positive effect on the extraction of bioactive compounds and a high content of antioxidant activity with the capacity for ferric ion reduction and oxygen radical absorption. The combination of dynamic high pressure and temperature allowed obtaining up to 108% more content of phenolic compounds and 32% more anthocyanin content in the purple corn cob extracts, compared to conventional extraction at 65 °C and 150 minutes. Processing at different dynamic pressures caused visual changes in the color of the extracts, which were statistically significant in chroma and brightness. Although the effects of conventional techniques in the extraction of bioactive compounds from purple corn are known, those of the high dynamic pressure process were not, so now it appears as a potential and promising alternative technology to improve the extraction of phytochemicals that allow the development of new products with healthy characteristics. Based on the results, it is suggested to optimize the extraction processes of bioactive compounds by high dynamic pressure as a function of temperature and solvent concentration.

