Inglés (pdf)
 Articulo en XML
 Referencias del artículo
 Enviar articulo por email
 Citado por SciELO
  Similares en
SciELO
Similares en
SciELO 
 Permalink
1. Introduction
Access to higher education in low- and middle-income countries (LMICs) has increased in the past decades following a combination of a rising number of secondary school leavers and a renewed family demand for social progress and opportunities (Romero, 2021). Yet increasing access to higher education institutions has not necessarily translated into higher retention and graduation of university students (Schendel & McCowan, 2016; Salas-Pilco & Yang, 2022), especially among students with a low socio-economic status (Balán, 2020). At the same time, the educational landscape in LMICs has been affected by an increasing adoption of artificial intelligence tools to learn about patterns in students’ behavior (Salas-Pilco & Yang, 2022). Driven by the adoption of these tools and the availability of new educational datasets, an applied literature has also developed to predict the academic performance of undergraduate students based on machine learning (ML) algorithms (Albreiki et al., 2021).
Predicting undergraduate students’ academic performance is a relevant academic and administrative task on three grounds. First, by knowing which students face the highest risk of failing a course, faculty and administrative workers can take specific preventive measures and improve their students’ academic achievements (Moreno-Ger & Burgos, 2021). Second, predicting achievement is a task tightly bound to awarding scholarships or delivering tuition discounts (Hajar et al., 2022). Universities often select scholarship recipients based on their expectation of future academic performance in university. Third, predicting academic performance also sheds light on the most important factors for academic success, and can therefore inform selection criteria for the admission of new student cohorts to university (Liu et al., 2023; Niri, 2021).
However, higher education systems in LMICs encounter challenges when attempting to predict undergraduate academic performance. These challenges primarily stem from the limited information available, which often rely heavily on entrance tests that emphasize rote memorization (Romero, 2021; De los Rios, 2023), and from the problem of significant secondary school quality heterogeneity (Andrabi et al., 2022; LBDEAC, 2020). In this context, applied research predicting academic performance in LMICs has one of the following limitations: (1) it focuses on specific programs or courses, reducing the number of observations and affecting generalizability; (2) it lacks historical academic performance data or uses non-comparable information due to secondary school quality heterogeneity; (3) it predicts performance at a single point in time (using cross-sectional data), potentially biasing the view of university performance.
The main objective of this study is twofold: (i) to identify the most accurate ML algorithm for predicting the academic performance of undergraduate students at the Pontifical Catholic University of Peru (PUCP), and (ii) to determine the key predictors of students’ academic performance. To address the limitations mentioned above, the authors analyzed three cohorts of students encompassing all academic programs and the two primary admission channels at PUCP. They ensured the comparability of academic information during the secondary school stage by leveraging the results of a national standardized assessment. Additionally, they employed a panel database that incorporates academic and sociodemographic information spanning students’ secondary school years, the admission period, and their first two years in university.
2. Theoretical framework
This section first briefly describes the key characteristics of the Peruvian context that permeate the nature of the study. It goes on to discuss the common definition of academic performance in other studies within the field of learning analytics and points out why it is relevant to ground the definition on institutional and contextual aspects. It then presents an enhanced framework for predicting undergraduate academic performance in LMICs with compulsory university admission tests.
2.1. The Peruvian higher education system
In Peru, around 80 percent of higher education enrollment is in private institutions, a result both of Law No.882 (passed in the 1990s) geared to promoting private investment in education, and of the historical neglect of public higher education. In 2014, the Peruvian government became more involved in the higher education system and introduced a licensing process for institutions to meet basic quality standards. Only 32.7 percent of for-profit private institutions secured a license (Benites, 2021).
In this context, a distinct group of Peruvian universities stands out, due to their commitment to teaching standards, quality infrastructure, and strict admission criteria. PUCP is a private university, is well-regarded in various rankings (QS WUR; 2023; SIR, 2023) and offers a diverse range of academic programs. PUCP employs multiple admission channels, notably the Upper Third (ITS) and First Option (PO), which require admission tests in mathematics, language, and writing, together with five years of secondary education grades.
2.2. Learning analytics and academic performance prediction
Learning analytics (LA) aims to provide practical insights for educators and institutions to improve teaching and learning processes, often emphasizing efficient resource allocation and enhancing students’ academic achievements in higher education (Leitner et al., 2017; Peña-Ayala et al., 2017). Employing ML techniques, LA focuses on predicting academic performance or drop-out risks, and classifying units based on available data (Susnjak, 2023; Athey & Imbens, 2019). The primary concern when employing a ML model centers on its out-of-sample performance, which involves gauging the model’s ability to predict a target variable accurately when presented with new datasets (Athey & Imbens, 2019).
In applied LA research, the precise definition of “academic performance” is often overlooked, leading to its interchangeable use with “academic achievement” (Alyahyan & Düştegör, 2020). Although these concepts are interconnected, it is necessary to have a clear understanding of academic performance to address academic achievement (York et al., 2015). The former - depending on the data available - can be measured throughout the educational experience, whereas the latter usually correspond to specific educational attainments, such as graduating from university with relatively high grades, or passing a final test. This study defines undergraduate academic performance as an individual-based outcome of the process of undergraduate education that is aligned to educational goals set by the interplay of institutions, faculty and students (Kumar et al., 2021).
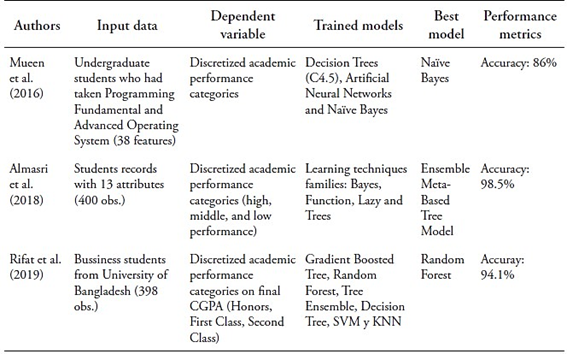
The definition of academic performance mentioned above highlights the need to factor in particular institutional arrangements when making predictions. In particular, within a context characterized by high information frictions, where university admission is no longer contingent upon school grades, it becomes crucial to take into account information derived from admission tests and other supplementary sources, such as standardized school assessments administered by a public entity. To understand the various factors that influence academic performance in LMICs, the authors propose a classification framework that is grounded in two fundamental dimensions of the most commonly employed variables: (i) the level of aggregation and (ii) the time frame.
Source: Authors’ own formulation
Figure 1 Enhanced framework for predicting undergraduate academic performance in a LMIC with a compulsory university admission test.
In this framework for predicting undergraduate academic performance at PUCP, the study considers individual and family-level data, such as prior academic records, in addition to information from the school and broader contextual factors. This framework recognizes the dynamic nature of this information across various educational phases, encompassing two key theoretical perspectives: cognitive theories and sociocultural theories (Lavin, 1965). Cognitive theories emphasize mental processes and intelligence, which have been found to strongly correlate with academic achievement in previous research (Roth et al., 2015; Lemos et al., 2014). These abilities are typically assessed through standardized tests on mathematical skills, reading comprehension, and vocabulary knowledge (Fonteyne et al., 2017), highlighting the importance of both innate capacities and learned knowledge and skills (Kuncel & Hezlett, 2010). Socio-cultural theories highlight the influence of cultural context, societal norms, and socio-economic background on academic performance (Rodriguez et al., 2020; Coleman, 1968).
3. Literature review
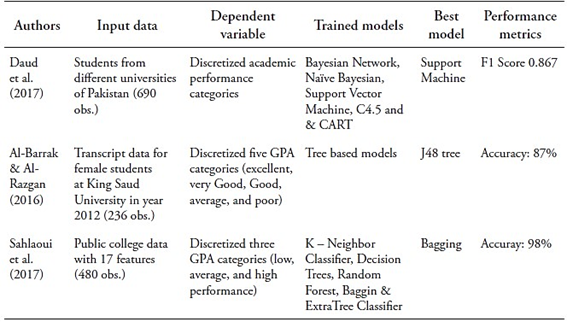
The applied literature on the prediction of undergraduate academic performance using ML models has been prolific (Rastrollo-Guerrero, 2020; Contreras et al., 2022). Despite the diversity of approaches to this prediction task, every study must face three main choices (Alyahyan & Düştegör, 2020): How to define academic performance? Which student attributes should be taken into account? Which is the best performing ML model for this task? This study used these choices as a basis to review the general literature on undergraduate academic performance prediction using ML models with an emphasis on studies in LMICs.
Many studies on the above-mentioned literature discretize the target variable, typically using Grade Point Average (GPA) or cumulative GPA, treating the prediction task as classification (Mueen et al., 2016; Al-Barrak & Al-Razgan, 2016; Almasri et al., 2018; Rifat et al., 2019). They often focus on predicting academic success or failure in specific courses or programs (Sekeroglu et al., 2021). However, this approach has drawbacks. Firstly, academic success varies across stakeholders (York et al., 2015; Cachia et al., 2018), as succeeding in a single course might not guarantee obtaining a degree, and the same degree could reflect different prior levels of academic performance. Secondly, imbalanced data affects predicting minority classes (Rastrollo-Guerrero, 2020), such as drop-outs and top performers. Thirdly, many studies use arbitrary thresholds for classification, neglecting alternative methods.
The literature indicates that prior academic performance, including high school performance, significantly influences initial university-level performance (Gil et al., 2021; Contreras et al., 2022). Standardized admission test results are also relevant factors for predicting academic success (Contreras et al., 2022). Earlier studies employing classic econometric methods in academic performance prediction emphasized the synergy between high-stakes assessments and teacher evaluations (Silva et al., 2020). Additionally, students’ socio-economic backgrounds play a critical role in shaping their academic trajectory (Albreiki et al., 2021). Research in Peru has highlighted the impact of socio-economic factors like parental education, household income, and access to educational resources on educational aspirations, access, and academic performance (Guerrero et al., 2016; Benites, 2021). Economically disadvantaged students often face barriers limiting their educational pursuits, from restricted access to academic support services to financial constraints (Sánchez et al., 2021).
Some of the most common models used to predict undergraduate academic performance in Latin America are Tree-Based Algorithms -such as Gradient Boosted Tree and Random Forest- and the Multilayer Perceptron (Salas-Pilco & Yang, 2022). Accordingly, studies within the reference literature have also shown that ensemble methods tend to outperform individual algorithms (Contreras et al., 2022). Regarding prediction accuracy, there are certain differences depending on the specification of the target variable, namely if academic performance is defined at the course level -rather than the degree or year level- accuracy tends to be higher (Alyahyan & Düştegör, 2020).
In Peru, only research at the primary education level integrates administrative and census data (MINEDU, 2022; Infante & Rojas, 2021). University research relies on university academic records, limiting use for admissions and scholarships. When background data is considered, it often focuses on specific academic programs (Saire, 2023; García, 2021). Furthermore, most studies predict course or year success, not overall academic performance (Puga & Torres, 2023; Incio et al., 2023; Menacho, 2017), limiting policy applications. Studies that consider data at a single point in time also face the problem of “concept drift”, namely, a high risk of disconnection between the training data and new rounds of real-life data in a changing environment (Mathrani et al., 2021). Some studies incorporate ad hoc student surveys with small datasets (<100 observations), affecting model generalizability (Incio et al., 2023; García, 2021).
In the literature, ML studies predicting undergraduate academic performance in LMICs often face one out of three limitations: (i) they focus on specific programs or courses, limiting their applicability for university policies; (ii) they lack access to students’ prior academic performance and background information; and (iii) they rely on achievement indicators, causing conceptual inconsistencies in measuring academic performance. This study contributes to this literature by predicting the academic performance of all undergraduate students admitted through the two primary admission channels at PUCP. This prediction relies on a novel database that integrates comprehensive prior and current academic information from both administrative and census data. The study has developed a tailored model to address the key tasks associated with predicting undergraduate academic performance.
4. Method
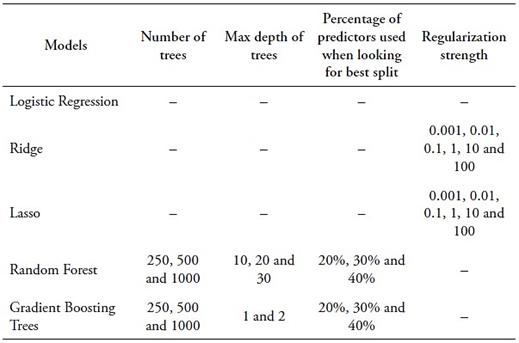
This research uses a qualitative variable, membership in an academic performance group, to predict students’ academic performance. The selection of ML models was guided by two criteria: choosing models with the best performance metrics in previous studies on predicting undergraduate academic performance in LMICs (Salas-Pilco and Yang, 2022; Sekeroglu et al., 2021; Infante & Rojas., 2021) and prioritizing models with higher prediction accuracy for smaller datasets. The selected models include Logistic Regression, Ridge, Lasso, Random Forest, and Extreme Gradient Boosting1.
Ridge regression is a linear regression technique that mitigates overfitting by introducing regularization, which is particularly beneficial for addressing multicollinearity (high predictor correlation). It appends an L2 regularization term to the linear regression cost function, discouraging large weights on predictors, effectively “shrinking” coefficients towards zero, reducing sensitivity to outliers and multicollinearity. In contrast, Lasso, another regularized linear regression technique, employs L1 regularization, which possesses feature selection capabilities. It can drive irrelevant predictor coefficients to exactly zero, resulting in a sparse and interpretable model (James et al., 2013).
Random Forest is a tree-based ensemble ML model that uses bootstrap training samples. It employs a random subset of predictors when considering splits, addressing high correlation between individual trees. By drawing different training sets, the Random Forest model ensures diverse feature sets for the base trees. With a small “m” value, correlation between trees decreases, useful when dealing with highly correlated predictors. During prediction, Random Forest combines tree results via majority voting (classification) or averaging (regression) (James et al., 2013). Finally, the Extreme Gradient Boosting model builds an ensemble of decision trees sequentially, where each tree corrects the errors made by the previous ones. Like the regularized linear regression techniques, Extreme Gradient Boosting incorporates L1 and L2 regularization terms into the objective function to control the complexity of individual trees and avoid overfitting.
We evaluate the selected models using key classification performance metrics: Accuracy, AUC ROC, and F1. Firstly, Accuracy, representing the proportion of correctly classified observations, is straightforward but not ideal for imbalanced learning. Imbalanced learning occurs when models are trained on datasets with unevenly distributed prediction categories, leading Accuracy to overestimate the capability of models predicting the most common class. Secondly, AUC ROC (Area Under the Curve ROC) is more suitable for imbalanced learning. It assesses the models’ ability to make class predictions across all possible thresholds considering probabilistic predictions. Probabilistic predictions range between 0 and 1, and a 0.5 threshold is commonly used to convert probabilities into classes. Thirdly, F1, the standard metric for imbalanced learning, is the harmonic mean between precision and recall. Precision measures correct positive predictions among all positive predictions, while recall represents the number of correctly identified positive observations. Consequently, F1 penalizes false positive and false negative instances.
Furthermore, for tree-based classifier models, assessing the contribution of each predictor is crucial. Gini impurity-based importance is widely used for this purpose, measuring how effectively observations are split by class after each tree node (Disha & Waheed, 2022). This approach calculates feature importance based on the mean decrease in impurity resulting from the splits (Koh & Blum, 2021), offering insights into the relevance of predictors for model explainability and feature selection.
5. Data
In this study, the authors created the PUCP Academic Performance Database (BRA-PUCP) by merging data from four sources. PUCP’s Central Admission Office administrative records (OCAI-PUCP) provided two sources, while the other two were datasets from Peruvian Ministry of Education (MINEDU) censuses. The study initially linked PUCP’s administrative records with MINEDU’s records using matching identification codes: the modular code (MINEDU) and administrative code (PUCP). Yet not all PUCP-registered schools were matched. To enhance matching, the study developed an algorithm to pair school names, with two key conditions: a minimum similarity score of 77 (out of 100) and schools located in the same district, province, and region. Establishing direct correspondence between school names was challenging due to significant variations, as shown in Table 1.
Table 1 Example of school names matched by the algorithm’s similarity score and common location in both records
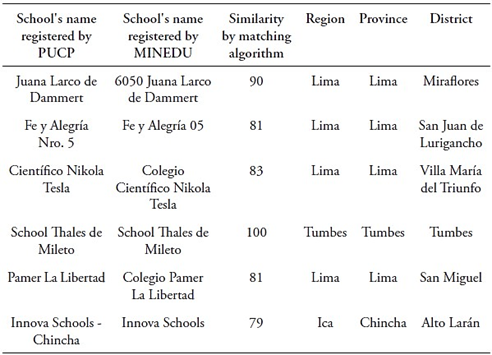
Source: Authors’ own formulation based on OCAI (2023) and MINEDU (2018).
The latter dataset can be described as the List of Identification Codes (LIC). Corresponding identification codes or matching school names facilitate linkage between PUCP’s administrative databases and MINEDU databases, as shown in Table 2. The Reduced Academic Performance Database (BAR) includes academic, administrative, demographic, and socio-economic data for students admitted via ITS and PO in 2018-1, 2019-1, and 2020-1. BAR encompasses secondary education grades, admission test scores, academic performance measures during the first two years, home school pensions, university pension scale, gender, age, and pre-admission residence. It also records academic programs, faculty, and admission channels for each student. The Historical Performance Database (BHR) covers academic performance from 2010-1 to 2021-2 for all channels and programs, sharing all BAR variables except secondary education performance. Both datasets use students as the unit of observation, with all administrative records anonymized to protect personal data.
Table 2 Keys and geographic information employed to merge PUCP administrative datasets with MINEDU datasets
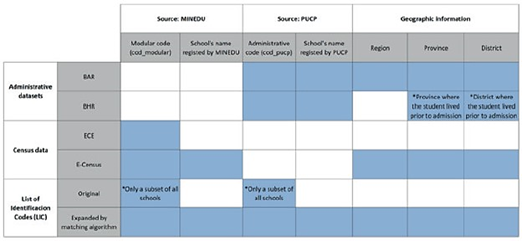
Source: Authors’ own formulation based on OCAI (2023) and MINEDU (2018).
MINEDU oversees two additional datasets: the annual Educational Census (E-Census) and the Student Census Evaluation (ECE). The E-Census includes all registered schools in Peru, providing information on infrastructure, services, enrollment, type, location, staff, and materials. Schools, identified by a modular code, serve as the unit of observation. Data was obtained on high school student numbers, teachers, school modular codes, and geographic locations from these datasets. The ECE comprises national standardized assessments in subjects like mathematics and reading comprehension, occasionally including natural sciences and history. The study employed ECE data for 2015, 2016, and 2018, with proxy variables for students’ family socio-economic status in 2015 and 2016. ECE data is aggregated at the school level, presenting average academic performance indicators.
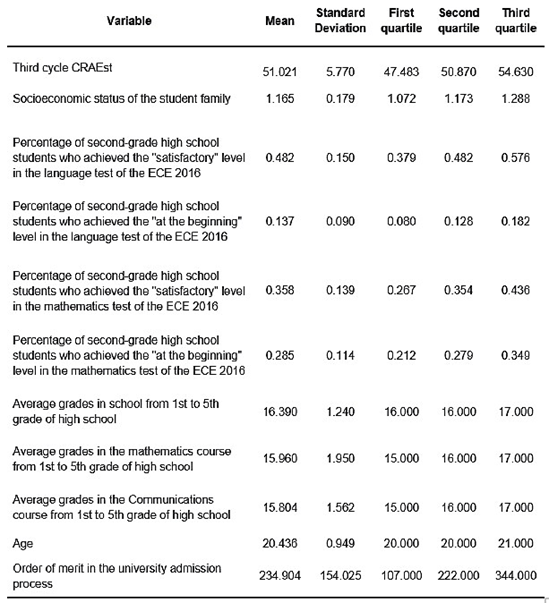
The final database includes 3513 observations and 132 variables, focusing on the academic performance of students enrolled at PUCP from 2018-1 to 2020-1. It incorporates data on their university performance, admission test results, high-school performance, and historical performance indicators for their respective schools. Additionally, the database encompasses demographic, geographic, and socio-economic information, capturing the students’ backgrounds and context. It tracks students’ academic progress up to their second year at the university (see Figure 2).
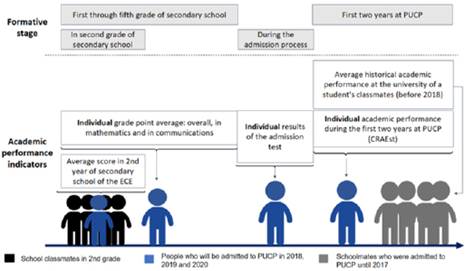
Source: Authors’ own formulation
Figure 2 Type of academic performance information available in the Academic Performance Database (BRA-PUCP)
The study uses the Coefficient of Standardized Academic Achievement (CRAEst) as its target variable. The CRAEst represents an average of standardized grades, weighted by the number of credits of each course c that a student i has completed in their academic history up to the academic cycle T. It is calculated using the following formula:
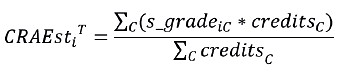
The standardization of grades is determined by the following expression:
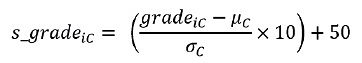
As a cumulative measure, CRAEst covers all courses from the beginning of the undergraduate program up to cycle T. For example, CRAEst 4 reflects the cumulative record up to the fourth cycle, CRAEst 3 up to the third, and so on, ensuring it captures the entire academic history. The study chose CRAEst 3 for two reasons: First, to account for students’ adaptation to university life beyond just the first semester, and second, to reduce potential bias from drop-out data exclusion, as CRAEst 3 has fewer missing values than CRAEst 4.
6. Results
This section presents the study’s empirical findings on undergraduate academic performance prediction at PUCP. Although its target variable, CRAEst 3 , is initially continuous, the study categorizes it into two classes using various quantiles: 50 percent (median), 33 percent (tertile), 20 percent (quintile), 10 percent (decile), 5 percent, and 1 percent (percentile). For example, two classes are established for the 33 percent quantile (tertile): one for CRAEst values below the lowest tertile and another for values above it. The same process is followed for all quantiles.
Table 3 Number of observations per category of prediction at different quantile widths
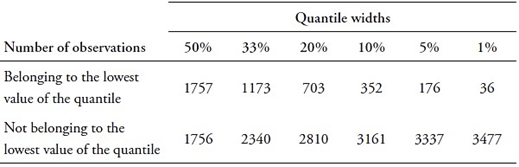
Source: Authors’ own formulation based on OCAI (2023) and MINEDU (2018).
The study explores various quantile widths to set a binary outcome threshold. Smaller widths offer deeper insights: for instance, a narrower quantile reveals higher drop-out risk when a student’s CRAEst 3 falls below its lowest value. However, narrowing quantiles can harm ML model performance due to increased data imbalance. Figure 3 displays model F1 and accuracy metrics at different quantile widths, showing that reducing the width from the median (50 percent) to the percentile (1 percent) substantially lowers F1 while boosting accuracy. In the presence of imbalanced data, F1 demonstrates robustness, while accuracy tends to overestimate the predictive capability of models. The study therefore gives priority to F1 as its primary metric. Figure 3 illustrates that narrower quantiles generally result in reduced model performance.
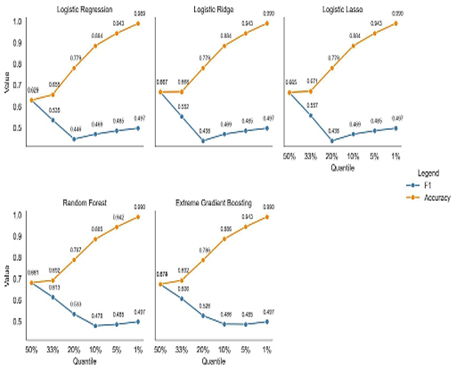
Source: Authors’ own formulation based on OCAI (2023) and MINEDU (2018).
Figure 3 Quantiles versus accuracy and F1 for trained models
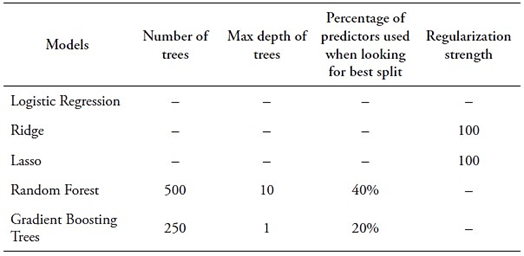
In the trade-off between narrowing the quantile range and model performance, the study found that the 33 percent quantile (tertile) is the optimal binary threshold for the Random Forest model. This choice is based on the Random Forest’s more gradual performance decline beyond the 33 percent quantile compared with other models. At the 33 percent quantile, Random Forest models achieve an F1 score of 0.613, higher than other models, particularly linear models. The study hence proceeds with its analysis using the lower tertile as the binary threshold.
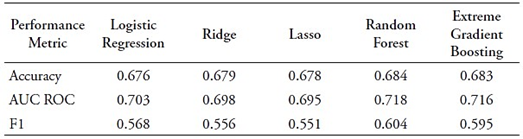
Table 4 Classification models’ results when considering the lowest tertile as a threshold
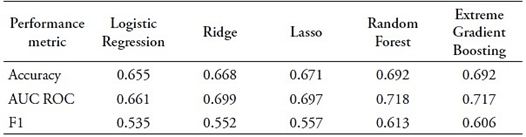
Source: Authors’ own formulation based on OCAI (2023) and MINEDU (2018).
Table 4 presents results for classification models using the lowest tertile as a threshold. As discussed in Chapter 4, model performance is assessed using three metrics: Accuracy, Area Under the Curve ROC (AUC ROC), and F1. Notably, Random Forest and Extreme Gradient Boosting achieve the highest Accuracy at 0.692. In terms of AUC ROC, Random Forest leads with a substantial value of 0.718, followed closely by Extreme Gradient Boosting at 0.717. For F1, Random Forest excels with a score of 0.613, making it the top-performing model. The second-best is the Extreme Gradient Boosting model with an F1 score of 0.606. Given the slightly higher F1 score, the study selected the Random Forest model as the optimal choice, despite both models demonstrating comparable performance.
The study also evaluates the importance of predictors according to the Gini impurity-based features importance criterion. Figure 4 shows the top ten input features. These predictors mainly refer to two dimensions: school grades and university admission results. School-related information includes general average grades, average grades for mathematics and communications courses, and average scores for second graders from the same school in the reading comprehension test of the ECE 2016 and 2018. Information from the university admission process includes general order of merit, and scores in the admission writing, reading tests, as well as the final score in the admission academic test. Data sources for the top ten predictors are BAR and ECE.
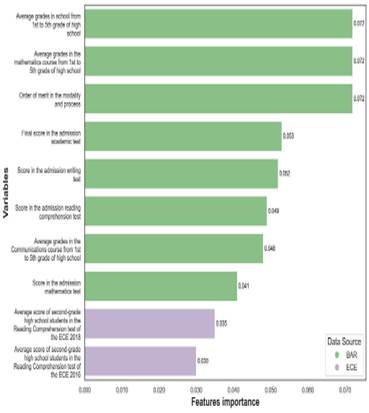
Source: Authors’ own formulation based on OCAI (2023) and MINEDU (2018).
Figure 4 Top ten predictors according to Gini impurity-based features importance criteria for the Random Forest model
7. Policy applications
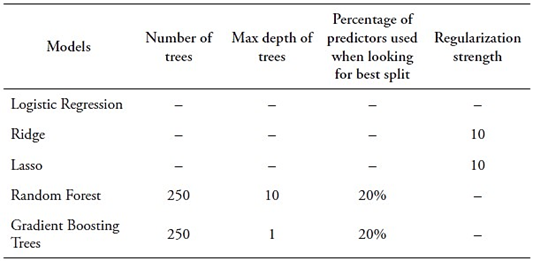
This section shows that ML models can be used as tools for predicting the likelihood of students belonging to PUCP’s lowest academic performance tertile. To achieve this, it constructs classification models by utilizing the top ten predictors determined through the Gini impurity-based features importance criterion. It limits the input features to ten for practicality. Performance metrics in Table 5 indicate that Random Forest is the best-performing model, as anticipated. Notably, reducing the predictors to ten has not substantially impacted classification capability. A comparison with Table 4 reveals a slight decrease in F1 (from 0.613 to 0.604), a modest reduction in accuracy (from 0.692 to 0.684), and unchanged AUC ROC (0.718). Given the reduction from 132 to 10 input features, this minor performance decline is reasonable.
Table 5 Classification models results for top ten predictors
Source: Authors’ own formulation based on OCAI (2023) and MINEDU (2018).
To enhance transparency, the authors aimed to demystify the optimal model (Random Forest trained with the top ten features). To achieve this, the study employed SHAP (SHapely Additive exPlanations) values for in-depth analysis of each predictor’s impact on the model’s output. SHAP values blend additive feature attribution methods with the Shapley framework from game theory. Additive feature attribution methods dissect the model’s outcome into the individual contributions of each feature, adhering to principles of local accuracy, missingness, and consistency (Lundberg et al., 2018). Meanwhile, the Shapley framework, rooted in cooperative game theory, ensures fairness by examining all possible player combinations (Michalak et al., 2013). In the context of binary classification, SHAP values reveal the direct contribution of input features to the outcome for each prediction category.
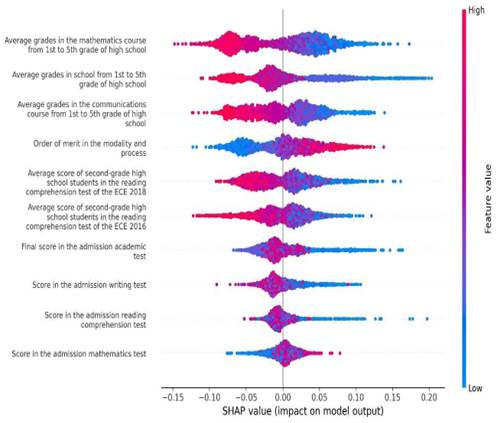
Source: Authors’ own formulation based on OCAI (2023) and MINEDU (2018).
Figure 5 SHAP values for Random Forest model trained with top ten variables.
Figure 3 presents SHAP (SHapley Additive exPlanations) values for the Random Forest model trained with ten first predictors. In the figure, colors correspond to predictor values, with redder tones indicating higher predictor values and bluer tones indicating the opposite. The horizontal axis represents the SHAP values. Larger positive SHAP values for a predictor indicate a greater positive contribution to the output, while larger negative SHAP values signify the opposite.
According to SHAP values, input features fall into two categories. The first category includes features where higher values positively predict belonging to the lowest tertile. Notably, this group comprises variables like the order of merit in the admission process and scores in the admission mathematics test. Thus, students admitted at the bottom of the merit order, and those with higher math test scores are more likely to be classified in the lowest tertile by the Random Forest model.
The second category encompasses features where higher values negatively predict classification within the lowest tertile. These factors relate to high school academic performance, including overall grade point averages, math and communication course grades, and average scores of second-grade students from the same school on reading comprehension tests conducted in 2016 and 2018. Additionally, final admission scores and math and communication test scores are included. Consequently, students from schools with enhanced reading comprehension scores, those with strong high school academic performance, and those with high university admission scores tend to be classified outside the lowest tertile by the Random Forest model.
Conclusion
The expansion of higher education access in low- and middle-income countries coexists with disparities in institutional quality and low graduation rates, especially for low-income students. This study utilizes machine learning models to predict the academic outcomes of undergraduate students at PUCP. The main objectives of this research were: (I) to identify the most effective ML algorithm for predicting undergraduate students’ academic performance, and (II) to determine the key predictors that influence this performance.
In addressing its first objective, the study discovered that ensemble tree-based models, specifically Random Forest and Extreme Gradient Boosting, are highly effective in predicting undergraduate academic performance. Among these, the Random Forest model slightly outperforms the Extreme Gradient Boosting model. The study also found that a Random Forest model, when trained with the top ten features identified through Gini impurity criteria, accurately predicts students’ academic outcomes. This model can serve as an effective preventative tool to mitigate student attrition. However, it is important to underscore the need for transparency, explicability, and accountability when applying machine learning tools. This study, employed SHAP values to explain the decision-making process of the model, detailing how each input feature contributes to the predicted outcome.
In pursuing the second objective, the study found that variables related to prior academic achievement and admission criteria are crucial predictors of student performance, as pointed out by previous research. The analysis utilized SHAP values and indicated that students with stronger results in these areas are less likely to be classified into the lowest tertile of academic performance. Currently, the burden of admission criteria in many Peruvian universities lies only in the results of an entrance test. Yet the study findings suggest that to predict potential academic performance, authorities can consider prior academic performance more accurately in the form of both average school grades and ECE average scores. Moreover, a composite index of the two variables mentioned can be developed to inform admission decisions.
This study has three main limitations. First, it does not consider variables referring to students’ motivation or teaching pedagogy. Although difficult to measure, these variables can arguably serve as relevant predictors of students’ performance. Second, the model was trained using data from 2018 to 2020, during the pandemic. Future iterations should incorporate post-COVID-19 data to avoid the problem of “concept drift”. Third, while providing insights into student attrition, it does not offer program-specific recommendations.