


 Inglés (pdf)
 Articulo en XML
 Referencias del artículo
 Enviar articulo por email
 Citado por SciELO
  Similares en
SciELO
Similares en
SciELO 
 Permalink
The students’ approaches to learning theory brings a solid theoretical and practical contribution to educational psychology. This theory shows that different strategies and motivations of learning converge to two broad approaches to learning: deep and surface (Fontes & Duarte, 2019). These two approaches to learning bring important conceptual insights about how people learn and acquire knowledge. Considering the practical contribution, the theory has influenced the diagnosis and a large Scopus of interventions aiming to improve the students’ learning (Gomes et al., 2020).
There are two meta-analyses about the correlations between the deep and surface approaches and the students’ achievement. The first one (Watkins, 2001) shows that the deep approach has a positive correlation with academic achievement (.16) while the surface approach has a negative correlation with this outcome (-.11). This study found that these correlations were similar in school and university. The second meta-analysis (Richardson et al., 2012) found very similar evidence, showing a correlation of .14 and -.18 between deep and surface approach and academic achievement, respectively.
Despites of these evidence bringing important information, none of these studies as well as any other study, to our knowledge, has inquired into the incremental validity of the students’ approaches to learning to predict academic achievement, taking intelligence as control. One exception is the study of Gomes and Golino (2012b). Through a sample of approximately 700 middle and high school students of a private school of Belo Horizonte, Minas Gerais, Brazil, they found that a general factor of academic achievement variance was explained in 25.40% both by a general factor of students’ approaches to learning and by fluid intelligence. The general factor of students’ approaches to learning explained, alone, 8.65% of the general factor of academic achievement variance. Gomes and Golino’s study shows that the students’ approaches to learning present incremental validity, even with the control of the fluid intelligence in the predictive model. This evidence is important because it shows that the students’ learning approaches are relevant predictors, even in the case of their correlation with the outcome not being a high one. However, the evidence of the Gomes and Golinos’ was produced through a narrow sample. Besides, they used school grades as observable variables in order to measure the general academic achievement although the tendency of school grades to generate noise on the measurement.
In our study, we apply the same instruments used in Gomes and Golino (2012b). However, we also systematically improve the robustness of the evidence by using a broad and varied sample of high school students from different private and public schools in two cities. We increased the number of predictors by adding the surface and deep approach, the broad cognitive ability of fluid intelligence and its specific cognitive abilities, that is, inductive reasoning, logic reasoning, and solving-problem ability. Gomes and Golino’s study did not measure the surface and deep approach but only a general factor of students’ approaches to learning. Besides, they measured the fluid intelligence, but they did not include any specific cognitive ability that are part of fluid intelligence specific cognitive processes. So, in our study we can investigate the predictive role of the following variables: (1) surface approach - extrinsic motivations and superficial strategies to learning, as memorization without meaning; (2) deep approach - intrinsic motivations and profound strategies to learning, as memorization with meaning; (3) fluid intelligence - ability to learn new things involving abstraction; (4) inductive reasoning - ability to discover logical patterns; (5) general reasoning - problem-solving ability; (6) logical reasoning - ability to make logical conclusions from premises.
The objective of our study is to innovate in terms of methodological analyzes, applying multiple linear regression and the CART algorithm of the regression tree method, created by Breiman et al. (1984). We use the CART algorithm because it is the most used in the regression tree method, which has many advantages in comparison to the techniques of the linear general model (i.e. structural equation modeling, multiple linear regression, multilevel regression). We describe some advantages of the regression tree method in the data analysis section, but the interested reader can find details about them in many papers (Gomes & Almeida, 2017; Gomes, et al., 2020; Gomes et al., 2020; Gomes & Jelihovschi, 2019; Gomes et al., 2020).
Finally, we did not use school grades to measure a general factor of academic achievement, since the school grades from different schools do not indicate the same students’ performance, resulting in large measurement noise. So, we opt to extract a general factor of academic achievement through items with different levels of difficulty from different editions of the National Upper Secondary Education Examination [Exame Nacional do Ensino Médio (ENEM)]. ENEM is the large-scale educational test of Brazil that measures the knowledge acquisition of the Brazilian students who finish secondary education. Using items from different editions of the ENEM brings more quality for the measurement and, consequently, more robust evidence.
Method
Participants
The sample has 792 high school students (51.25% female and 55.55% enrolled in private schools) from five schools from Belo Horizonte and Viçosa, Minas Gerais, Brazil. Their age ranged between 14 and 21 years-old (M = 16.3, SD = 1.00) and they were distributed homogeneously in high school grades (35.60% in first-year, 29.04% second-year and 34.36% third-year).
Instruments
Students’ Approaches to Learning Scale [Escala de Abordagem de Aprendizagem (EABAP)]: EABAP was created by C. M. A. Gomes in the 2000s when studying the students’ beliefs about teaching and learning (Gomes & Borges, 2008a). EABAP measures the deep (9 items) and surface approaches (8 items). Each item has one assertion representing a behavior related to the surface or deep approach. The respondent answers each item through a scale of five points that represents the frequency which the behavior is present in his life. EABAP is a well-established test and has much evidence of internal and external validity (Gomes, 2010c, 2011a, 2013; Gomes et al., 2020; Gomes & Golino, 2012b; Gomes et al., 2011). Besides, EABAP has influenced the construction of many other tests (Gomes, 2021a, 2021b; Gomes & Linhares, 2018; Gomes et al., 2021; Gomes & Nascimento, 2021j; Gomes & Rodrigues, 2021; Gomes et al., 2020).
Fluid Intelligence Tests Kit [Conjunto de Testes de Inteligência Fluida (CTIF)]: CTIF has three tests: Induction Test (I), Logical Reasoning Test (RL) and General Reasoning Test (RG) (Gomes & Borges, 2009a). They are part of the BAFACALO battery of intelligence, created by C. M. A. Gomes (Gomes, 2005; Gomes & Borges, 2007, 2008b). BAFACALO is a pioneer in the measurement of cognitive abilities of the Cattell-Horn-Carroll model in Brazil (Golino & Gomes, 2014). The battery has 18 tests and they are available for research and teaching in the researchgate platform (Gomes & Nascimento, 2021a, 2021b, 2021c, 2021d, 2021e, 2021f, 2021g, 2021h, 2021i, 2021k, 2021l, 2021m, 2021n, 2021o; Gomes, Nascimento, & Araujo, 2021a, 2021b, 2021c, 2021d). BAFACALO has much evidence about internal (Gomes, 2010b, 2011b, 2012; Gomes & Borges, 2009b, 2009c; Gomes et al., 2014; Gomes & Golino, 2015) and external validity (Alves et al., 2012; Gomes, 2010a; Gomes & Golino, 2012a, 2012b; Gomes et al., 2014). Just as EABAP, BAFACALO is a benchmark for the construction of other tests, as the Inductive Reasoning Development Test [Teste de Desenvolvimento do Raciocínio Indutivo (TDRI)] (Golino & Gomes, 2015, 2019; Golino et al., 2014).
CTIF measures the fluid intelligence ability as well as the specific abilities related to fluid intelligence, that is, logical reasoning, inductive reasoning, and solving-problem ability. The Induction Test (I) has 12 items. Each item has five groups with four letters. Each group has the same rule, excepting one group. The respondent must identify this group. In turn, the Logical Reasoning Test has 30 items composed of two premises and one conclusion. The respondent must identify if the conclusion of the item is logically correct. Lastly, the General Reasoning Test has 15 items composed of a mathematical problem and five answer options.
Academic Knowledge Exam [Exame de Conhecimento Acadêmico (ECA)]: ECA measures the academic knowledge of the students in high school. EAC was inspired by the assumption in Pires and Gomes (2017, 2018). ECA has 19 items selected from the editions between 2001 and 2007 of the National Upper Secondary Education Exam [Exame Nacional do Ensino Médio (ENEM)]. The 19 items were allocated in three booklets. The booklet 1 has the items 1 to 10, while the booklet 2 has the items 1, 2, 6, 8, 10, 11, 13, 14 and 15 and the booklet 3 contains the items 1, 5, 6, 10, 13, 15, 16, 17, 18 and 19. Each booklet has similar items in terms of difficulty.
Data Collection and Analysis
The data of this study comes from the project “Academic Performance Beyond Intelligence: Incremental Validity of Cognitive Variables”, which was approved by the Ethical Committee of the Universidade Federal de Minas Gerais, number 364.253. All ethical principles guide the data collection. It was performed in six schools in Belo Horizonte (three public and one private) and Viçosa (one private and one public). The tests were applied in school by students of psychology who were trained by one of the researchers.
The data analysis involved two steps. The first consisted of defining the measurement of each variable of the study while the second step applied the predictive models using the multiple linear regression and the regression tree method.
In the first step, we tested the factor structure of each instrument of the study through item confirmatory factor analysis via Weighted Least Squares Mean and Variance Adjusted (WLSMV). The factor structure was not rejected if CFI ≥ .90 and RMSEA < .10 (Lai, & Green, 2016). We then applied the Rasch model for every factor structure of each instrument which was not rejected. The Rasch measurement was not rejected for infit values between 0.5 and 1.7 (Bond & Fox, 2020). The item confirmatory analyses were performed through the lavaan R package, version 0.6-8 (Rosseel et al., 2020), while the Rasch measurements were performed via the mirt R package, version 1.33.2 (Chalmers, 2012).
For models with more than one latent variable, the reliability of the Rasch factor scores was evaluated by comparing the correlation of the latent variables of the model with the correlation of the same latent variables of the Rasch factor scores. This approach, according to our present knowledge, is an original strategy created in this study. After running dozens of analyzes in different datasets we observed that both mirt and lavaan were producing very biased factor scores. The correlations among their factor scores were largely different from the correlations between the latent variables of the models, indicating that these factor scores were very ineffective and showed low reliability. These results were very surprising to us. Therefore, we created a criterion, indicating that a difference equal or lower than .05 between the factor scores correlations and the latent variables correlations is an adequate reliability. Values higher than .10 indicate an unacceptable reliability. When a model has only one latent variable, we adopted a traditional reliability criterion, that is, we used the marginal reliability, taking as cutoff point the value of .60. We used the ten Berge factor score calculated in the psych R package (Logan et al., 2021; Revelle, 2020), since it was very effective and has produced reliable factor scores in models with two or more latent variables. For unidimensional models we used the expected a-posterior factor score method of mirt.
When evaluating the EABAP factor structure, we tested a model which assumed that there is a surface explaining 8 items and a deep approach explaining the other 9 items of the test. Both approaches were permitted to correlate. For CTIF, we tested a bifactor model. The general factor was the fluid intelligence while the specific factors were the logical reasoning ability, inductive reasoning, and solving-problem reasoning. These three specific factors only load on their target items while the fluid intelligence loads all items of CTIF. Regarding ECA, the unidimensional model was tested for each booklet while the Rasch measurement included the 19 items.
The outcome of the predictive model was the Rasch factor scores of ECA and the predictors were the Rasch factor scores of surface and deep approaches, fluid intelligence, inductive reasoning, logical reasoning, and solving-problem reasoning. This model was tested through the multiple linear regression and the CART algorithm. The main assumptions of the multiple linear regression were tested through the normality of the residuals (Shapiro-Wilk test, kurtosis, and skewness), the multicollinearity of the predictors (VIF) and the homoscedasticity of the model (Breush-Pagan test). The stepwise technique was applied to select the predictors. For running the multiple linear regression, we applied the following R packages: car, version 3.0 (Fox, & Weisberg, 2019), lmtest, version 0.9 (Zeileis & Hothorn, 2002), and olsrr, version 0.5.3 (Hebbali, 2020).
The regression tree method as well as the CART algorithm are a data-driven approach which without assumptions about the properties of the data, which is appropriate to analyze non-linear relationships, data with non-normal distribution, data which are not i.i.d. and data with many categories which are nominal variables (Gomes & Almeida, 2017; Gomes et al., 2020; Gomes & Jelihovschi, 2019; Gomes et al., 2020). The CART algorithm breaks the data until it achieves a certain criterion to stop the breaks. The final parts of the data are named as leaves. The leaves provide the information about how the predictors are connected to the outcome, providing explicative and substantive evidence. The CART and many other techniques of regression tree method produce a tree that must be pruned, eliminating certain leaves that are mere noise and do not contribute to the prediction. The benchmark criterion to prune the tree is the cost complexity, provided through the K-fold cross-validation. This criterion selects the point of the tree to be pruned by identifying where is the point at which there is the lowest error of prediction. Although this criterion is the main one for pruning trees, very recently Gomes et al. (2021) show initial evidence leading to the conclusion that this criterion is ineffective. So, we pruned our tree through another criterion, that is, the interpretability criterion which selects arbitrarily a number of limited leaves that permit the researcher to read and interpret the leaves. Details of the rationality of the CART algorithm are found mainly in Breiman et al. (1984). The analysis of the CART algorithm was performed through the R package rpart, version 4.1-15 (Therneau & Atkinson, 2019). All analyzes used the R statistical software, version 4.0.3 (R Core Team, 2020).
Results and Discussion
All factor structure models show values in CFI and RMSEA indicating that they could not be rejected. The EABAP’s factor structure had an acceptable goodness-of-fit (χ² [118] = 622.22; CFI = .956; RMSEA = .073 [.068-.079]). The EABAP’s Rasch measurement had an adequate infit between 0.76 and 1.05 (M = 0.90, DP = 0.07). The CTIF’s factor structure had an acceptable goodness-of-fit (χ² [1501] = 3329.947; CFI = .930; RMSEA = .039 [.037-.041]) and its Rasch measurement had an adequate infit between 0.77 and 1.13 (M = 0.93, DP =0.08). The ECA’s factor structure were acceptable for all the booklets (Booklet 1: χ² [35] = 44.85, CFI = .913, RMSEA = .025 [.000-.045]; Booklet 2: χ² [35] = 42.35, CFI = .898, RMSEA = .049 [.000-.095]; Booklet 3: χ² [35] = 22.83, CFI = 1.000, RMSEA = .000 [.000-.008]). The booklet 2 had a very small difference below the cutoff point in CFI (0.002) but this booklet was the only one which had a low number of students (N = 89) while the booklets 1 and 3 had a N = 442 and N = 261, respectively. The small sample of the booklet 2 may be compromised the CFI in this booklet. The Rasch measurement involving the 19 items of ECA had an adequate infit between 0.79 and 1.04 (M = 0.90, DP = 0.08).
The correlations of the Rasch factor scores and the correlations of the latent variables of the Rasch models had a very small difference (Δr < .001) indicating an adequate factor score reliability. The unidimensional ECA’s Rasch factor score showed an acceptable reliability presenting a marginal reliability of .76.
Table 1 summarizes the descriptive statistics of the Rasch factor scores of the variables and their correlations. Table 1 shows that the Rasch factor scores of all variables are normally distributed. The logical reasoning did not show statistical significance in the correlations with any variable. The correlations of the predictors with academic achievement, and the confidence interval of these correlations, show that the correlations of the reasoning abilities as well as fluid intelligence with academic achievement are equal to the correlations of the surface and deep approaches with this outcome. The multiple regression and CART regression tree method will better clarify this aspect. Considering the confidence interval of the correlations of the predictors with the outcome, we can only conclude that the inductive reasoning has a lower correlation than the fluid intelligence and solving-problem reasoning.
The stepwise multiple linear regression shows that the predictors that really matter to predict the outcome are fluid intelligence (R² = 9.89%), solving-problem reasoning (R² = 7.32%), surface approach (R² = 1.99%) and inductive reasoning (R² = 1.17%), explaining 20.37% of the outcome variance. The residuals of the model had a normal distribution (Shapiro-Wilk, W = .996, p = .055; kurtosis = -.18, skewness = -.22). The VIF varied between 1.00 and 1.04, indicating that the model was not affected by multicollinearity. The data show homoscedasticity (Breush-Pagan, BP = 8.95, df = 4, p = .062).
Table 1 Descriptive Statistics and Correlations of the Rasch Factor Scores
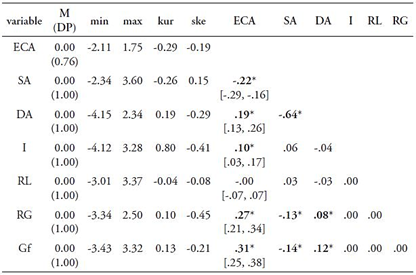
Note. M = mean; SD = standard deviation; min = minimum; max = maximum; kur = kurtosis; ske = skewness; ECA = academic achievement; SA = surface approach; DA = deep approach; Gf = fluid intelligence; RG = solving-problem reasoning; I = inductive reasoning; RL = logical reasoning; * indicates p < .02. Brackets indicate a confidence interval of 95%.
The intercept value was .00 [CI 95% = -.05, .05]. The value .00 represents the average performance because the Rasch factor scores have mean 0 and standard deviation 1 in its distribution. So, an intercept of value 0 shows that if the students present an average performance on the predictors, then they will have an average performance on academic achievement. The slope of the fluid intelligence was .22 standard-deviation [CI 95% = .18, .27; p < .001], showing that if the students have a fluid intelligence performance of 1 standard-deviation above the mean, so the academic achievement of these students will have an increment of .22 standard-deviation. The slope of the solving-problem reasoning was .19 [CI 95% = .14, .24; p < .001], indicating that if the students achieve a performance of 1 standard-deviation above the mean in this predictor, then they will increase .19 standard-deviation in its academic achievement. The slope of the inductive reasoning was .09 [CI 95% = .04, .13; p < .001], implying a lower increment in the academic achievement when we compare fluid intelligence and solving-problem reasoning. The surface approach was -.12 [CI 95% = -.17, -.07; p < .001]. This is the only predictor which has a negative association with academic achievement, indicating that when the students have an increment of 1 standard-deviation in surface approach, they will have a decrease of .12 standard-deviation in academic achievement.
The CART algorithm generated a non-pruned tree with 69 leaves. The pruned tree had 27 leaves and explained 35.20% of the outcome variance. Because the regression tree method is not a mainstream method in human science, we will show how to read the pruned tree of our study. Didactical explanations can be found in many studies (Gomes & Almeida, 2017; Gomes et al., 2020; Gomes & Jelihovschi, 2019; Gomes et al., 2020).
The substantial results of a tree present themselves in its leaves since they show the path where the data were broken by the CART algorithm. Besides, the leaves represent different groups of persons and their respective predictions. Finally, the leaves indicate the relationships between the predictors and the outcome.
Looking at Figure 1, we can see that each ellipse represents a leaf of the tree. Inside of each ellipse there are two values. The top value shows the predictive value of the outcome for that group of persons while the second value indicates the percentage of the participants in relation to the sample which are part of that leaf. In the right corner of Figure 1, there is one leaf with the numbers 1.2 and 2%. They show that the persons of this leaf have an academic achievement 1.2 standard-deviation above the average performance. They are 2% of the sample.
We can extract substantive information from each leaf being guided by the following steps:
(1) First, begin reading the tree in a top-down screening.
(2) Observing the rectangle of number 1 at the top of Figure 1 we can see that it represents the data do not broken yet.
(3) In the leaf of our example, we need to identify what is the path from the rectangle of number 1 to the leaf with 1.2 standard-deviation and 2%.
(4) In this path, the first break on the data was made by the CART algorithm when it selected the predictor solving-problem reasoning (RG) and it separates the persons through the cutoff value of -.39 standard-deviation in RG.
(5) Around this cutoff value there are the words “yes” and “no”. They show that the person with a lower performance than -.39 standard-deviation in RG are allocated in the leaves that are connected with the word “yes”, while the persons with a performance equal or above -.39 standard-deviation in RG are allocated in the leaves that are connected with the word “no”. The leaf of our example is connected with the line of the word “no”. It is important to know that in all breaks of the data, the line which goes on to the left corresponds to the word “yes”. This word is shown only in the first split of the data and it is omitted in the subsequent splits.
(6) To get our leaf, we need to continue the screening. We can see that the persons with performance equal or superior to -.39 in RG are separated through the cutoff point of .081 standard-deviation in fluid intelligence (Gf). People with a lower performance are allocated in the left while people with performance equal or superior are allocated in the right, which is the case of our leaf.
(7) Finally, people with RG equal or superior to -.39 and Gf equal or superior to .081 are separated through the cutoff value of 2.00 standard-deviation in Gf.
(8) The leaf of our example is the product of these data splits. Concluding, the participants of this leaf have RG >= -.39 and Gf >= 2 and are the students with the highest academic achievement (ECA = 1.2 standard-deviation). It is important to know that this leaf has the number 15 inside a rectangle in the superior part of the ellipse. This number helps us to communicate about the leaves in the tree. For example, even when we say something about the leaf 15, we are referring to the leaf of our example. But it is relevant to know that this number does not necessarily represent the number of leaves obtained by the tree. For example, the leaves number 454 and 455 of Figure 1 do not indicate that the CART algorithm has produced this large number of leaves. As we said, the non-pruned tree has only 69 leaves.
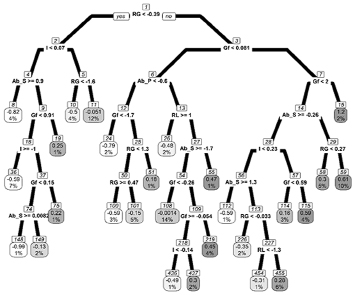
Note. RG = solving-problem reasoning. Gf= fluid intelligence. RL = logical reasoning. Ab_P = deep approach. Ab_S = surface approach.
Figure 1 Pruned Tree
The output of the three permits that many aspects are shown. However, we will focus on the substantive question of our study, that is, the incremental validity of the students’ approaches taking fluid intelligence and the reasoning abilities as control. It is worth to mention that of the 27 leaves of the pruned tree, the surface approach has participated of the prediction of 17 leaves (leaves with numbers 8, 36, 148, 149, 75, 19, 108, 436, 437, 219, 55, 112, 226, 454, 455, 114, 115, 58, 59). This means that the surface approach has incremental validity to predict the outcome of 17 groups of students which are represented by these 17 leaves. On the other hand, the deep approach has incremental validity in 10 groups of students, participating in the outcome prediction in 10 leaves (leaves with numbers 24, 100, 101, 51, 26, 108, 436, 437, 219, 55).
Some leaves represent the importance of the approaches to learning. The leaf 8 shows that the persons with a performance around average or worse in solving-problem reasoning (RG < -.39) and inductive reasoning (I < .07) and have strong surface approach (Ab_S ≥ .90) are just the students with an academic achievement of -.82 standard-deviation, which are among the worst achievements. This leaf shows that a high surface approach, conditioned by a performance around average or worse in solving-problems and induction is related to a low academic achievement.
In turn, leaf 24 shows that a low deep approach (Ab_P < -.6), conditioned by a RG ≥ -.39 and Gf < -1,7, predicts one of the worst academic achievements. This leaf represents the students with -.79 standard-deviation in the outcome. It is worth mentioning that both a high presence of surface approach or a low presence of deep approach predict certain groups between the worst achievements.
The leaf 55 is relevant because it has as predictors both the surface and deep approaches. The students of this leaf have RG ≥ -.39, Gf< .081, Ab_P ≥ -.6, RL < 1.0 and Ab_S < -1.7. This leaf shows that having a very low surface approach improves academic achievement. Observe that the leaf 8 shows that a high surface approach impairs the students’ achievement. Together, the leaves 8 and 55 show that the surface approach affects both the decrease and the increment of academic performance.
In spite of not being the focus of our work, it is worth mentioning a nonlinear relationship between solving-problem reasoning and academic achievement. This nonlinear relation is identified when you compare the leaves 100 and 101 to the leaves 58 and 59. When observing the leaves 58 and 59, we can see that if there is lower solving-problem reasoning (RG < .27) then there is a lower academic achievement, indicating that there is a positive association between the predictor and the outcome. However, when observing the leaves 100 and 101, we can see the opposite, since if there is a higher solving-problem reasoning (RG ≥ .47) then there is a lower academic achievement. This non-linear relationship is interesting and could not be discovered by the techniques of the general linear models, unless it was previously defined in the predictive model.
By inspecting the pruned tree, we can understand the conditions under which the predictor has a positive and a negative association with the outcome. The leaves 58 and 59, which indicate a positive association between RG and academic achievement, represent the students with RG ≥ -.39, Gf ≥ 0.081 and < 2.0, and Ab_S < -.26. In this case, the students with RG between the performance of -.39 and .269 have an academic achievement of .30 standard deviation, while the students with RG > .269 have an academic achievement of .61 standard deviation. Note that the conditionals to a positive association between the solving-problem reasoning and academic achievement are the fluid intelligence and surface approach, both positively associated with academic achievement. In turn, the negative association that is present in the leaves 100 and 101 represented by the students with RG ≥ -.39 and < 1.3, Gf < .081 but not < -1.7, and Ab_P < -.6. In this case, the students with RG between the values .47 and 1.29 have a worse academic achievement than the students with RG between -.39 and .47.
Those conditionals bring interesting questions. First, there is a negative association between solving-problem reasoning and academic achievement, but only in the range of -0.39 and 1.29 standard-deviations of that predictor. Second, this negative association is conditioned by the fluid intelligence and deep approach, both positively associated with academic achievement. This result is favorable to the role of deep approach because it suggests that higher levels of solving-problem reasoning are harmful if the students report low levels of deep approach. We could observe that the students’ approaches are conditioned by the cognitive abilities of reasoning and fluid intelligence. However, our result shows that the students’ approaches regulate the predictive role of the cognitive abilities. We could see that low levels of deep approach may alter the direction of the association between the solving-problem reasoning and academic achievement.
Finally, we have to highlight that the most important predictors are those that are part of the first data splits. In this sense, the solving-problem reasoning (RG) is the most important predictor, followed by the fluid intelligence (Gf) and inductive reasoning (I). So, we can state that, at least for ENEM, solving-problem reasoning seems to be a central ability for the students’ performance. Besides, the students have a good performance in ENEM’s items when they show good ability to learn new things that require abstraction, that is, fluid intelligence, as well they show good ability to discover logical patterns, what is the inductive reasoning. This result is favorable to ENEM, since this large-scale assessment was created by the Brazilian government as a strategic initiative to promote an education focused on reasoning rather than a memorization based on learning by heart (Golino et al., 2021; Gomes et al., 2020; Gomes et al., 2016). In previous studies, Gomes (2005, 2010a) and Gomes and Borges (2009a) found that the ENEM showed more intense relationships with fluid intelligence and its specific abilities of reasoning. The students’ approaches to learning have a secondary role in comparison to the mentioned cognitive abilities. However, the surface and deep approach show incremental validity. Surface approach has incremental validity both in the multiple linear regression and in CART pruned tree. Deep approach presents incremental validity only in the CART analysis. The CART analysis indicates that there are substantive dynamic interactions among the students’ approaches and the cognitive abilities for the prediction of academic achievement.
In this study, we tested an important issue, to find out whether or not the students’ approaches to learning have incremental validity by adding in the same predictive model, abilities of intelligence. We provided a heterogeneous sample from many schools and inserted in the predictive model both the fluid intelligence and three specific abilities of reasoning, besides the surface and deep approaches. Furthermore, we were careful to measure the students’ academic achievement. We constructed an academic exam selecting items from different editions of the large-scale assessment of Brazil which evaluates the students who are performing or finished secondary education. Finally, we applied the multiple linear regression, a traditional method to analyze the predictive model, but innovated by adding a method that is not part of the mainstream techniques nonetheless very effective to discover nonlinear and dynamical interactions among the variables.
Comparing the evidence from the two methods applied in our study, we can conclude that the CART algorithm is more effective than the linear regression in predicting the outcome and providing substantive information, although both methods produced relevant information. While linear regression explained 20.37%, the CART algorithm explained 35.20% of the outcome variance. The linear regression indicated that only solving-problem reasoning, fluid intelligence, inductive reasoning and surface approach are predictors of academic achievement, while the CART algorithm included the logical reasoning and deep approach, that is all six variables used in the model, as predictors of the outcome. Continuing, the linear regression showed that the increment of one standard-deviation in the four predictors generate a small increment in academic achievement, since the highest increment is .22 standard-deviation in students’ achievement when there is an increment of one standard-deviation in solving-problem reasoning. On the other hand, the CART algorithm was able to produce expressive evidence about the relationships between the predictors and the outcome. We also highlight that the CART algorithm was able to find relevant nonlinear relationships between a predictor and the outcome. Furthermore, this algorithm showed relevant conditionals under which certain variables can be predictors of the outcome, presenting the existence of dynamical interactions among the students’ approaches to learning and the cognitive abilities. Through the results of the CART algorithm, we could find more substantial information that sustains more robust evidence concerning the incremental validity of the students’ approaches to learning.
Therefore, we can say that the students’ approaches to learning show incremental validity and both the surface and deep approaches are important for the prediction of academic achievement. Apparently, they are not as important as certain cognitive abilities, in terms of magnitude, but it does not weaken their relevance. Besides, there is a dynamic among the students’ approaches to learning and the cognitive abilities of fluid intelligence and reasoning implying that all these variables are connected and explain together the achievement of the students.

