


 Inglés (pdf)
 Articulo en XML
 Referencias del artículo
 Enviar articulo por email
 Citado por SciELO
  Similares en
SciELO
Similares en
SciELO 
 Permalink
INTRODUCTION
The university was forced, in a reactive, hasty, and improvised manner, to adopt the virtual modality to exercise its teaching function, due to the situation produced by the present COVID-19 pandemic.
To strengthen our educational offer in a proactive sense, we considered it necessary to have a theoretical-behavioral model that would allow us to strengthen the behavior of virtual classroom use by identifying the determinants of its use. Based on these determinants, we could design actions to encourage the use of the virtual classroom, as well as the satisfaction with this use.
Furthermore, there is not a single validation study of the Technology Acceptance Model (TAM) in the Dominican Republic, which makes it necessary to adapt this model to our cultural particularities, to be able to use it as a predictor of the acceptance of the virtual classroom.
2. THEORETICAL FRAMEWORK: TECHNOLOGY ACCEPTANCE MODEL
The TAM has been very widely used to predict technology acceptance and its use based on the factors Perceived Ease of Use and Perceived Usefulness (Venkatesh & Davis, 2000; Moeser, et al., 2013). According to these authors, the TAM2 version (Venkatesh 2000; Venkatesh & Morris, 2000) can explain 60% of the variance of user acceptance of use. According to Park (2009) the TAM can account for 40 to 50% of the variance of user acceptance of the technology. Many other authors have reported that the TAM model is useful in explaining and predicting IT usage behavior (Gangwar et al., 2015; Legris et al., 2003; Mahon et al., 2006; Sarıtaş et al., 2015; Shih, 2004; Turel et al., 2007; Wu & Yen, 2014; Ye & Potter, 2011).
In his doctoral dissertation, Davis (1986) first proposed the TAM to empirically test new computer systems by the user. To arrive at the Actual Use of one of these systems we must first have a Behavioral Intention (BI), which is influenced by Attitudes (A) or the general impression about the technology. Attitudes are one of the main determinants of behavioral intention and refer to the way people feel about a certain behavior. Two factors act on attitudes: the strength of behavioral beliefs regarding the likely outcomes of the behavior, as well as the evaluation of those outcomes, which can be positive or negative. The original theoretical model is schematized in Figure 1.
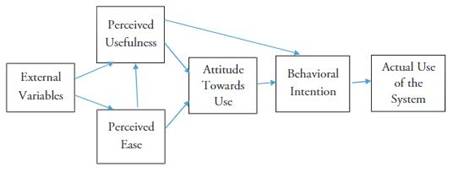
Perceived Usefulness (PU) was originally defined by Davis as the degree to which a person believes that using a system would improve his or her job performance. Perceived Ease (PE) would be the degree to which a person believes that using a given system would lighten his or her effort.
Behavioral Intention (BI) would be a function of both attitudes and subjective norms toward the behavior, one of the external variables in the TAM. The more positive the attitudes and subjective norms, the stronger the Attitude-Behavior relationship.
The TAM is an adaptation of the Theory of Reasoned Action (TRA). Fishbein (2008) recalls that he first proposed the TRA in 1967 and that it was an effort to overcome traditional attitude theories, which were unable to predict specific behaviors.
TRA starts from the simple premise that the best way to predict a given behavior was to ask the persons whether they were going to perform it. According to this theory, the performance of a behavior would be determined by the degree to which a person does or does not intend to perform it. In other words, intention would be defined by the subjective probability that one will perform that behavior. This would be Fishbein’s original notion of the relationship between attitude and behavior (Relationship A - B).
Early on, it was proposed to extend TRA to include other factors such as habits, facilitating conditions and affective factors. Habits would be the actions performed routinely, facilitating conditions are those that make completing an action less difficult. The affective are the emotional responses of a person towards a behavior and that affect his behavioral intention, although not directly the behavior.
The TRA was later extended (Ajzen & Fishbein, 1980) and eventually complemented by the Theory of Planned Behavior (TPB). The latter involves the incorporation of the predictor Perceived Behavioral Control. This predictor was introduced to account for occasions when a person intends to perform a behavior, but the actual behavior is prevented for subjective or objective reasons (Nisson & Earl, 2020).
Recent contributions on TRA and TPB incorporate motivations, explain their differences, and distinguish them from self-efficacy and locus of control (Fitzmaurice, 2005; Ajzen, 2011; Ajzen, 2020).
After clarifying the origins of the TAM in TRA, we can describe the elements that have been added to the original TAM. Venkatesh and Bala (2008) developed a TAM3 which focuses on the determinants of Perceived Usefulness and Perceived Ease, identifying within these determinants subjective norm, image, relevance to work, quality of deliverables, demonstrability of results, perceived external control, computational anxiety, curiosity, perceived pleasure, and objective usability (Sargolzaei, 2017). The TAM3 has been validated for cloud computing (Nikolopoulos & Likothanassis, 2018), in organizational contexts (Cengiz & Bakirtas, 2020), as well as with the inclusion of the factors Change Fatigue and Overload (Jeffrey, 2015).
Although Grandón et al. (2021) said that much of the TAM research has been done in organizational contexts, Granić and Marangunić (2019) found 71 significant studies done between 2003 and 2018 in an educational context. In their review of these articles these authors claim that perceive ease of use and perceived usefulness, TAM’s core variables, have been proven to be predictors of the acceptance of learning with technology. They conclude that future research will focus on identifying other external factors to further explain acceptance and usage of diverse learning technologies.
Effectively, from 2018 to the present day we have found different studies that use the basic TAM model to research on external factors influencing the behavior intention to use many different new technologies to learn. Al-Emran et al. (2018) review 87 articles from 2006 to 2018 related to Mobile learning (M-learning). They confirmed that many of the studies extended the TAM with external variables and other extended the model with factors from other theoretical models. Salloun et al. (2019) also reviewed 120 articles about TAM from the previous twelve years finding that the most common external factors were computer self-efficacy, subjective/social norm, perceived enjoyment, system quality, information quality, content quality, accessibility, and computer playfulness.
For example, Esteban-Millat et al. (2018) extended the TAM with the Flow (optimal psychological state), an aspect of individual intrinsic motivation, while Guest et al. (2018) called attention to point technology as Augmented Reality and Wearable Technologies proposing that the metrics to use these new technologies should be fine-tuned.
The E-Service Technology Acceptance Model (ETAM) was used successfully (Taherdoost, 2018) to assess the user acceptance of e-service technology: satisfaction, security, and quality. On the other hand, the findings of Weerasinghe and Hindagolla (2018) indicate that the TAM has been applied for explaining user adoption and acceptance of the Social Network Sites, from Facebook, to Slideshare, to ResearchGate and Google Scholar.
More recently, Baby and Kannammal (2020) enhanced the TAM with some user centric variables as perceived security, perceived privacy and perceived trust. Moura et al. (2020), including the variable anxiety, confirmed the relationship between TAM predictors and the intention of teachers to use ITC in the work environment. Pal and Vanijja (2020) compared the TAM, which they said is an Information System based approach, with the System Usability Scale (SUS), which they consider a Human Computer Interaction based approach, and found that the TAM’s Perceived ease of use construct was the one more similar to the SUS.
Using a model evolved from the TAM, Rafique et al. (2020) concluded that perceived usefulness and perceived ease of use were direct predictors of the intention to use mobile library applications. Al-Rahmi et al. (2021) combine TAM with the Information System Success Model and found that the behavior intention to use and the actual social media usage were a constructive and positive influence on satisfaction and academic performance among university students. Finally, investigating mobile users’ intention with TAM, Kusyanti et al. (2022) found that Privacy concern was also a determinant of behavioral intention to use technology.
Instead of using a model with all the external factors enhancements and all the new technologies probed, we pick up a very sound model used by Park (2009) which, in an educational context, divides the external variables of the original TAM into three. Virtual Self-Efficacy, classified as an individual factor; Subjective Norm, seen as a social factor; and System Accessibility, as an organizational factor.
The model tested by Park (2009) also includes the original elements of Perceived Usefulness, Perceived Ease, Attitudes and Behavioral Intention but does not include the Actual Use of the technology.
Several authors have found evidence on the effect of Perceived Usefulness and Perceived Ease. Selim (2003) and Bedregal-Alpaca et al. (2019) find these two factors to be good determinants of technology acceptance and use. However, Liu et al. (2005) consider perceived usefulness only as a mediating variable. Samperio and Barragán (2017) argue that perceived usefulness is associated with the benefits and advantages obtained with the use of the platform.
Among the variables added in Park’s (2009) model is Virtual Self-Efficacy. Venkatesh and Davis (1996) concluded that this acts as a determinant of perceived ease both before and after actual use, but that objective usefulness was only a determinant of perceived ease after the user had direct experience with a system. Grandon et al. (2005) claim that Virtual Self-Efficacy has an indirect effect on students’ intention to use, through perceived ease.
Another variable added by Park (2009) is the Subjective Norm, which have been considered as one of the key determinants of behavioral intention. These refer to the way in which the perceptions of relevant groups or individuals, such as family, friends, and peers, affect our execution of a behavior (Ajzen, 1991; Ajzen & Albarracín, 2012; Malhotra & Galletta, 1999).
According to the study by Gradon et al. (2005), subjective norm was a significant factor in determining intention to use by university students. In contrast, Ndubisi (2006) found that subjective norm had no significant effect on intention to use the virtual classroom in college students.
The other factor added by Park (2009) to his TAM model was System Accessibility. This author defines it as the degree of ease with which a university student can access his or her university’s virtual classroom. On this factor, Pituch and Lee (2006) consider that system characteristics are important determinants of perceived usefulness, perceived ease and use of the virtual classroom. Thong et al. (2002) have identified system relevance, visibility, and accessibility as organizational variables. Lin and Lu (2000) agree that greater accessibility to information leads to greater use of information and greater perceived ease. The model that Park (2009) reports as proven in his research is shown in Figure 2.
This model entails the following hypotheses:
Virtual Self-Efficacy has a significant direct effect on Behavioral Intention, but it also has an indirect effect mediated by Perceived Usefulness and Attitude, as well as another indirect effect mediated by Perceived Ease and Attitude. Attitude also has a direct effect on Behavioral Intention.
Subjective Norm has a direct effect on Behavioral Intention, but also has an indirect effect mediated by Perceived Usefulness and Attitude. Subjective Norm also has direct effects on Perceived Usefulness and Attitude.
System Accessibility has an indirect effect on Attitude, mediated by Perceived Ease.
Objectives
To verify the psychometric properties of Park’s (2009) measurement instrument, confirming its construct validity, discriminant validity, convergent validity, and reliability.
To test the efficacy of the model tested by Park (2009) by means of a multiple mediation analysis.
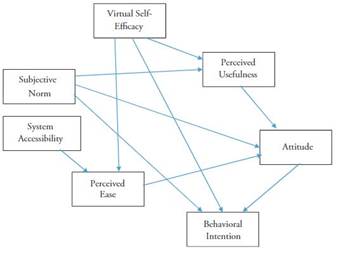
Source: Own elaboration based on the results reported by Park (2009).
Figure 2 TAM model reported by Park (2009)
3. METHOD
3.1. Type of study and design
This was a quantitative, correlational, explanatory, field, and cross-sectional study. Two designs were used, a Confirmatory Factor Analysis (CFA) to confirm the concurrent validity, discriminant validity, construct validity, and reliability of Parks’ (2009) TAM model, as well as a Multiple Mediation Analysis (MMA) to determine the effectiveness of the predictions of his model.
3.2. Sample and data collection procedure
Data were collected at the end of the second quarter of 2020, from June 25, 2020, to July 31, 2021. The addresses of the Schools of Education of the main universities in the Dominican Republic were asked to share an email with the link to the online questionnaire. A total of 1260 participants from a total of 13 universities completed the questionnaire.
3.3. Data analysis
First, the data from Park’s (2009) original model were introduced into the AMOS software, version 22, AFC procedure. It was necessary to correct this model since the procedure found that it produced an unacceptable solution, since the covariance matrix of the latent variables was not positive definite. To correct the model, it was necessary to eliminate one of the factors, System Accessibility, since it was supported by only one item and the latent factors must be supported by a minimum of two items. A factor supported by only one item becomes a peripheral factor. The behavior of the responses to that single item also justified its elimination, since, despite having a mean of 5.13, the 75th, 90th, and 95th percentiles all coincided with the maximum score of 7, given that the distribution was abnormally skewed toward the higher scores (Skewness = -.736, Kurtosis = -.535, Kolmogorov-Smirnov = .203, p = .000). In other words, more than half of the participants gave scores 6 (21%) and 7 (31%) to the System Accessibility item, with which it lost its discriminatory ability.
There was also a need to eliminate one of the items of the Subjective Norm factor (No. 17: To prepare myself for a future job it is necessary to take e-learning courses), to increase the reliability of this factor to a more acceptable level.
With the corrected model we then used the AMOS MMA procedure to properly determine the significance of the direct, indirect, and specific effects of the mediating factors on the BI to use the virtual classroom.
The description of the demographic variables was obtained with SPSS, version 22, descriptive statistics.
3.4. Measurement Instrument
We used a questionnaire with a total of 24 questions. The first seven questions were directed to demographic variables of which five were categorical: Name of the university, Sex of the participant, Device to access the virtual classroom, Internet access service and Virtual classroom most used by their teachers. Among the remaining 2 questions the Year of study was ordinal, and the Number of virtual subjects taken was numerical.
The remaining 17 questions were translated from the questionnaire used by Park (2009) and were answered on a scale of 1 to 7, where 1 meant Strongly Disagree and 7 meant Strongly Agree. The translation was reviewed by several experts and a pilot study was conducted with 103 participants to confirm the understanding of the questions.
4. RESULTS
4.1. Demographic variables
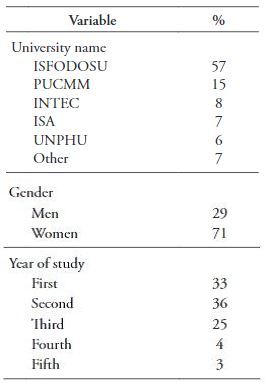
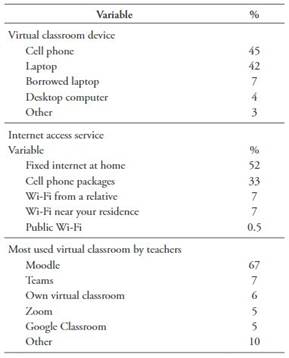
Table 1 shows the results of the categorical and ordinal demographic variables. Table 2 shows information about devices used, internet access and virtual classrooms. The number of virtual subjects taken had a mean of 2.07 (SD = .983), however, although 50% were clustered between 4 and 9 subjects taken (Interquartile range = 5; Median = 6), about 15 (1%) outliers with more than 15 virtual subjects were observed.
4.2. Psychometric properties of the measurement instrument
Table 3 presents a summary of the CFA for the corrected model with only six factors, having eliminated the System Accessibility factor because it was supported by only one item. One item was eliminated from the Subjective Norm factor to bring it to an acceptable reliability.
Table 3 Descriptive data, factor loadings and reliability of each item, factor, and subscale of the Intention to Use the Virtual Classroom Questionnaire
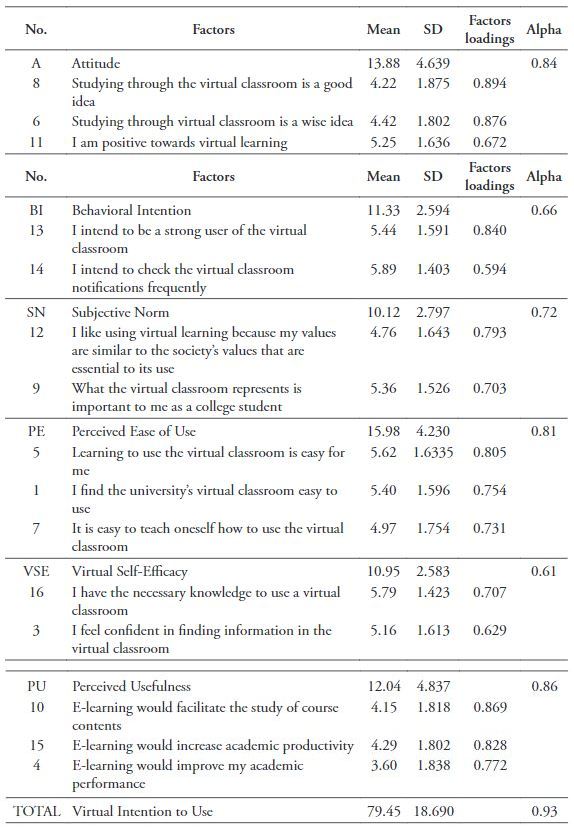
The items of each factor in this table are ordered from highest to lowest, according to their respective factor loadings. To obtain perfect convergent validity, all factor loadings should be above .70. In this case, most of them exceeded that level, with two exceptions above .60 and one above .50, but by far exceeding the .30 minimum allowed.
In general, the items per factor are few, two and three, compared to the four recommended for one factor. This is probably why the reliability Alpha indices are not all high, greater than .70, since among those with only two items per factor we found the lowest Alpha indices, Behavioral Intention and Virtual Self-Efficacy, except for the Subjective Norm factor, which exceeded the appropriate level of .70 when we eliminated one of its items to become a two items factor.
Discriminant validity can be verified by the correlations between the constructs or factors. These must be below .85 to demonstrate good discriminant validity. As can be seen in Table 4, although all these correlations were highly significant, probably because of the large sample size, none exceeded the .85 level.
Table 4 Correlations between factors
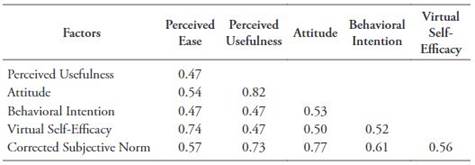
Note: All correlations in the table were highly significant (p= .000)
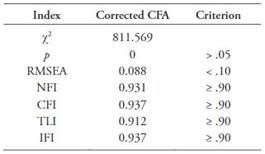
Finally, the construct validity of the scale can be verified through the corrected model fit indices provided by AMOS. These indices are shown in Table 5. In this table it can be verified that the Chi-square did not meet the criterion that its significance should be greater than .05, but this criterion is very difficult to meet when working with large samples such as ours (Park, 2009). The other comparative indices met the fit criteria, including the Root Mean Square Error of Approximation (RMSEA). The Normalized Fit Index (NFI), the Comparative Fit Index (CFI), the Tucker-Lewis Index (TLI) and the Incremental Fit Index (IFI) all exceeded the criteria of being above .90.
4.3. Multiple Mediation Analysis of the Virtual Use Intention Model
As Park (2009) only did a CFA with his data, to test his hypotheses about the direct and indirect effects of the factors on Behavioral Intention he resorted to a t-test to determine the significance of the parameters based on the ratio between the parameters and their standard errors (Jöreskog & Sörbom, 1989). As we needed to correct Park’s model, we used a more direct procedure to determine the significance of the specific indirect effects of the mediating variables on the Intention to Use the virtual classroom: an MMA.
Figure 3 shows the path diagram resulting from the mediation analysis. This figure shows the factors included in Figure 2 which contains the factors with significant effects on Behavioral Intention reported by Park (2009), except for the System Accessibility factor which we had to eliminate.
The arrows in the figure include the standardized regression weights of the direct effects of the factors. Regardless of their magnitude, all these effects were significant (p = .000). For example, the direct effect of Virtual Self-Efficacy on Behavioral Intention was .25, on Perceived Usefulness .10, and on Perceived Ease .74. The direct effect of Subjective Norm on Behavioral Intention was .37, on Perceived Usefulness .67 and on Attitude .33. The direct effect of Perceived Usefulness on Attitude was .54, the direct effect of Perceived Ease on Attitude was .10 and the direct effect of Attitude on Behavioral Intention was .12.
Figure 3 also shows the squared multiple correlations (R2) of each endogenous factor, which represent the percent of variance explained by each endogenous factor: Perceived Usefulness 54%, Attitude 74%, Perceived Ease 55%, and Behavioral Intention 42%. Each of these 4 factors also shows its error variance: Perceived Usefulness (eup) = 1.21, Attitude (ea) = .61, Perceived Ease (efp) = .89 and Behavioral Intention (eic) = .97.
Another relationship shown in the Figure, unnoticed in Park’s (2009) model, was the moderate positive correlation (r = .56, p = .000) between the exogenous factors Virtual Self-Efficacy and Corrected Subjective Norm.
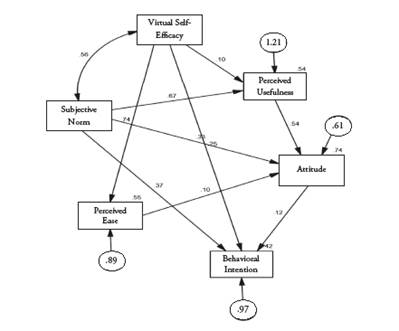
Table 6 presents the specific indirect effects in the mediation analysis.
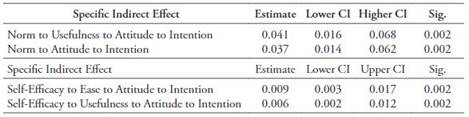
As we can see in the table, all these indirect effects were highly significant. The most influential mediation chain was Subjective Norm to Behavioral Intention, mediated by Perceived Usefulness and Attitude. Next in importance was Subjective Norm to Behavioral Intention, mediated only by Attitude. The least important, but also highly significant, chains were from Self-Efficacy to Behavioral Intention, mediated by Perceived Ease and Attitude, or by Perceived Usefulness and Attitude. Lower and Upper Confidence Intervals (CI) were calculated at 95%.
The high and significant (p = .000) total standardized effects were those of Subjective Norm on Perceived Usefulness (.67), on Attitude (.38) and on Behavioral Intention (.37). Also, the total effect of Virtual Self-Efficacy on Perceived Ease (.74) and that of Perceived Usefulness on Attitude (.54).
Finally, Table 7 shows the Fit Indices of the Multiple Mediation Model. Again, we see in this table that the Chi-square significance criterion could not be satisfied because this measure is very sensitive to sample size and is difficult to satisfy with a large sample like ours.
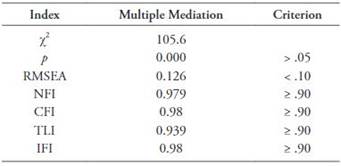
The other comparative indices met the fit criteria, except for the RMSEA which should have been below 0.10 but came in at 0.126. The NFI, CFI, TLI and IFI, all exceeded the criteria of being above 0.90.
5. DISCUSSION AND CONCLUSION
We already saw that several authors considered that the determinants of the TAM Model could explain between 40% and 60% of the variance of Technology Use Intention (Venkatesh & Davis, 2000; Park, 2009; Venkatesh 2000; Legris et al., 2003). In our study, Attitude exceeded that predictive power with 74% of the variance, Perceived Ease explained 55% and Perceived Usefulness 54%.
Among the external variables that Park (2009) specified in his modification of the TAM Model we found evidence that Subjective Norm had great influence on Behavioral Intention, agreeing with several authors (Ajzen, 1991; Ajzen & Albarracín, 2012; Malhotra, & Galletta, 1999; Gradon et al., 2005). We can state the same about the influence of Virtual Self-Efficacy, agreeing this time with Venkatesh and Davis (1996) and Grandon et al. (2005). However, due to deficiencies in the measurement of the System Accessibility factor, we were unable to test the influence of this factor on the Intention to Use the virtual classroom.
We did find evidence of the influence of the original TAM factors on Behavioral Intention, Perceived Usefulness, Perceived Ease and Attitude, as several authors had claimed (Selim 2003; Bedregal-Alpaca et al., 2019; Fishbein, 2008).
We can affirm that the Subjective Norm is one of the key determinants of behavioral intention. This refers to the way in which perceptions of relevant groups or individuals, such as family, friends, and peers, affect our Intention to Use the virtual classroom. This Subjective Norm also influences Intention to Use through the mediation of Perceived Usefulness and Attitude.
We can also conclude that Virtual Self-efficacy is an important determinant of the Intention to Use the virtual classroom, especially when mediated by Perceived Ease and Attitude. Motivational actions to strengthen the actual use of the virtual classroom should consider the promotion of the Subjective Norm and virtual Self-efficacy.
The obstacle to overcome was the weakness in measuring the Accessibility of the system factor, which is why it was eliminated from the analysis. To measure this factor correctly, it will be necessary to increase the number of items that support it, based on measurement instruments that have proven to be valid and reliable.
The fit indices of the theoretical models, both in the CFA and the MMA, can be improved by increasing the number of items for each factor.
6. RECOMMENDATIONS
Before embarking on the design of action plans to strengthen the Intention to Use the virtual classroom in our students, we recommend redesigning the measurement instrument by integrating at least 4 items for each factor, so that the fit indices of the theoretical models meet all the recommended requirements for a perfect fit, including then the Accessibility of the System.

