


 Inglés (pdf)
 Articulo en XML
 Referencias del artículo
 Enviar articulo por email
 Citado por SciELO
  Similares en
SciELO
Similares en
SciELO 
 Permalink
1. Introduction
Investment is such money that is put away for future use. There is a lot of ways through which investors can invest their money for example in the shape of gold, foreign currency, etc. In the shape of investment of gold investors have found significant benefits. The investment in gold is known as tangible assets investments. According to different investors, gold is known as a much-trusted investment. Gold is also known as quite a safe investment from the financial crisis. It has been seen that gold is a less risky investment than other assets. Past studies have proved that there is a significant relationship between gold prices and the stock market. It could consider gold as a safe investment (Baur and Lucey, 2010).
In Pakistan, from the last few decades, the Gold prices were very high. It has reached 55 thousand in these years the international gold market was also affected. An increase in the prices of gold has badly affected the economy. Gold prices are known as the best indicator of the economy of a healthy economy. The decrease in gold prices means the economy is going downward direction. Oil cost is known as the basic aspect of determining industrial production. The cost of gold has affected the worldwide development of the economy (Baur and McDermott, 2010).
In 2005, the international economy was in the position of the downturn because the cost of gold was near about the US $416 per ounces. According to different researchers, gold is known as the store of value. In Nov 2010 the gold cost was at the peak it was US$ 1421 per ounces. The association between the gold rate and the interest rate is negative. Marx’s concept of cash was a very crucial aspect of describing the adoption of cash. Prices of gold can be predicated based on the prediction. Researchers have proved that there is no connection between oil costs and gold costs. Pakistan’s financial development is 7% while it is seen that after its freedom its financial development is not more than 5%. Pakistan’s financial development has been dropped at 2.7% low financial development is the first barrier for the development of the country. Due to this financial crisis, Pakistan’s hardship was affected badly the government of Pakistan has taken 715 billion for the improvement of the poverty of Pakistan (Bampinas and Panagiotidis, 2015).
In the modern era, the oil crisis is the blood for every economics. Oil prices have indeed helped out the maintain the level of oil prices. We are trying to find out the impact of oil prices on the stock market. We also try to explore that investors would like to invest in the stock market or gold prices. There is reserved work related to the impact of the oil crisis on the stock exchange. There are three main researchers related prediction of economic growth.
All over the world, oil is known as the more crucial source of energy. Oil prices are known as the biggest need of every country due to this reason prices brings an effect on the performance of the country. Now the days the prices of oil as important as gold prices. The world’s largest commodity market is known as the crude market. Different scholars proved that crude oil impact on the economy of the countries. Oil prices have also impacted on the consumption and production of the commodity (Ciner et al., 2013).
The gold investment gives a sense of certainty to the investors during financial downturns and can be considered as an alternative and attractive investment due to the simplicity of the gold market. Gold can also be viewed as a portfolio diversifier because of its low correlation with other assets and therefore lowers the overall portfolio risk (Ciner et al., 2013). Notably, the central banks also retain gold for diversification purposes and to safeguard from economic uncertainties (Kaufmann and Winters, 1989).
1.2 Problem statement
A lot of Previous studies were performed on this topic (Kanjilal and Ghosh, 2014) as they have mainly analyzed the stock, gold and oil linkages in a linear setting. Some scholars make an argument that one basic shortcoming of linear modeling is that it assumes that time series are linear while in real times they are non-linear. Prior studies have also examined the volatility relationships in a linear setting (Arouri et al., 2011; Hammoudeh and Yuan, 2008; Sadorsky, 2014) and found that commodities volatilities can explain the stock prices. Moreover, significant volatility transmission is also witnessed from commodities to stock markets. Very few studies are found on this topic in the context of Pakistan. The sample size was small in previous studies. Oil and Gold cost has affected the worldwide development of the economy. This will contribute to theory in the future. The objectives of the study are as under:
To determine the relation between oil prices and stock market; and
To determine the relation between gold prices and stock market
The research is significant for government and policymakers as it will assist them to know how much the stock market is considered to be one of the most important components of any modern economy that provides the access to the capital of the public and makes it available for use by business entities. It will help them to know if economic relationship would be stronger in the future then government of Pakistan would be more successful in improving its relationship with the other western world in general terms as an integral part of a developing economy the stock market of Pakistan can be expected to be a more important investment method in the future and will be expanded as it absorbs an increasing amount of the investment capital from domestic investors. Policymakers need to know who is responsible for planning the development of the economy to educate themselves about this subject, and to have a broad, general understanding of the behaviour of this market. Furthermore, because gold is one of the most popular tools the Pakistani government uses to implement its monetary policy and also it is very important for monetary authorities.to have a clear understanding of the possible relationships between gold and the stock market. This study may also become a beginning step for further research into the behaviour of the stock market. It will also contribute to theory standpoint.
Literature review and hypotheses
Raza et al. (2016) examined the asymmetric impact of gold prices, oil prices and their associated volatilities on stock markets of emerging economies. Monthly data were used from January 2008 till June 2015. The nonlinear ARDL approach was applied to find short-run and long-run asymmetries. The empirical results indicated that gold prices harm stock market prices of large emerging BRICS economies and a negative impact on the stock markets of Mexico, Malaysia, Thailand, Chile, and Indonesia. Oil prices harm the stock markets of all emerging economies. Gold and oil volatilities have a negative impact on stock markets of all emerging economies in both the short —and the long— run. The results indicated that the stock markets in the emerging economies are more vulnerable to bad news and events that result in uncertain economic conditions.
Afsal and Haque (2016) said that the price movements in the gold market are considered to detect non-linear dependencies with the stock market in the Saudi Arabian context. Both the univariate and multivariate models of generalized autoregressive conditional heteroskedasticity (GARCH) class were employed in this study. Initially, the work used GARCH (1,1) specification to detect the persistence level of volatility. Proceeding further, a series of models are used to study leverage effect, spillover pattern, risk-premium effects, absolute returns, and power transformation factors, etc., Finally, diagonal Baba, Engle, Kraft, and Kroner specification was used to determine the contagion effect between gold and stock markets. The findings chiefly proved that a dynamic relationship between gold and the stock market does not exist.
Najaf, R. and K. Najaf (2016) said that due to the global financial crisis, around all over the world all developing and under-developing countries are facing a low trading profit. In most developing countries like Pakistan, there is a low investment level due to political instability. Due to this condition, the Karachi stock exchange has the worst sell. Karachi stock exchange is known as the oldest and more profitable stock exchange of Pakistan oil and gold prices are attracting investors towards there, not in the stock exchange. They said that this thing is a barrier to the progress of the development of the country. This research was trying to expose that the stock market is going down due to these variables. For checking the impact of oil and gold prices on the Karachi stock exchange. They have used secondary data for this study. For this purpose, they had taken data from Karachi stock exchanges from the period of 1996 to 2013. The correlations had shown that in these markets there is not a positive relationship. Karachi stock exchange and GDP have an inverse relationship with the gold market. These results had also shown that oil growth has a significant relationship with KSE100 and GDP. For the prediction, correlation is not considering an authentic measure.
Basher and Sadorsky (2016) utilized DCC, ADCC and GO-GARCH models to examine the conditional correlation between gold, oil and the price index presenting emerging stock markets. Notably, volatility estimation utilizing GARCH-type models for a large data set is a challenging task due to the curse of dimensionality i.e., the tradeoff between feasibility and generality. The estimations through multivariate GARCH models, e.g., BEKK allow parameters to grow rapidly and other specifications such as DCC, CCC, and GO-GARCH only capture the time-varying correlation but fail to capture the spillover and transmission effects between commodities volatilities and stock prices. Contrary to previous studies where the volatility is estimated through GARCH-type models, they use oil and gold price volatilities readily tradable at the Chicago Board Options Exchange to determine the nonlinear impact of prices and volatilities on the emerging stock market.
Nejad et al. (2016) examined the relationship between oil price risk and Tehran stock exchange returns during the period 2003-2014. Due to the existence of great shocks for the oil price in the period and therefore its effect on the trend of the Tehran stock exchange, the risk of oil price is calculated under The Value at Risk (VaR) model in this study. Hence, they apply three approaches including Gregory and Hansen, Saikkonen and Lütkepohl, and Johansen trace test which is performed in the framework of structural breaks existence to evaluate the long-run relations among the variables. The results indicated a long-term relationship between oil price risk and Tehran stock market returns. The results also showed a significant impact of international sanctions imposed on the Iranian nuclear file on the Tehran stock exchange.
Jain and Biswal (2016) said that governments impose taxes and levies to manage the effect of gold and crude oil imports on the exchange rate. These in return have relations with the economy of the country, best reflected in the stock market index. They explore the relationship between global prices of gold, crude oil, the USD-INR exchange rate, and the stock market in India. The dynamic contemporaneous linkages have been analysed using DCC-GARCH (standard, exponential and threshold) models and the lead-lag linkages have been examined using symmetric and asymmetric Non-Linear Causality tests. Empirical analyses indicated a fall in gold prices and crude oil prices cause to fall in the value of the Indian Rupee and the benchmark stock index i.e. Sensex. The findings of this study also supported the emergence of gold as an investment asset class among investors. More importantly, this study highlighted the need for dynamic policy-making in India to contain exchange rate fluctuations and stock market volatility using gold price and oil price as instruments.
Kumar (2015) observed that there is a negative relationship between oil prices and stock exchange of the UK. For this purpose, they have utilized the data from 1990 to 2010 and applied the multi regression model. Results had shown that there is a long-run relationship between oil prices and stock exchange.
Choudhry et al. (2015) estimated the relation between gold and stock market in the period of financial crisis; they realized that gold maybe not efficient asset which was used to as a hedge in the period of the financial crisis because in this period the interdependence between gold returns and stock market volatility was weaker. Generally, gold may be worked as a haven against risks in the stock market in stable financial and economic conditions.
Bildirici and Turkmen (2015) find that the explanatory power of nonlinear models is higher than the linear models. They also examined the testing procedure of linear and non-linear models and states that one basic shortcoming of linear modelling is that it fails to capture the asymmetry in variables’ behavior over time.
Tiwari and Sahadudheen (2015) suggested that the nonlinear relationship between commodity and stock prices is mainly due to the operations of various market agents with heterogeneous expectations and beliefs. Several studies have examined the cointegration between commodities and stock prices due to their irreplaceable role in the economy. Oil and gold are the two highly liquid commodities and are synchronized in their movements. However, a series of crises, e.g., economic crisis of 1970, ERM Crisis, OPEC decisions in 1994, Russian Crisis in 1997, Asian financial crisis in 1998 and global financial crisis in 2007-09 have encouraged the investors to evaluate the alternate investment assets for diversification during economic downturns (Vacha et al., 2012).
Naifar and Al Dohaiman (2013) tested the nonlinear structure of oil prices by using several econometric methods and stressed the explanatory power of linear models. However, the dynamic linkages among any three macroeconomic variables mentioned above, neither mentioned in economic theory nor studied much in the empirical literature.
Reboredo (2013) said that recent co-movements in gold and oil prices have increased interest levels of researchers in examining linkages between gold and oil as their price movements have important implications for an economy and the financial markets. The reason is that in inflationary economy investors increase their holdings of gold because it acts as a hedge against inflation.
Ciner, Gurdgiev, and Lucey (2013) investigated the return relationship between stocks, bonds, gold, oil, and exchange rate. The analysis arrived at provides evidence on whether asset classes can be considered as haven for each other, and gold is regarded as a haven against exchange rates.
Mahmood and Ahmad (2012) The main object of this study is to investigate the impact of gold and oil prices on the stock market of Iran for this purpose they have used VAR model they have concluded the result that there is a negative relationship between them.
2.1 Research hypotheses
H1 There is a relationship between oil prices and the stock market.
H2 There is a relationship between gold prices and the stock market.
Research elaborations
The point of this part was to depict the examination strategy utilized for the accumulation and information investigating of the gathered information. This section portrayed the exploration plan, information collection techniques, analysing strategies and data collection sources and instruments utilized for the present research ponder.
3.1 Research model
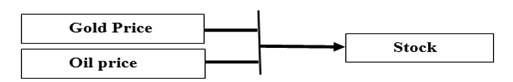
The existing research suggests the effect of gold and oil prices on the stock market. They have a long-run relationship between gold prices, oil prices, and the stock market. These variables can probably cause an impact on the stock market. The conceptual framework can be made via the usage of the above-stated variables (see Figure 1 ).
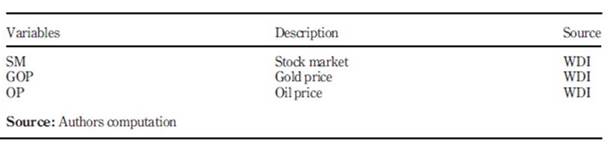
3.2 Variables and data source
In the present study, look at the variables that are used (gold price, oil price, and stock market). Data is accumulated from 1985 to 2016 and the time series information is primarily established in the present work. For the present study, the annual data are collected from WDI. This observation intends gold price, oil price as the independent variable while at the same time the stock market as the dependent variable (see Table 1). There are different empirical studies have available to apply these variables likely Yap and Saha (2013), Issa and Altinay (2006), Seddighi et al. (2001), Chadeeand and Mieczkowski (1987), Belloumi (2010) etc. The functional form of the model is given below.
SM = f (Gold price, Oil price)
3.3 Econometric methodology
The existing study is focused on previous studies that might be conducted in evolved as well as developing international locations. Through statistical Eviews nine software relationship is set in different variables. It based on the studies’ positivism paradigm and different techniques are utilized to examine data. An econometric model is applied to define effects among the stock market, gold price, oil price, and inflation.

3.4 Bound test
The inbound test we find ARDL long-run relationship can exist or not in variables. The bound test is applied before ARDL. If cointegration (long-run relationship) has existed in the proposed variables, then ARDL could be applied. F- Statistic is used by following lower and upper bound. If the upper bound value is less to F-statistic value, in this case, the null hypothesis is not accepted. However, the null hypothesis is accepted when the value of F-statistic is lower to the upper critical bound. Thus, the value of F- Statistic is more than upper bound then it has cointegration long run affiliation among variables and ARDL can apply. Only the F- Statistic value is to a lesser extent to lower bound there is no long-run relationship that can exist and ARDL could not be used. If the price of the F-statistic is coming within upper and lower boundaries, then the test is indecisive. Boutabba (2014) in this case ARDL is applied at the root of the error correction term. The conclusion is mostly accepted at 5%.
3.5 ARDL Approach (Autoregressive Distributed Lag)
In the present study ARDL approach is used to define the relationship between variables. This bound test has advantages as compared to different techniques. Due to the advantage of the ARDL approach that’s why applying in the current study. The first essential gain of the ARDL approach to passing the strong, long-run relationship between variables. The second essential gain of ARDL is sufficient for small size data. The third essential gain of ARDL is that the underlying variable is basically 1 (0), in basic terms 1 (1) or a mixture of each but no is longer continually being 1 (2) stationary. Simply if all variants are stationary at the level or first difference or mixture of level and first difference, then applying the ARDL model for a short or long-run relationship. Due to several advantages of model Pesaran et al. (2001) further developed this. UECM of ARDL is capable to differentiate between explanatory and dependent variables. Also, it has better statistical properties and UECM does not push a short run into the remaining term.
Where sm t , gop t , op t , representing stock market, gold price, and oil price. A natural form of logarithmic series indicating by ln. The long-run elasticities of 𝑠𝑚, and 𝑔𝑜𝑝, 𝑜𝑝, indicating by 𝛽 1 , 𝛽 2 . Johansen- Huselius (1990) is the most extensively used technique to analyze cointegration long-run relationship between variables. In this model, all variables are stationary at first difference. In the case of a small sample is another limitation of this method. Autoregressive distributed lag method to avoid said boundaries. Pesaran et al. (1996) evolved this method and Pesaran et al. (2001) advanced it in addition. Various econometric benefits of this method have won huge attractiveness. Pesaran (1997) posit if all variables in a version are I(0) and I(1) or may be fractionally incorporated.
Referable to the above benefits of the ARDL method, we specify the following model:
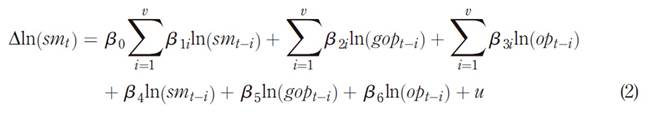
In which the first difference is shown by∆, the optimal lag length is indicated by 𝜈. Short-run elasticity of the model are represented by 𝛽 1 , 𝛽 2 , 𝛽 3 and long-run elasticity by 𝛽 4 , 𝛽 5 , 𝛽 6 ,. If all variables are stationary at the second difference or above, then the ARDL method is not applicable. In (1) long-run relationship can be found and the Augmented Dickey-Fuller test is applied. In (2) using the F- statistic bound test is taken. If the upper bound value is less to F-statistic value, in this case, the null hypothesis is not taken. However, the null hypothesis is accepted when the value of F-statistic is lower to the upper critical bound. If F-statistic is coming within the upper and lower bound, then the test is inconclusive. We use the Schwarz Bayesian Criterion to choose the lag length of variables after trying out cointegration. An error correction model of (2 ) is given as follows:
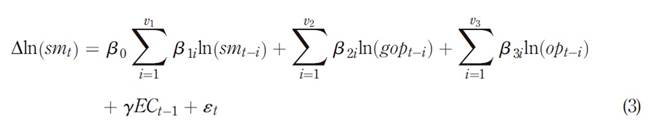
Where the optimal lag length is indicated by 𝑣 1 , 𝑣 2 , 𝑣 3 , 𝑣 4 and the speed of adjustment is represented by 𝛾. The error correction term is shown by 𝛾 is driven via the long-run relationship as presented in (2).
3.6 Time Series Unit Root Test
Time series data are based on stationary form. It is necessary all variable data are available in a stationary form for analysis. If data are not showing any trend, then data is stationary. Non-stationary data are not given a valid result that’s why many researchers cannot accept it. Stationary of data can be check through the Augmented Dickey-Fuller test in the existing study. Unit root observes the null hypothesis that is the time collection underneath has a unit base. The alternative of stationary in the small pattern due to loss of strength in opposition. The unit root is focused on the span of time collection than the range of observation. This test is applied to all variables at the level and on the first difference. Therefore, in present study decision is accepted at 0.05% (level of significance) of probability and all variables on stationary format first difference.
3.7 Optimal lags selection
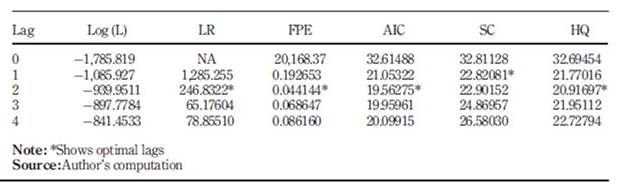
In time-series data lag selection is the first step to which ensured that the model is specified or not. Simiyu and Ngile (2015) for an optimal lag selection different procedure is usable but doesn't specify a proper pattern to select optimal lag. If we have time-series data, then 4 to 5 lags could be taken. Kostyannikova (2012) choice of suitable lag is important for precious information, however, selecting too much lag is not useful for modelers. By using AIC and SIC the serial correlation is not removed then increases the lag length for remove serial correlation. Through Eviews nine software 2 lag is selected it gives related information. Optimal lag is showing in strict form as (*), it indicates that a point where the value of the projected variable lag is minimized. Different methods are offered to show a lag as LR, FPE, AIC, SC, HQ. In the present study optimal lag is choosing at point 1 on the base of SC.
Table 2 shows the results of the optimal delays. The optimal selection of delays is a delicate task because if we include too many delays in the model, this could lead to an error in the forecasts while adding too few delays without relevant information. Experience, knowledge, and theory are the best ways to select optimal delays, but there are information criteria procedures that can be selected by optimal delays. There are three commonly used information criteria, namely SBIC, AIC, and HQIC. This study selects two optimal delays based on AIC. In addition, since the criterion generally suggests 2 as the optimal length of delays, we will, therefore, conduct the study on hand with 2 optimal delays.
Empirical findings
4.1 Descriptive statistics
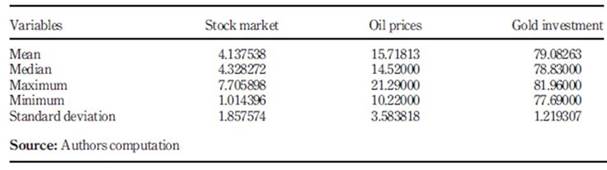
Table 3 speakes, Mean median, minimum, maximum and standard deviation is computed. According to the above table, gold investment averaged 41.3%, oil prices averaged 15.7 and the stock market averaged 79%. According to the above table, gold investment has a minimum value of 1.014396, Oil prices have a minimum value of 10.22000 and the stock market has a minimum value of 77.69000. According to the above table, gold investment has maximum value of 7.705898, Oil prices have a maximum value of 21.29000 and the stock market has a maximum value of 81.96000. According to the above table, gold investment has a median of 4.328272, oil prices have a median value of 14.52000, and the stock market has a median value of 78.83000. According to the above table, gold investment has a standard deviation value of 1.857574, oil prices have a standard deviation value of 3.583818, and the stock market has a standard deviation value of 1.219307.
4.2 Unit Root Test
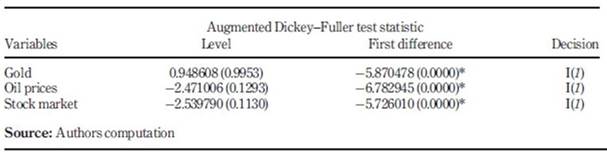
Table 4 shows, Unit root has been applied at the level and the 1st difference in the above table. The unit root test is applied to determine either data of variables is stationary or non-stationary. Gold investment is the independent variable. The probability of gold investment at a level is non-stationary as well as at first difference it is 0. 0000 it means that data of gold investment is stationary as value is less than 0.05. Stock Market is a dependent variable. The probability value of the stock market is found nonstationary at a level. The probability value of the stock market is 0. 0000 it means that data of the stock market is stationary as value is less than 0.05. Oil prices are the independent variable. The probability of oil prices is found nonstationary at a level. The probability of oil prices is 0. 0000 it means that data of oil prices are stationary as value is less than 0.05.
4.3 Bound Test
The inbound test we find ARDL long-run relationship can exist or not in variables. The bound test is applied before ARDL. If cointegration (long-run relationship) has existed in the proposed variables, then ARDL could be applied. F- Statistic is used by following lower and upper bound. If the upper bound value is less to F-statistic value, in this case, the null hypothesis is not accepted. However, the null hypothesis is accepted when the value of F-statistic is lower to the upper critical bound. Thus, the value of F- Statistic is more than upper bound then it has cointegration long run affiliation among variables and ARDL can apply. Only the F- Statistic value is to a lesser extent to lower bound there is no long-run relationship that can exist and ARDL could not be used. If the price of the F-statistic is coming within upper and lower boundaries, then the test is indecisive. Boutabba (2014) in this case ARDL is applied at the root of the error correction term. The conclusion is mostly accepted at 5%.
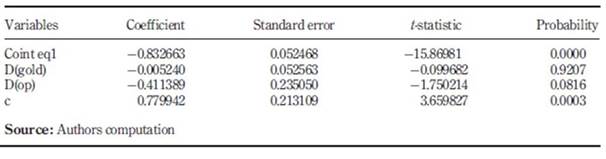
4.4 Autoregressive distributed lag
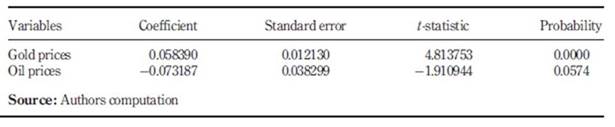
Tables 5 and 6, that probability value of a gold investment in the long run equation is 0.000 which showed that there is long-run relation among gold investment and the stock market. The probability value of oil prices in the long-run equation is 0.05 which showed that there is long-run relation among oil prices and the stock market. The probability value of gold investment in the short run equation is 0.9207 which is greater than 0.05 that showed there is no short-run relationship among gold investment and the stock market. The probability value of oil prices in the short-run equation is 0.08 which is greater than 0.05 that showed there is no short-run relation among oil prices and the stock market.
4.5 Diagnostic tests
To check the validity and robustness of the ARDL model, different diagnostic tests are applied to the ARDL model. Whose names are Jarque Bera, LM, Breusch-Pagan-Godfrey. Various diagnostic tests are presented in Table 6
4.5.1Autocorrelation
The test of serial correlation LM is used in the error of the regression model. It is known as Breusch-Godfrey tests that make for the residuals from the model and results derived. After applying this to the observed data series, it is found the validity of the model. There is no serial correlation, the null hypothesis accepted of the p-value in any order. In the regression model, it may apply for removing serial correlation. If it exists, then to take lagged of the dependent value and used for as the independent variable. After all, the serial correlations remove. This is valid only for regressors testing, thus the first-order autoregressive model (1) AR for the regression error.
4.5.2 Heteroscedasticity test
Generally, the Breush-Pagan test detects the heteroscedasticity in the OLS model. Furthermore, the error term variances would not be equal then the heteroscedasticity exists. For that reason, heteroscedasticity exists if the chi-square value would be large. Either heteroscedasticity involves one variable or several variables in the model.
All the diagnostic analysis results are presented in which are based on Normality, Serial correlation and Heteroscedasticity tests. First of all, the p-value of serial correlation is 0.1766 which is greater than 10%. Hence, there is no serial correlation (the null hypothesis is accepted). On the other hand, the Jarque-Bera p-value is 0.718756 which is greater than 10%. Thus, the data are normal. Lastly, the p-value of heteroscedasticity is 0.2314 which is greater than 10%. Then, there is no heteroscedasticity (the null hypothesis is accepted).
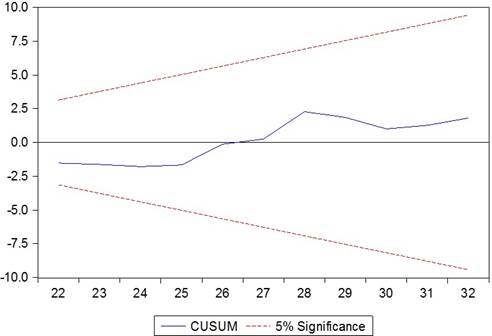
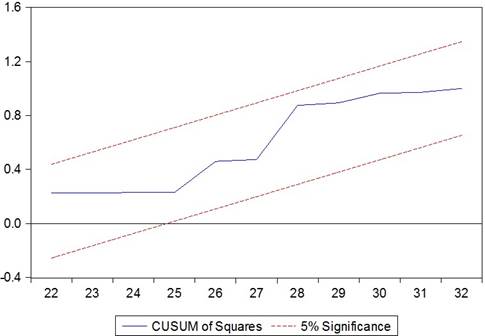
4.6 Stability model
After utilizing the entire test, it is essential to check the stability in the model of ARDL. For accurate testing, unstable models are not viable. For that reason, the CUSUM and CUSUMQ test is used. Hereby confirm, to applying the test to check the stability in the model.
Finally, Figures 2 and 3 show the stability in the implying model. The straight lines are showing in the critical bound at the 5% level of significance and described the estimated coefficient is stable in the model.
5.Discussion
In this research, H1 is accepted. It was found that there is a positive and significant relationship between oil prices and the stock market. The findings are consistent with studies of Najaf, R. and K. Najaf (2016) analysed the impact of crude oil on the stock exchange of Pakistan. For this purpose, they had taken the data from 15 years and applied the Karl Pearson’s Coefficient of Correlation and taken the results that decrease the value of crude oil have a negative impact on the stock exchange of Pakistan. Findings showed that all over the world oil is known as the more crucial source of energy. They said that oil prices are known as the biggest need of every country due to this reason prices bring an effect on the performance of the country. Nowadays, the prices of oil are as important as gold prices. The world’s largest commodity market is known as the crude market.
In this research, H2 is also accepted. It was found that there is a positive and significant relation among gold prices and the stock market. The findings are consistent with studies of Raza et al. (2016) examined the asymmetric impact of gold prices, oil prices and their associated volatilities on stock markets of emerging economies. The empirical results indicated that gold prices have a positive impact on stock market prices of large emerging BRICS economies and a negative impact on the stock markets of Mexico, Malaysia, Thailand, Chile, and Indonesia. Oil prices have a negative impact on stock markets of all emerging economies. Gold and oil volatilities have a negative impact on stock markets of all emerging economies in both the short- and the long-run. The results indicated that the stock markets in the emerging economies are more vulnerable to bad news and events that result in uncertain economic conditions.
In Pakistan, gold costs have proven ongoing improvement for the last many decades. Gold costs in Pakistan has surpassed the restrict of Rs. 40 million truly and later on it went to above Rs. 55 million per Tola. This impact of improving gold prices was also seen in worldwide gold marketplaces in these decades. It is observed that oil costs in its industry went down but meanwhile, from the perspective of Saudi its earnings went way up due to oil removal and household low cost. OPEC had set an oil cost at 18 money per package in Dec 1986, but that cost was not ongoing for years and decreased at the beginning of 1987. After that Iraqi and Kuwait war pays a crucial part in improved oil costs due to the uncertainty of oil provide in 1990. But after Beach war (Kuwait and Iraqi war) the oil cost was observed a significantly decreased until 1994 and achieved at the same cost which was in 1973. Later then in 1998, the cost improved and goes toward resurgence due to decreased oil provide by OPEC and managed at the stage of 1.72 thousand bins in Apr 1999. This plan made oil cost at 25 money per package.
Najaf, R. and K. Najaf (2016) said that Due to this condition of Pakistan stock exchange as it has the worst sell. For checking the impact of oil and gold prices on the Karachi stock exchange. They have used secondary data for this study. For this purpose, they had taken data from Karachi stock exchanges from the period of 1996 to 2013. The correlations had shown that in these markets there is no positive relationship. Karachi stock exchange and GDP have an inverse relationship with the gold market. These results had also shown that oil growth has a significant relationship with KSE100 and GDP. For the prediction, correlation is not considering an authentic measure.
The performance of inventory return is a controversial issue in any nation because it plays a crucial role in global financial aspects and markets due to its impact on corporate finance and business activities. The efficient inventory return diversifies the domestic funds and triggers the productive investment projects, which flourish the financial activities in a nation, but this is only possible if the inventory return has a significant relationship with the macroeconomic variables.
5.2 Conclusion
Investors should diversify investment or saving portfolios and add gold to them. The same goes for firms as they could also add gold savings into their portfolio to hedge against the effect of inflation. The increasing inflation rate causes positive changes in the gold price. This could be a good signal for households, investors, firms, or the government. When facing rising inflation, people could expect the price of gold to be higher next. Therefore, a good intuition should tell them to buy gold at that time to enjoy higher gold returns and at the same time, hedging the effect of inflation.
As the developing countries commonly face increasing price levels, people could predict the continuous rise in the price of gold. However, people or firms that buy gold must take considerable action to diversify with other investments or savings while pursuing this goal. Since this is a relatively new study in terms of its area of research in Pakistan, there are certain obstacles that can be seen as limitations to this study. The lack of studies regarding gold as a hedge against inflation in Pakistan leads to lacking literature. Gold investing in the Pakistan market is a fairly new investment portfolio. Literature studying the same issue also used different sets of methodology and can be considered that almost no literature uses the same as the others.
Investors have herding behaviour due to changes in prices. They do not always behave rationally. In the imperfect markets, there are changes in the trend and these changes are known as nonrandom. Our results are showing that there is no long-run relationship between the stock market of India and the oil and gold markets. Our study is showing that only oil and gold markets are the places from where the investors can escape from the risky investment. In these markets, the liquid ratio is very high. Our study is showing the there is no impact of oil and gold prices on the investors s decision. In the developing country investments in gold, oil is known as the best source for the investment. Forgetting the maximum return investors are trying to find a way of getting a high return. The stock market is considering the best way of investment in the world. Oil has an important place for the Pakistani economy, and volatility in oil prices leads to changes in stock prices. Inefficient market oil price and stock price are contemporaneously correlated, that is, if oil price increases, it would lead to a decline in the stock price of companies that consume oil in their operation. In an inefficient market, changes in oil prices would adjust with the lag of changes in stock price.
Recommendations
Following empirical evidence of our study, we recommend that investors should invest in gold because the main reason is that a hike in inflation reduces the real value of money and people seek to invest in alternative investment avenues like gold to preserve the value of their assets and earn additional returns. This suggests that investment in gold can be used as a tool to decline inflation pressure to a sustainable level. Our study was restricted to use small sample data due to the availability of data from 1991 -2017 and could not utilize structural break unit root tests with two structural breaks as well as structural break cointegration approach as these tests require high-frequency data set.

