


 Inglés (pdf)
 Articulo en XML
 Referencias del artículo
 Enviar articulo por email
 Citado por SciELO
  Similares en
SciELO
Similares en
SciELO 
 Permalink
Introduction
Respiration is the mechanism by which energy stored in carbohydrates provided by photosynthesis in plants is released. As part of the normal metabolism, the loss of this biomolecule results in a loss of fresh weight and visual quality of edible tissue of fruit in postharvest. There are multiple internal (product) and external (environmental) factors that promote a stress situation on the fruit, which will give rise to a wide range of physiological, biochemical and biophysical events that modify the respiration rate. External factors include temperature, air composition, moisture content, illumination, and mechanical damage
The temperature has been considered the most influential since at extreme values it leads to the denaturation of enzymes or physical lesions, which significantly modify the respiration rate (Saltveit, 2016a). Perception and signalling probably occur within seconds of an injury, whereas the induction and response by cellular components may take minutes to hours (Bowles, 1993). Therefore, optimal storage temperatures are expected to minimize the development of disorders or deterioration in stored fruits. The water vapour content in the ambient air, the parameter of which is expressed in the concept of relative humidity, is another variable that can modify the metabolism of the tissue of fruit, through the phenomenon of water diffusion (Saltveit, 2016b). Whitelock et al. (1999) verified that there is a significant decrease in the value of the mass transfer coefficient on the surface of peach fruits as a result of the increase in relative humidity and air velocity, and a decrease in the temperature of the surrounding air. The effect of light is another environmental factor that has been studied to understand the metabolism of edible plant tissues after harvest, to preserve quality during storage. In banana fruits, it accelerates natural ripening and reduces the pre-climacteric period (Özdemir, 2016), in tomato, an increase in lycopene content is reported (Liu et al., 2009). Gong et al. (2015) reported that blue light exposure induced peach fruit ripening, which was associated with an increase in ethylene production. In leafy vegetables, prolonged exposure to light is reported to cause excessive water loss and surface fissures (Xiao et al., 2014). Therefore, the magnitude of the physiological response of fruit in postharvest is linked to this multifactorial effect.
The respiration rate of horticultural products, as a time-dependent phenomenon, has been extensively studied with deterministic mathematical modelling to calculate the exact value of their future behaviour. However, probably no natural phenomenon is entirely deterministic due to the presence of unknown events that can modify this behaviour. In such a situation, it is possible to derive other types of models that can be used to calculate the probability of their future value with a certain level of reliability (Ho et al., 2016). These models are known as probability models or stochastic models (Box et al., 2015). Constructing such models requires a dataset known as a time series, whose characteristic is the chronological order and uniform spacing between its data over time. Thus, the data of the series are considered to be highly dependent on each other.
The wide variety of uses that time series modelling can have is mentioned in the classic text of Box and Jenkins; however, in recent years its application has focused on the areas of environmental sciences, mathematics, and medicine, which together account for 31% of the total number of papers published concerning this topic in scientific journals, compared to only 8% in the area of agricultural and biological sciences (Maçaira et al., 2018). The advantage of using this modelling procedure is that it enables working with complex phenomena where a stochastic component is present in the series with the possibility of incorporating the effect of one or more external variables into it.
Stochastic models derived from time series are based on the stationarity assumption of the series, which holds that the process remains in statistical equilibrium with probabilistic properties that do not change over time (Box et al., 2015). However, time series in certain areas have nonstationary behaviour, so it is necessary to apply differencing to achieve it. The stochastic models with the greatest application are the Autoregressive Integrated Moving Average (ARIMA) models, which base their construction on the methodology established by Box-Jenkins. ARIMA models are quite flexible because they can represent a time series as a pure Autoregressive (AR), pure Moving Average (MA) or combined Autoregressive-Moving Average (ARMA) component (Li et al., 2020). These models are classified as ARIMA (p,d,q), where p indicates number of autoregressive terms, d the degree of integration and q the number of moving average terms. The structure of a pure ARIMA model is represented in equation 1:
 ()1
()1
Where Y t is the response series; ∇ 𝑑 the differencing operator; 𝑡 the time index; 𝜇 the process mean; 𝐵 the backshift operator; 𝜃 𝐵 and 𝜑(𝐵) the moving average polynomials and autoregressive terms, respectively, and 𝑎 𝑡 is the independent disturbance, also called the random error (Box et al., 2015).
In complex systems where the response variable is influenced by multiple variables, it is necessary to incorporate them into the ARIMA model using transfer functions. This new generalized model is also known as a dynamic regression model or ARIMAX (Pankratz, 1991; Maçaira et al., 2018; Lin-Ya et al., 2019). The general structure of an ARIMAX model that includes the different disturbances (noise) is shown in equation 2.
 ()2
()2
Where 𝜔 𝑖 (𝐵) and 𝛿 𝑖 (𝐵) are polynomials of degree s and r, respectively, for 𝑖=1,...,𝑝 explanatory series. The first polynomial represents the magnitude of the effect that the input series has on the output series and the second model the duration of the transferred impact (e.g. temporary or permanent). The operator 𝐵 𝑘 𝑖 represents the delay or dead time before a change in the input variable begins to take effect in the output series (Ramírez-Guzmán, 1993). A compact way of representing this expres-sion is observed in equation 3.
 ()3
()3
Where 𝜗 𝑖 𝐵 = 𝜗 0 + 𝜗 1 𝐵+ 𝜗 2 𝐵 2 +... is a signal or transfer function of the filter of the i th input series 𝑋 𝑖,𝑡 . The weights 𝜗 0 , 𝜗 1 , 𝜗 2 form the impulse response function of the system and represent the impact on 𝑌 𝑡 of a unit change in 𝑋 𝑖,𝑡 . The noise term 𝑁 𝑡 is assumed to be independent of the level of 𝑋 𝑖,𝑡 and allows it to be modelled with an ARIMA process (p,d,q), where 𝑎 𝑡 is reduced to white noise (Box et al., 2015).
Ruby-Figueroa et al. (2017) report that ARIMA models showed good accuracy for flux prediction in the ultrafiltration of fruit juices. Qureshi et al. (2014) developed ARIMAX models to predict mango production based on three exogenous variables, concluding that these variables have significant overall variation control over the obtained model, so the model is suitable for prediction purposes. On the other hand, Jalalkamali et al. (2015) demonstrated that the ARIMAX model has greater precision than other artificial intelligence models for predicting a dependent variable in a meteorological phenomenon.
The stochastic behaviour of the respiration rate variables of fruit and the environmental factors that affect it allows modelling their joint behaviour using time series theory. This work aims to elucidate the influence of temperature, relative humidity, and environmental illumination on the respiration rate of peach fruits based on the transfer models obtained by dynamic regression modelling. The magnitude of the impulse or gain will serve to quantitative evaluate the influence of environmental storage conditions on fruit respiration under unsteady state conditions.
Materials and methods
Experimental tests
Peach (Prunus persica L.) cv Diamante fruits were obtained from an experimental orchard located in the community of Coatepec Harinas (18°55′29.32″N 99°46′07.98″W), State of Mexico, Mexico. Fruits were harvested at physiological maturity with uniform colouring. Before harvesting, fruits were visually inspected to rule out any specimens with any type of damage to their surface. During the transfer to the laboratory, the fruits were placed in corrugated cardboard boxes to avoid mechanical damage during transit.
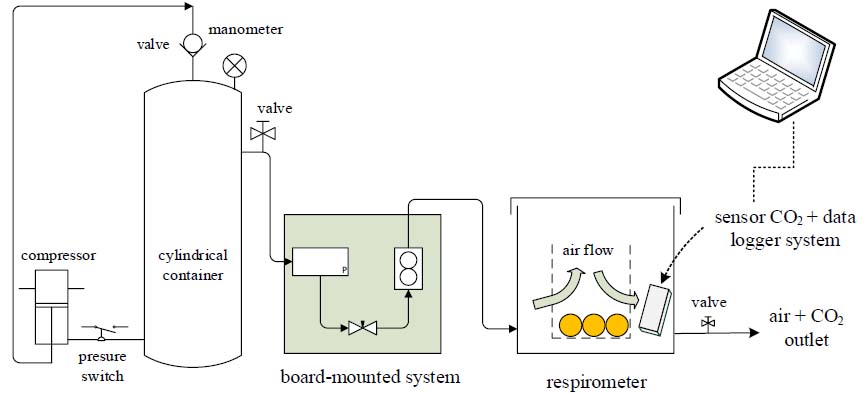
A continuous airflow measurement system was used for respiration rate evaluation. That device was designed by Pérez-López et al. (2014), consisting of a stainless-steel cylinder connected to a 1 HP air compressor through a pressure switch and a ball valve connected to the top of the cylinder. The airflow coming out of the cylinder passes through a board-mounted system consisting of a differential pressure manometer, a metering valve, and a flow meter. The air enters through the bottom of the respirometer, which consists of a hermetically sealed cylindrical container. A steel wire mesh basket was placed inside the container, inside which peach fruits of known weight were placed (Figure 1).
A Telaire(r) carbon dioxide sensor (model 7001, General Electric Company, CA, USA) connected to an external channel of a HOBO(r) data logger system (model U12-012, Onset Computer Corporation, MA, USA) was placed in the free space between the container and the wire mesh. The data acquisition system was programmed into a personal computer using HOBOware(r) Lite v. 3.1.0 software (Onset Computer Corporation, MA, USA) to record CO2, temperature, relative humidity and illumination data every minute. Equation 4 proposed by Pérez-López et al. (2014) was used to calculate the respiration rate.
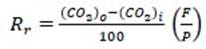 ()4
()4
Where, R r is the respiration rate, F is the airflow passing through the board-mounted system, P is the weight of the fruits inside the container and the subscripts "i" and "o" are the CO2 concentration, measured in the air before and after passing over the fruits inside the respirometer, respectively.
Modelling
The model with the structure of Equation 2 were defined dynamic regression model, better known as ARIMAX model. To build this model, the theoretical information of the study phenomena was used to select the interest variable (output variable) and its affectations (input variables). This theory may also suggest the form of a relationship between these variables. The ARIMAX modelling assume that if both output [ 𝑌 𝑡 ] and input [ 𝑋 𝑡 ] time series is stationary, then the linear combination of stationary time series is stationary and the residuals are stationary also (Jere and Moyo, 2016; Lin-Ya et al., 2019).
The procedure for constructing ARIMAX models is described in the book of Box et al. (2015). The modelling strategy has three parts: (1) model identification, (2) model estimation, and (3) verification of parameters. If a satisfactory model is found, the output variables can be forecasted and, thus, to evaluate the performance of the model. Firstly, stationarity tests of the output [ 𝑌 𝑡 ] and input [ 𝑋 𝑖,𝑡 ] time series were carried out through graphical inspection and unit root tests; if the condition was not fulfilled, differencing operations were applied to transform it into a stationary series. Secondly, order proposals were developed in the AR and MA terms of the stationary input and output time series, trying to reduce the residuals in white noise series (uncorrelated, normal distribution and homoscedastic) (Hipel and McLeod, 1994). The autocorrelation (ACF) and partial autocorrelation (PACF) functions served as a reference to find the appropriate order (p,q) for the proposed model. According to the procedure called pre-whitening and cross-correlation functions (CCF), emphasized by Box and Jenkins, the structure of the ARIMAX model was obtained (Pankratz, 1991). The coefficients of the selected model were estimated using the maximum likelihood (ML) method. To corroborate the statistical significance of the estimated coefficients of the ARIMAX model, the Durbin-Watson (DW), Akaike information criterion (AIC) and Schwarz information criterion (SBC) tests were used. Efforts were made at all times to find parsimony in the proposed model.
Results and discussion
The ARIMA and ARIMAX models were constructed using the PROC ARIMA procedure of the Statistical Analysis System for Windows release 9.4 Statistical Software (SAS Institute Inc., 2018). The descriptive statistics of the series show the location and variability statistics of the series considered (Table 1).
Table 1 Descriptive statistics of the original output [Yt] and input [Xt1, Xt2, Xt3] variable time series
| Time series | average | variance |
| Yt: respiration rate [mg CO2 kg-1 h-1] | 125.02 | 259.20 |
| Xt1: temperature [°C] | 26.53 | 1.82 |
| Xt2: relative humidity [%] | 83.64 | 26.67 |
| Xt3: illumination [lux] | 84.22 | 4772.76 |
Visual inspection of the graphs (Figure 2) and the Augmented Dickey-Fuller (ADF) unit root tests served to verify that the four original time series had a nonstationary behaviour pattern, i.e. the data did not show constant fluctuation around the mean over time. The stationarity in mean and variance of the four series were corrected with the first difference (integrated order I).
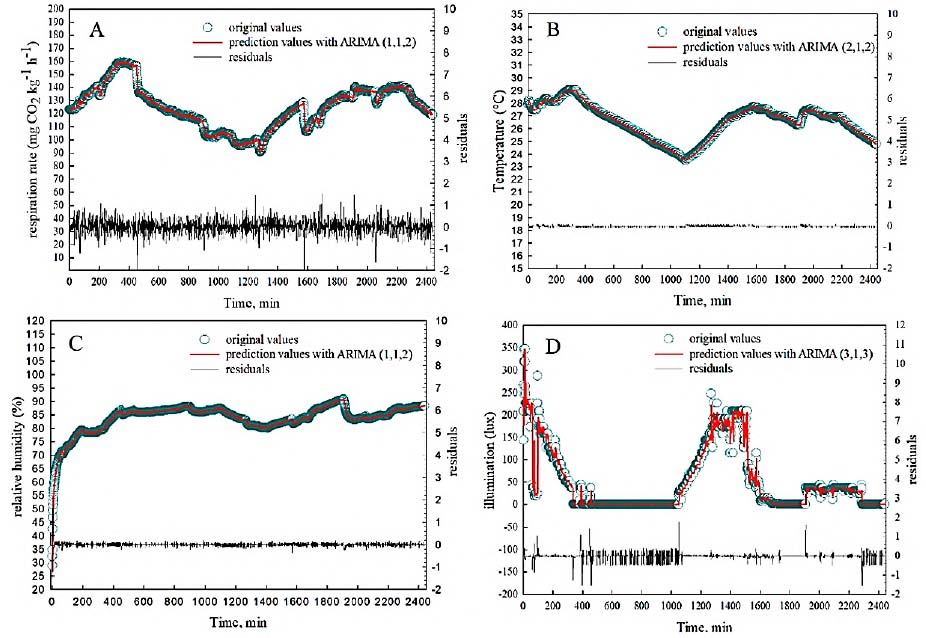
The stationary output series [Y t ] was fitted to an ARIMA model (1,1,2); that is, the autoregressive term was of the first order and the moving average of the second order. The estimated coefficients of AR (1) and MA (2) were significant for the model (> t value) (Table 2). With this model, the Akaike (AIC) and Schwarz (SBC) criteria values were the smallest, so this model was the one that best fitted the data, without over parameterization (Box et al., 2015; Lin-Ya et al., 2019).
The data in the prediction curve had a good fit concerning the original series (Figure 3A). The autocorrelation check of residuals showed a series with white noise, which indicates that the residuals are uncorrelated, and they also presented normal distribution and homoscedasticity (Hipel and McLeod, 1994).
The stationary input series of temperature [Xt1], relative humidity [Xt2] and illumination [Xt3] were better fitted to the ARIMA (2,1,2), (1,1,2) and (3,1,3) models respectively. The estimated coefficients of the AR and MA terms, showed in Table 2, in each model were significant. The low values of the AIC and SBC criteria allowed obtaining parsimonious models and residuals with white noise. The values estimated with the ARIMA model showed a good fit concerning the original series (Figures 3B, 3C, 3D). The multivariable ARIMAX model considers the joint effect of the three-input series on the respiration rate (Table 2). This model expresses the respiration rate as a combination of past values of the random shocks and past values of temperature, relative humidity, and illumination.
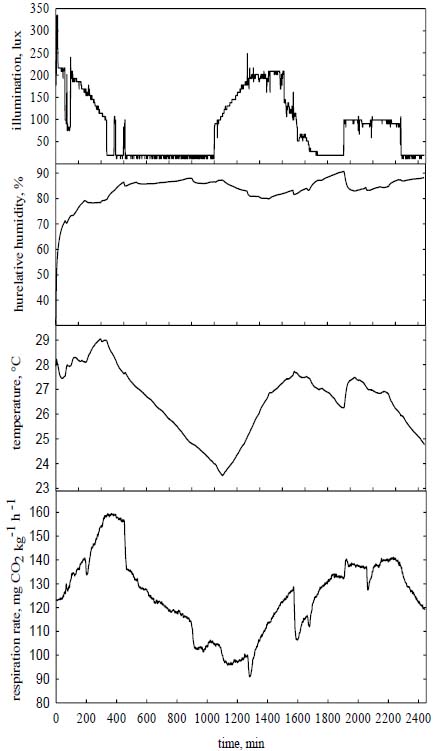
Figure 2 Original time series of the output variable (respiration rate) and the input variables or predictors (temperature, relative humidity, and illumination).
Table 2 ARIMA and ARIMAX models of the output [Yt: respiration rate] and input [Xt1: temperature Xt2: relative humidity and Xt3: illumination] time series corresponding to the physiological process of respiration in peach fruits
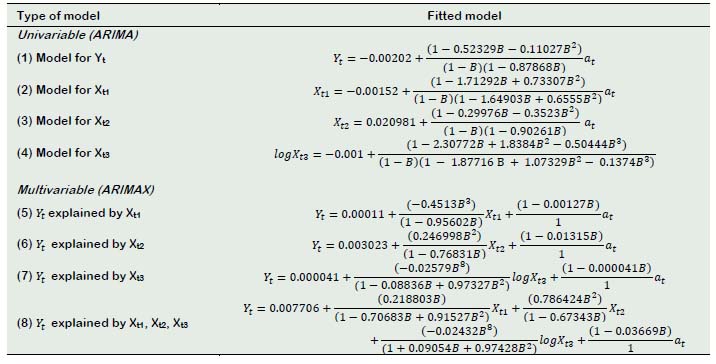
The non-contemporary impact detected by the transfer function indicates that for each unit of increase in temperature and relative humidity, respiration increases by 0.181 and 2.4 mg CO2 kg-1 h-1, respectively, while for each percent unit of increase in illumination, it decreases by 0.011 mg CO2 kg-1 h-1 (Table 3).
Table 3 The gain of the transfer function models of the physiological process of respiration rate in peach fruits
| Type of model | Gain |
| Y t explained by Xt1, Y t explained by Xt2, Y t explained by Xt3 | 0.181 2.40 -0.011 |
This implies 0.15% and 1.9% increase, and 0.001% decrease in the respiration rate of peach fruits because of changes in temperature, relative humidity, and illumination, respectively. The effects were observed between one and eight minutes of delay time after the change in environmental variables had occurred.
Conclusions
The transfer function revealed that a change in temperature, relative humidity, and the illumination of the storage environment causes an increase or decrease in the respiration rate of peach fruits. The effects on respiration were observed between one and eight minutes after the change in environmental variables had occurred. This modelling tool can be used to predict and explain the physiological response of fruits by the effect of external factors imposed continuously during postharvest handling. Better control of external factors and response pathways to these could make a major contribution to preserve the shelf life of fruits.

