


 Inglés (pdf)
 Articulo en XML
 Referencias del artículo
 Enviar articulo por email
 Citado por SciELO
  Similares en
SciELO
Similares en
SciELO 
 Permalink
1. Introduction
Purple corn is an agricultural product native to the Peruvian Andes, cultivated mainly in the mountains and coast of Peru (National Institute of Agrarian Innovation, 2007). The purple corn ear is made up of 15% grain and 85% cob, which have purple pigmentation. Due to this pigmentation, purple corn presents considerable quantities of bioactive compounds that are found in greater proportions in the cob than in the pericarp of the grain (Monroy et al., 2016a). These bioactive compounds can be used in the food industry as food colorants and in the pharmaceutical industry to control cardiovascular diseases and/or diseases related to oxidative stress of the cells (Lao et al., 2017).
The conventional techniques used to extract bioactive compounds from purple corn are through heat treatment, at temperatures between 50 °C and 70 °C, and periods of time that vary between 30 minutes to 60 minutes (Rafael & Castro, 2023). The amount of bioactive compounds obtained by this technique will depend mainly on the extraction time and the solid:solvent ratio; considering that the solvent with the highest extraction yield reported by the literature is acidified methanol. However, methanol is a toxic solvent, so the food industry prefers to use ethanol, relatively reducing the extraction yield.
Surco et al. (2022) compared the content of phenolic compounds of Ricinus communis L extracts obtained by conventional techniques such as ethanolic maceration and hydroalcoholic maceration. The content of phenolic compounds in the hydroalcoholic extracts was 20.98 ± 0.10 mg gallic acid/g sample, while in the ethanolic extracts it was 102.30 ± 1.33 mg gallic acid/g sample. The latter also presented 96% more flavonoid content. Likewise, both extracts contain metals with antioxi dant activity such as copper, magnesium, zinc and calcium. In this sense, the researchers highlight its potential to carry out pre-clinical phase studies.
On the other hand, the high extraction temperatures have a negative effect on bioactive compounds, since it increases the incidence of pigment loss, causing organoleptic and nutritional changes in the extracts (Villarroel et al., 2020; Radziejewska et al., 2020). To minimize the degradation of bioactive compounds in plant materials, innovative technologies have been investigated that are respectful of the environment, such as high pressure, microwaves and ultrasound, which reduce the use of solvents and the impact of high temperatures (Terzića et al., 2023).
Of the eco-friendly technologies, the high-pressure technologies can achieve better extractions of the bioactive compounds, since they do not affect the nutritional quality, covalent bonds or thermolabile compounds (Barba et al., 2013). These compounds are not affected because the high pressures favor the creation of new bonds in the system through biochemical reactions, and, as a consequence, the existing bonds are maintained with increasing pressure. Aghajanzadeh et al. (2022), mention that high hydrostatic pressure technology (400 MPa - 600 MPa / 15 min) improves the luminosity and chroma of blood orange juice by keeping the cyanidin-3-glucoside content constant. On the other hand, isostatic pressures of 250 MPa at 65 °C for 3 minutes improve the content of total carotenoids (36.84%), total anthocyanins (36.18%) and antioxidant capacity (34.57%), however, at higher pressures (≥ 600 MPa) the antioxidant activity can be reduced by approximately 30%.
Koo et al. (2023) confirmed that high hydrostatic pressure technology (600 MPa / 20 minutes) does not significantly compromise the nutrient quality of bok choy juice in terms of total antioxidant capacity, vitamin C, carotenoids, isothiocyanates (ITCs) and vitamin K. In addition, ITCs and vitamin K, important nutrients in green leafy vegetables, were found to be stable at an isostatic pressure of 600 MPa. Researchers infer that vitamin K (phylloquinone) is less susceptible to oxidative processes than the stronger antioxidants present in the juice, however, there is a lack of literature on the effects of HIP on vitamin K. The findings from this study also echo the general consensus that HIP results in better immediate nutrient retention than thermal treatment.
Therefore, the objective of this study was to extract the bioactive compounds from the purple corn cob by high isostatic pressure at different processing temperatures, as alternatives to the aqueous, alcoholic and hydroalcoholic maceration technique, which use large volumes of solvents, energy expenditure, because long times are required for extraction that can be from 8 hours to 8 days at room temperature (Arroyo et al., 2008).
2. Materials and methods
Conditioning of the sample
The purple corn was acquired from a popular market located in the city of Chimbote, Ancash region, Peru. The purple corn cob was dried in an oven with air circulation at 50 °C for 24 hours, cut and ground to reduce the particle size, and sieved through a 60-mesh sieve for 5 minutes. The purple corn cob powder was placed in low-density polyethylene (LDPE) / ethylene vinyl alcohol (EVOH) bags and sealed using a vacuum sealer (Baseline P 100 / 300 w, MULTIVAC, Germany). The samples were stored at 4 °C until used.
Physical characteristics and composition of the purple corn cob powder
The particle size was determined using a particle analyzer (SIROCCO 2000, MALVER INSTRUMENTS, ENGLAND). The moisture and ash contents were determined by gravimetric methods (AOAC, 2005); the crude protein content was determined using the Kjeldahl method (IAL, 2008) with a conversion factor of 6.25; and the lipid content was determined using the Bligh & Dyer (1959) method.
Conventional extraction (CE)
The corn cob extracts were prepared using a powder: solvent ratio of 1:30 (w / v), and the solvent used was a 20% (v / v) ethanol-water solution acidified to pH 2 with 1 N HCl. The mixture was placed in flexible LDPE / EVOH / activated carbon packages, sealed using a vacuum sealer and heated in a thermostatic bath (MOD 116, FANEM ®, Brazil) for 2.5 hours at temperatures of 25 °C, 45 °C and 65 °C. The extracts were filtered through Whatman filter paper No. 1 under vacuum, placed in amber bottles, covered with aluminum foil and stored at 4 °C.
Extraction by high isostatic pressure (HIP)
The HIP processes were carried out in a pilot scale high isostatic pressure equipment (MFF 2L-700, Avure Technologies Inc, USA). The temperature of the chamber was controlled by a K-type thermocouple and the pressure by a pressure transducer, using a computer for data acquisition.
The corn cob powder: solvent mixtures were prepared in a 1:30 (w / v) ratio, placed in flexible packaging, sealed using a vacuum sealer and subjected to high isostatic pressure for 3 minutes, varying the pressures (250 MPa, 450 MPa and 650 MPa) and temperatures (25 °C, 45 °C and 65 °C). The extracts were filtered through Whatman filter paper No. 1 under vacuum, placed in amber bottles, covered with aluminum foil and stored at 4 °C.
Color Analysis
The color of the extracts was measured using a digital colorimeter (HUNTERLAB, UltraScan PRO, USA) based on the CIELAB color space system (L *, a * and b *) (Montes et al., 2005). The cylindrical coordinates Cab * (chroma) and hab (Hue angle) were calculated from the parameters L *, a * and b *, which define the intensity and tone of the samples according to equations 1 and 2, respectively.
(Eq.1)
(Eq.2)
Determination of the total monomeric anthocyanin content (TAC)
The TAC was determined using the AOAC differential pH method (2005). Aliquots of the extract were diluted in amber tubes with 0.025 M potassium chloride (pH 1) and 0.4 M sodium acetate (pH 4.5) buffer solutions, and the absorbance of the solutions determined in the visible region at 520 nm and 700 nm using a spectrophotometer (UV-VIS DU® 800, Beckman Coulter, USA). The anthocyanin content was expressed as cyanidin 3-O-glucoside according to the following equation 3.
Where ‘ε’ is the molar absorptivity, ‘l’ is the length of the passage through the cell, ‘A’ is the absorbance, ‘MW’ is the molecular weight of the reference standard and ‘DF’ is the dilution factor. The equation was converted to express the results in milligrams of cyanidin 3 glucoside per gram of dry weight or mg Cy3G/g dry weight.
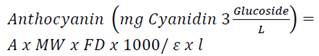
(Eq.3)
Determination of the total phenolic compound content (TPC)
The TPC content was determined using the Folin-Ciocalteu colorimetric method according to Singleton & Rossi (1965), with some modifications. 0.5 mL aliquots were taken and transferred to amber tubes, 2.5 mL of the Folin-Ciocalteu solution was added, and the volume was completed (10 mL) with the extraction solvent used in the extraction (20% ethanol-water / pH 2). The samples were left to rest in the dark for 5 minutes, 2 mL of a 7.5% sodium carbonate solution was added, and the tubes were left in the dark for a further 2 h. The absorbance was measured at 760 nm using a spectrophotometer (DU® 800 UV/Visible Spectro-photometer, Beckman Coulter, USA). The phenolic compound content was the concentration read multiplied by the corresponding dilution factor and the results were expressed in milligrams of gallic acid (GAE) per gram of dry weight or mg GAE/g dry weight.
In vitro study of the antioxidant activity of purple corn cob extracts processed by high isostatic pressure and static maceration
Oxygen Radical absorbance capacity - ORAC
The ORAC procedure was carried out according to Ou et al. (2013) in 75 mM phosphate buffer (pH 7.4), with a final reaction mixture of 200 uL. Twenty-five microliters of the antioxidant solutions plus 150 uL of a 11.12 x 10⁻² (M fluorescein solution were placed in the microplate wells, the microplate preincubated for 10 min at 37 °C and twenty-five microliters of AAPH (2, 2’-azobis (2-methylpropionamidine) dihydrochloride) then added rapidly to each well using a multichannel pipet. The readings were carried out using a microplate reader (Synergy HT, Biotek® Instruments Inc., USA) and the fluorescence recorded every minute for 120 min, the microplate being automatically shaken before each reading. The results were expressed in μmol of Trolox (TE) per gram of dry weight.
Ferric Reducing Antioxidant Power assay - FRAP
In this case, the antioxidant activity was determined according to Benzie & Strain (1996). The FRAP reagent was prepared daily by mixing 2.5 mL acetate buffer (0.3 M pH 3.6), 2.5 mL of a 10 mM TPTZ solution (2,4,6-Tris (2-pyridyl) -s-triazine) and 2.5 mL of a 20 mM aqueous solution of ferric chloride, and maintained at 37 ° C. The test solutions were prepared by mixing a 90 μL aliquot of each extract dilution, 270 μL distilled water and 2.7 mL of FRAP reagent, homogenized using a tube shaker and maintained in a water bath at 37°C. The absorbance was measured at 595 nm after 30 min using a microplate reader (Synergy HT, Biotek® Instruments Inc., USA) and the results expressed in μmol of Trolox (TE) per gram of dry weight.
Identification of the anthocyanins in the purple corn cob extracts by Ultra-performance liquid chromatography tandem mass spectrometry (UPLC-MS/MS)
An ultra-performance liquid chromatography system (Waters Xevo I-Class, Milford, USA) coupled to a tandem mass spectrometry detector (Waters Xevo TQD, Milford, USA) with electrospray source ionization (ESI) in the negative mode was used to identify the anthocyanins in the purple corn cob extracts. The chromatographic separation was carried out using an ACQUITY UPLC® HSS T3 column (100 mm x 2.1 mm x 1.8 µm, Waters, Milford, USA) with a flow rate of 0.6 mL/min. The mobile phase was composed of solvent A (0.1% TFA in water) and solvent B (acetonitrile). The gradient started at 10% B, rose to 35% over 5 min, and then increased to 100% B in 7 min. The MassLynx software (Waters Co. Milford, USA) version 4.1 was used for instrument control and data processing.
The samples were analyzed in the MS scan mode, and the compound masses were extracted according to Pascual-Teresa et al. (2002) using the following operating conditions: capillary voltage 3.5 kV, source temperature 150 °C, desolvation temperature 550 °C, cone gas flow 20 L/h and desolvation gas flow 900 L/h.
3. Results and discussion
Characterization of the purple corn cob powder
The protein, lipid and ash contents were similar to Cerro (2009) in purple corn cob with 11% and 9% moisture contents, respectively. Another important fraction was the carbohydrate content, which was 79.33%, since some pigments, such as simple anthocyanins, can be found esterified to one or several carbohydrates, or acylated anthocyanins, which can be found esterified to carbohydrates and an acyl radical (Strack & Wray, 1989).
Effect of HIP on the TAC of purple corn cob extracts
Figure 1 shows the effects of HIP on the TAC values (mg Cy3G/g dry weight) in the purple corn cob extracts processed at three temperatures, as compared to the contents determined using CE and in the non-pressurized extracts obtained at the same temperatures. Parameters such as the solvent and the solid: solvent ratio were kept constant.
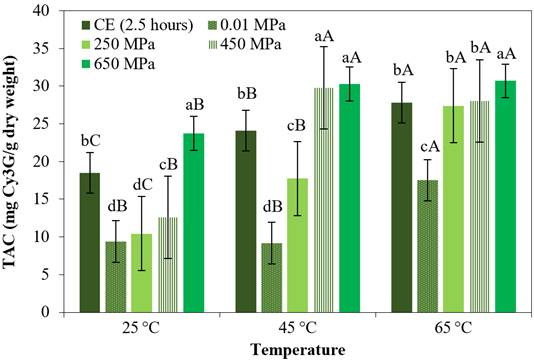
Figure 1 TAC of the extracts obtained by different processing methods and at different temperatures. CE for 2.5 hours, non-pressurized at 0.01 MPa for 3 minutes and HIP (250 MPa, 450 MPa and 650 MPa) for 3 minutes. The bars are means ± standard deviation (n = 3). Means with the same lower-case letters in the same column indicate that there is no significant difference (p > 0.05, Tukey test) between the extracts subjected to the different processing methods, considering the same temperature. Different uppercase letters mean there is a significant difference (p < 0.05, Tukey test) for different temperatures considering the same processing method.
The HIP processes at 650 MPa / 3 minutes at temperatures of 25 °C and 45 °C presented 128% and 71% more TAC (p < 0.05), respectively than the processes at 250 MPa / 3 minutes at 25 °C and 45 °C, respectively, also presented 28% and 26% more TAC, respectively, than the extracts obtained by CE treated for 2.5 hours at 25 °C and 45 °C (p < 0.05), respectively (Figure 1). The effect of HIP on the extraction of phytochemicals can be explained by the rapid diffusion process that causes pressure, facilitating disruption of the plant cells and their contact with the solvent used (García et al., 2016). The results obtained in the present study for the TAC in the extracts were higher than those reported by Muangrat et al. (2018) for Thai purple corn cob extracts processed by ultrasound (ultrasonic probes, 20 kHz / 500 W / 30 min), and by Itthisoponkul et al. (2018) for aqueous extracts of Thai purple corn cob processed by HIP (200 MPa / 25 °C / 15 minutes). According to Dukić et al. (2022), ultrasonic extraction through ultrasonic probes implies direct contact of the probe with the analyte and constant cooling of the sample, therefore, this can lead to the degradation of the thermolabile components and thus affect the reduction of the content of valuable molecules; while in high isostatic pressure, the pressure transfer being simultaneous and uniform at all points of the sample implies induced damage to the cell matrix, greater permeability and consequently the release of bioactive compounds bound to the matrix (Siddiqui et al., 2023). On the other hand, Tatiane et al. (2023) mention that the high pressure also allows the solvent to remain in a liquid state and above its boiling point, being sufficiently capable of helping it penetrate the plant matrix and achieve greater extraction.
Increases in temperature also showed significant positive effects (p < 0.05) on the non-pressurized, HIP and CE processes. The increases in temperature increase the solubility of the solvent; according to Barba et al. (2017), such increases can be favorable since they have the selective ability to extract certain thermolabile substances, but higher temperatures can be aggressive, leading to alterations in the substances or even their decomposition.
Effects of HIP on the TPC of purple corn cob extracts
Figure 2 shows the effects of HIP on TPC (mg GAE/ g dry weight), in purple corn cob extracts processed at three temperatures, as compared to the contents found in extracts obtained using CE and in non-pressurized extracts obtained at the same temperatures. Parameters such as the solvent and solid: solvent ratios were maintained constant.
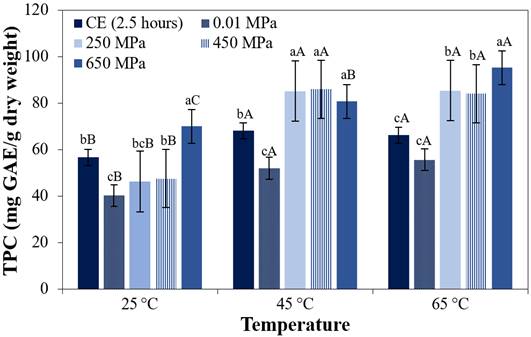
Figure 2 TPC of the extracts obtained by different processing methods at different temperatures. CE for 2.5 hours, non-pressurized at 0.01 MPa for 3 minutes and HIP (250 MPa, 450 MPa and 650 MPa) for 3 minutes. The bars are the means ± standard deviation (n = 3). Means with the same lower-case letters in the same column indicate that there is no significant difference (p > 0.05, Tukey test) between the extracts subjected to different processing methods, considering the same temperature. Different uppercase letters mean there is a significant difference (p < 0.05, Tukey test) between the different temperatures, considering the same process.
Figure 2 shows that at a temperature of 25 °C and 65 °C, the increment in isostatic pressure from 250 MPa to 650 MPa, significantly (p < 0.05) increased TPC contents by 51% and 12%, respectively. The TPC content in the extracts obtained at 650 MPa/25 °C/3 minutes was not statistically different from the TPC content of the extracts obtained by CE at 2.5 hours/45 °C (p > 0.05).
The results obtained for the TPC in the extracts were higher than those reported by Muangrat et al. (2018) and by Itthisoponkul et al. (2018). According to Dunford et al. (2010), the pressure-temperature interaction can act synergistically, since the pressure facilitates contact between the matrix and solvent, producing the extracts quicker than the conventional extraction, while an increase in temperature decreases the dielectric constant, equalizing the polarity of the solvent and the compounds, hence extracting them more easily. In the results obtained for the TAC and TPC contents in extracts obtained by high pressure technology, it can be seen that the HIP process at 450 MPa / 45 °C was efficient in increasing the extraction of TAC and TPC.
Effects of HIP on the color of the purple corn cob extracts
For the temperatures of 25 °C, 45 °C and 65 °C, increases in HIP from 250 MPa to 650 MPa did not significantly alter (p > 0.05) the values of the coordinates a * and b*, chroma (C*) or brightness (L*), obtaining extracts with tendencies between blue and red. These values were different from those reported by Monroy et al. (2016b) for Peruvian purple corn cob extracts obtained using supercritical fluids (400 bar / 50 °C / 390 minutes / three sequential extractions with SCO2, ethanol and water). For all these processes, the values obtained for h° in the extracts were in the range from 247.08° to 274.02°, and according to the CIE-L* C* hº cylindrical chromatic space system, values between 180º and 270º indicate a trend from green to blue (Padrón et al., 2012).
In vitro study of the antioxidant activities of the purple corn cob extracts obtained by HIP and CE
Table 1 shows a comparison of the antioxidant activities (AA) of the non-pressurized extracts and those obtained by HIP and CE under conditions that showed high bioactive compound contents. The AA values of the extracts were determined using the ORAC and FRAP assays and the results were expressed in μM Trolox (TE) / g dry weight in both cases.
The AA values of the extracts were determined using the ORAC and FRAP assays and the results were expressed in μM Trolox (TE) / g dry weight in both cases. Of the extracts obtained by CE, those obtained in 2.5 hours/ 65 °C showed the highest AA values according to ORAC. The extract obtained by HIP at 650 MPa / 65 °C / 3 minutes, showed high values for AA, 30% and 55% more than the extract obtained by CE in 2.5 hours/ 65 °C (p < 0.05), according to FRAP and ORAC, respectively.
The present results suggest that using high pressures can reduce the times from hours to minutes and achieve extracts with high AA values. According to Tian et al. (2018) polar antioxidant compounds have a greater reducing capacity, inferring that the AA of the extracts obtained by high-pressure technologies is due to the greater presence of phenolic compounds. The methodologies used revealed that the AA values of the purple corn cob extracts obtained by high isostatic pressure technology were significantly higher than the values in the extracts obtained by CE, results which are consistent considering that the extracts obtained using high-pressure presented higher TPC contents (Saikaew et al., 2018).
Table 1 Comparative of the antioxidant activity as determined by the ORAC and FRAP assays in the conditions of greater efficiency of the technologies
| Antioxidant Activity (μM TE/g dry weight) | |||
| Process | Variables | FRAP | ORAC |
| Non-pressurized | 0.01 MPa/25 °C/3 minutes | 312.51±11.14 e | 980.55±42.32 de |
| 0.01 MPa/45 °C/3 minutes | 480.87±41.67 de | 1222.77±74.50 bcd | |
| 0.01 MPa/65 °C/3 minutes | 753.34±16.03 abc | 1145.39±46.63 cd | |
| HIP | 650 MPa/25 °C/3 minutes | 722.48±64.32 abc | 860.82±12.86 ef |
| 650 MPa/45 °C/3 minutes | 788.60±25.64 abc | 1225.45±61.94 bcd | |
| 650 MPa/65 °C/3 minutes | 880.66±79.44 ab | 1056.43±43.35 cde | |
| CE | 2.5 hours/25 °C | 591.96±39.57 cd | 849.31±22.36 ef |
| 2.5 hours/45 °C | 509.09±44.12 de | 999.52±16.82 ed | |
| 2.5 hours/65 °C | 676.75±9.95 bcd | 682.29±21.64 f | |
* The data are presented as the means ± standard deviation (n = 3). Same letters in the column indicate that there are no significant differences among the different process conditions (p < 0.05, Tukey test).
Table 2 Areas of the chromatographic bands obtained by technology for the compounds found in the extracts of purple corn
| Peak | Compounds | CE | HIP |
| 1 | Unknown | 120026 | 172428 |
| 2 | Cyanidin-3-glucoside | 11242858 | 6593593 |
| 3 | Pelargonidin-3-glucoside | 2497220 | 1573643 |
| 4 | Peonidin-3-glucoside | 6995596 | 4349066 |
| 5 | Cyanidin-3-(6-malonylglucoside) | 7855386 | 3709423 |
| 6 | Pelargonidin-3-(6-malonylglucoside) | 3792038 | 2408920 |
| 7 | Peonidin-3-(6-malonylglucoside) | 4622761 | 2850615 |
* CE process at 2.5 hours/65 °C and HIP process at 650 MPa/65 °C/3 minutes.
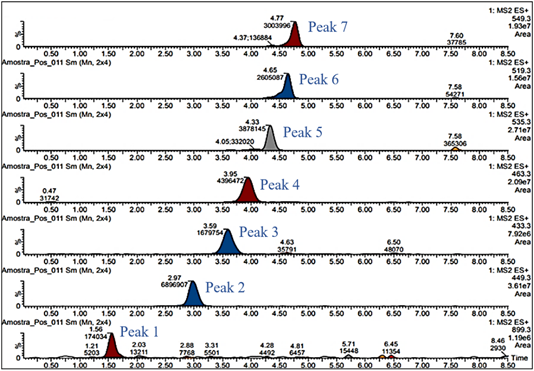
UPLC-MS/MS analysis of the anthocyanins in the purple corn cob extracts obtained by HIP and CE
UPLC-MS/MS was applied to the study of the anthocyanin compositions of the purple corn cob extracts obtained by high isostatic pressure and CE. The compounds were identified by comparing their retention times with those reported by Pascual-Teresa et al. (2002). Peak 1 may reveal the presence of a dimer formed by condensation between different flavonoids (Pascual-Teresa et al., 2002). In this study, the chromatographic profiles were similar to those found by Pascual-Teresa et al. (2002) in a commercial extract from purple corn (Figure 3).
The areas of the chromatographic bands of the anthocyanins obtained using the different extraction processes (CE and HIP) are shown in Table 2.
The presence of acyl groups in the anthocyanin molecules makes them more stable to thermal degradation than their non-acylated forms and, consequently, the extracts maintained greater color stability. According to Falcão et al. (2003), acylated anthocyanins, which have cinnamic and/or malonic acid residues esterified to sugars, and non-acylated anthocyanins can be found in samples of plant origin. Thus, the anthocyanin composition of the corn cob, as well as that of the extracts obtained, makes them a new alternative for use as natural coloring compounds and for the dyeing of foods.
4. Conclusions
The study demonstrated that the application of isostatic pressures greater than 450 MPa for 3 minutes allows obtaining purple corn cob extracts with a high content of bioactive compounds and high antioxidant activity of oxygen radical absorption capacity. The controlled synergistic effect of the isostatic pressure and temperature binomial increased the content of anthocyanins and the content of phenolic compounds by 70% and 60%, respectively, considering a temperature range of 25 °C and 45 °C, however, it significantly affects the brightness and hue angle of the samples. Based on the results, the combination of high isostatic pressure with mild thermal methods can be suggested to guarantee the highest efficiency of the extraction process of bioactive compounds in plant materials, which can be used as colorants or antioxidants in the development of functional foods.

