


 Inglés (pdf)
 Articulo en XML
 Referencias del artículo
 Enviar articulo por email
 Citado por SciELO
  Similares en
SciELO
Similares en
SciELO 
 Permalink
1. Introduction
Biostimulants are organic or inorganic products which contain bioactive substances or microorganisms that are applied to the plants to improve nutrient efficiency, increase tolerance to abiotic stress, promote plant growth and enhance the quality attributes of crops, regardless of their nutrient composition (Ben Mrid et al., 2021; Franzoni et al., 2022). These substances can be applied foliarly to the plants or such as capsules, granules, powders, and solutions to the soil (Bashir et al., 2021). Biostimulants can be derived from a variety of sources including beneficial fungi and bacteria, biopolymers, enzymes, humic and fulvic acids, inorganic elements, protein hydrolysates, plant extracts, as well as seaweed extracts (Drobek et al., 2019; du Jardin, 2015). Even so, they can be clustered in three main groups according to their source and content, including amino acid containing products, hormone containing products, and humic substances (du Jardin, 2015).
In this context, seaweed and plant extracts obtained under different processes have reported the presence of plant hormones such as abscisic acid (Górka & Wieczorek, 2017; Rivera et al., 2022), auxins (Górka & Wieczorek, 2017; Lema et al., 2023), cytokinins (Chóez et al., 2014; Górka & Wieczorek, 2017), gibberellins (Quijano-Avilés et al., 2018; Rivera et al., 2017, 2022), among others. These natural compounds known as plant growth regulators, for example, abscisic acid (ABA), 3-indolacetic acid (IAA), kinetin (KIN), trans-zeatin (tZ), gibberellic acid (GA), jasmonic acid (JA), and salicylic acid (SA) act in low concentrations in different plant physiological processes, to mediate growth development, and response to biotic and abiotic stress caused by living organisms or environmental factors such as pathogens, drought, salinity, and temperature variations (Barbosa et al., 2024; EL Sabagh et al., 2022; Guillén et al., 2022; Gupta et al., 2024; Shahzad et al., 2024). ABA is involved in stomatal closure, seed germination, and it is mostly recognized for its ability to mediate responses to abiotic and biotic stress (Pan et al., 2020). IAA stimulates stem growth and inhibits the growth of lateral branches (Tarkowská et al., 2014). Gibberellic acid GA3 is the most common gibberellin (Kwon & Paek, 2016), and it participates during seed germination, stem elongation and the beginning of flowering (Camara et al., 2018).
To our knowledge, several studies focus on the individual and simultaneous determination of phytohormones in different matrices have been established using high performance liquid chromatography (HPLC) (Nakurte et al., 2012; Nhujak et al., 2005; Rivera et al., 2020; Spagnuolo et al., 2022; Wu & Hu, 2009), liquid chromatography with tandem mass spectrometry (LC-MS-MS) (Yang et al., 2022), capillary electrophoresis coupled to mass spectrometry (CE-MS) (Tan et al., 2014), as well as capillary electrophoresis coupled to a diode array detector (CE-DAD) (Chen et al., 2018; Huang et al., 2014; Nhujak et al., 2005; Quijano-Avilés et al., 2018; Yang et al., 2016). Furthermore, most of the procedures require sample preparation steps such as solid-liquid extraction, solid-phase extraction (SPE), supercritical fluid extraction (SFE), liquid-phase microextraction (LPME), ultrasound-assisted extraction (UAE), dynamic sonication-assisted solvent extraction (DSASE), among other techniques. Nevertheless, specific methods for the determination of phytohormones containing carboxyl groups in biostimulants products using CE-DAD have not been reported.
Therefore, the aim of this work was to develop and validate a method for the simultaneous separation and determination of ABA, IAA, and GA3 in commercial plant biostimulants using CE-DAD.
2. Methodology
2.1. Standards and chemicals
Boric acid, sodium hydroxide, and hydrochloric acid were acquired from J.T. Baker (Deventer, Netherlands). Ethyl acetate reagent grade was obtained from Fisher Scientific (Hampton, USA). Phytohormone standards ABA (purity 99%), IAA (purity 98%), and GA3 (purity 90%) were purchased from Sigma-Aldrich (Missouri, USA). HPLC-grade methanol was acquired from Merck (Darmstadt, Germany). A Milli-Q water purification apparatus Millipore (Bedford, USA) was used to obtain ultrapure water.
2.2. Sample processing
According to Table 1, different commercial biostimulant products based on plant and seaweed extracts were used for the experiments. An aliquot of biostimulant was taken to pH 3 using 1 N hydrochloric acid or 1 M sodium hydroxide followed by liquid-liquid extraction using ethyl acetate (1:3 v/v). The extraction process included orbital shaking at 120 rpm for 1 hour. Then, the organic phase was separated and concentrated until dryness in a rotary evaporator Heidolph (Schwabach, Germany) under reduced pressure at 45 °C. The dried extract was redissolved in HPLC grade methanol and filtered through 0.22 μm nylon syringe filters prior to injection (Figure 1). This procedure was performed by triplicate for each commercial product.
Table 1 Description of commercial plant biostimulant products
| Commercial biostimulants | Description |
|---|---|
| Product 1 | Black liquid based on seaweed extracts. Composition: macro and microelements, hu mic acids, auxins, gibberellins and cytokinins. |
| Product 2 | Brown liquid based on plant extracts. Composition: microelements, indoleacetic acid, gibberellins, zeatin, thinners and conditioners. |
| Product 3 | Opalescent liquid based on plant extracts. Composition: cytokinins. |
2.3. Preparation of stock, standard solutions, and calibration curves
For the preparation of stock solutions, 5 mg of each phytohormone standard was separately transferred into a 5 mL volumetric flask and dissolved with HPLC-grade methanol to get concentrations of 1000 μg/mL. These stock solutions were stored under refrigeration at -17 °C. The mixture of the 3 compounds within the linearity ranges (10 - 100 μg/mL) were prepared by transferring adequate volumes of each stock solution into a series of 5 mL volumetric flasks and completed to final volumes with HPLC-grade methanol. The standard mixture of phytohormones was injected in triplicate under the CE conditions, and the obtained peak areas were used to plot calibration curves. All solutions were prepared with HPLC-grade methanol previously filtered through 0.22 μm nylon membrane disc filters and sonicated at 35 kHz in an ultrasonic water bath VWR (Pennsylvania, USA) to remove air bubbles prior to injection.
2.4. Instrumentation and CE conditions
A capillary electrophoresis (7100 CE system) Agilent Technologies (Waldbronn, Germany) equipped with a diode array detector (DAD) was used. CE separation was performed in a fused-silica capillary Agilent Technologies (California, USA) with a total length of 72 cm, an effective length of 62 cm, and an internal diameter of 50 μm. CE analysis was done using a background electrolyte (BGE) solution consisting of borate buffer (50 mM, pH 9.3). Samples were injected at the anodic side of the capillary by applying a high voltage of 20 kV, and a pressure of 50 mbar for 35 s. The running voltage was 30 kV, and the cassette temperature was 25°C. Phytohormones detection was performed at the cathodic side using the DAD operating at selected wavelengths of 254, 220, and 195 nm for the detection of ABA, IAA, and GA3, respectively (Figure 1). In order to improve the electrophoretic separation and increase the absorption response of phytohormones, different values of applied voltage, and time during injection as well as detection wavelengths were tested. The voltage was evaluated within the range of +10 kV to +30 kV by applying hydrodynamic injection at 50 mbar within the range of 5 to 35 s. Furthermore, preconditioning and postconditioning steps were programmed for each sample run using 0.1 M sodium hydroxide for 2 min, ultrapure water for 3 min, and BGE solution for 5 min as preconditioning, as well as 0.1 M sodium hydroxide for 2 min, and ultrapure water for 8 min as postconditioning. Prior to sample injection, the capillary was washed with 0.1 M sodium hydroxide for 10 min, followed by ultrapure water for 20 min, conditioning with BGE solution for 10 min, and the injection of a blank sample to stabilize the cassette temperature. Finally, data processing was performed in Agilent ChemStation software.
2.5. Method Validation
The proposed method was validated according to the ICH (International Conference Harmonisation) guidelines. Specificity, linearity, limit of detection (LOD), limit of quantification (LOQ), accuracy, and precision were the parameters validated (Figure 1).
Specificity was demonstrated by comparison of a sample blank (a commercial product which does not contain the analytes of interest), the standards of phytohormones, and the solvent blank (HPLC grade methanol). Linearity was evaluated in the concentration range of 10-100 μg/mL for the 3 compounds, and calibration curves were constructed using 8 different points. LOD and LOQ of the 3 compounds were calculated based on a signal to noise (S/N) ratio of 3: 1 for LOD and 10: 1 for LOQ. Method accuracy was determined by spiking the sample blank with known concentrations of the mixture of standard solutions within the assessed concentration ranges at 3 different levels (low, medium, and high). The concentrations used were 10, 55 and 100 μg/mL.
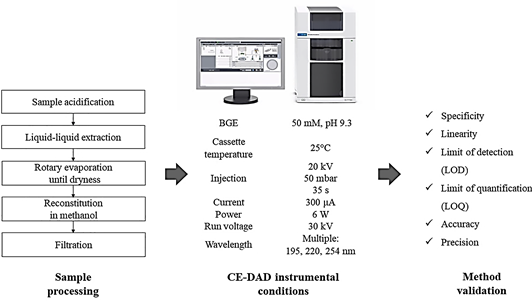
Figure 1 Schematic representation of sample processing and method validation steps for analysis of abscisic acid, 3-indolacetic acid and gibberellic acid in commercial plant biostimulants by CE-DAD.
Thereafter, the sample preparation procedure was carried out, and the spiked samples were injected into the CE system. Method precision was evaluated by analyzing the spiking samples. The peak areas by triplicate on the same day were used for intraday precision, and the peak areas for 3 consecutive days were used for interday precision.
3. Results and discussion
3.1. Optimization of CE conditions
3.1.1. Effect of applied voltage, and injection time
After runs, it was determined that the optimum voltage for the separation and detection of phytohormones was 20 kV by applying hydrodynamic injection of 50 mbar for 35 s. These conditions resulted in a good peak shape, response, and resolution of the three compounds. Previous studies indicated that a combination of high voltages with short injection times reduced the migration time of compounds avoiding capillary breakage (Quijano-Avilés et al., 2018). However, in the present study, the combination of voltage and injection time with the other proposed CE parameters revealed larger absorption responses. In fact, the optimal conditions were adequate to prevent overlapping of the first compound (KIN) with the front of the chromatogram.
3.1.2. Selection of detection wavelengths
Regarding the absorption spectra of the phyto-hormones, Figure 2. illustrates the electro-pherograms of standard compounds at different wavelengths. Maximum absorbances were recorded simultaneously at 254, 220, and 195 nm for ABA, IAA, and GA3, respectively. At these wavelengths, good peak symmetry, response and resolution were observed. KIN (purity 99%) was considered during the preparation of the standard mixture of phytohormones. It showed absorption response at the established wavelengths, but it was not validated.
3.2. Method Validation
3.2.1. Specificity
After runs, good separation between the three compounds was observed, and no elution of peaks capable of causing interference (Figure 2). Also, the spectral peak of each compound was compared with spectra reported in the literature (Carić et al., 2004; Kim et al., 2017; Quijano-Avilés et al., 2018), demonstrating the specificity of the method. No further procedures were required for identification since no interference was caused by the sample blank.
3.2.2. Linearity
The regression parameters including correlation coefficient (r), determination coefficient (r2), intercept and slopes are shown in Table 2. Other statistical parameters such as F, and significance F were also calculated. High F values suggested steeply ascending regression lines, and correlation coefficient (r) values ≥ 0.9960 indicated high degrees of linearity (Maher et al., 2019).
3.2.3. Limit of detection (LOD) and limit of quantitation (LOQ)
The estimated LOD and LOQ values are shown in Table 2.
3.2.4. Accuracy
The obtained peak areas were replaced in the regression equations individually to get the actual concentration and percentages of recovery of each spiked sample. The results demonstrated a % recovery among 70%-120%, which implies a good degree of method accuracy as suggested by the Official Methods of Analysis of AOAC International (Bruce et al., 1998).
Table 2 Regression and statistical parameters for the simultaneous determination of ABA, IAA, and GA3 using CE-DAD
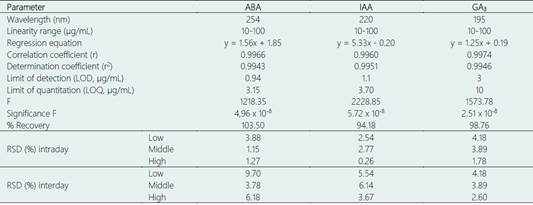
ABA: abscisic acid, IAA: 3-indolacetic acid, GA3: gibberellic acid GA3. RSD: Relative standard deviation.
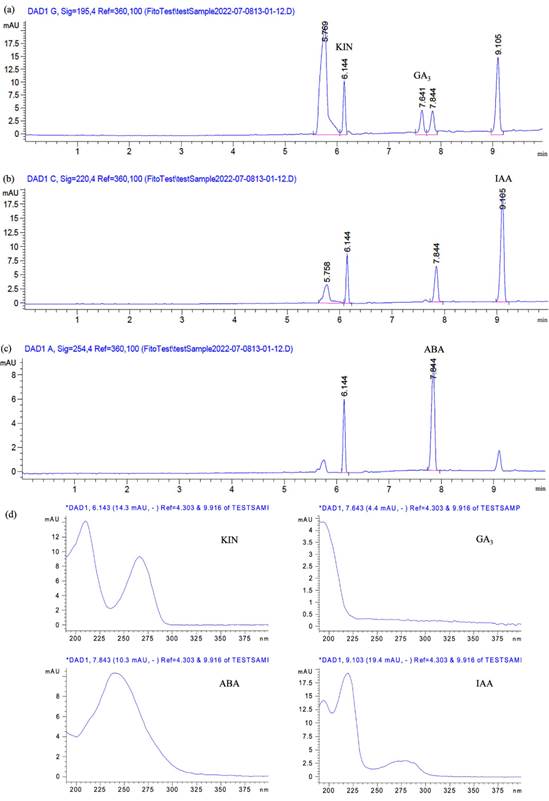
Figure 2 Electropherogram of the standard mixture of phytohormones containing 10 µg/mL of KIN, GA3, IAA, and ABA which were detected at 195 ηm (a), 220 ηm (b), 254 ηm (c), and their corresponding absorption spectra (d), using BGE of 50 mM borate buffer (pH 9.3) 20 kV, 50 mbar, 35 s, 25 °C.
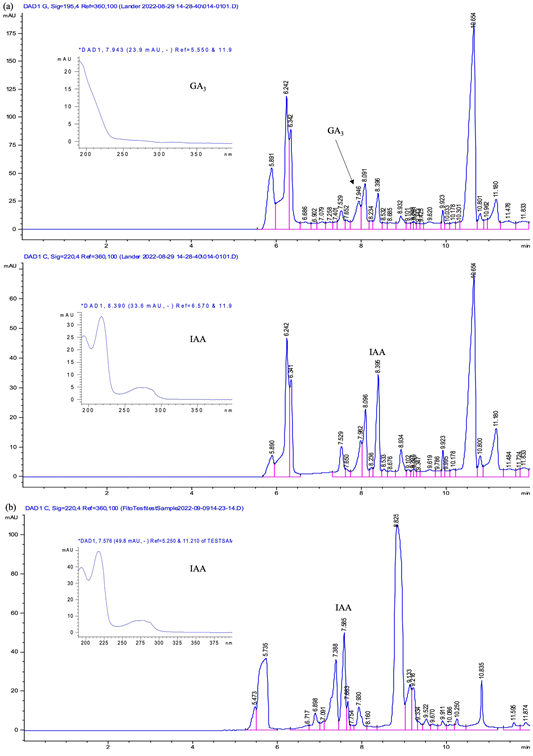
Figure 3 Electropherogram of GA3 and IAA detection in commercial plant biostimulant product 1 (a) and product 2 (b) by CE-DAD using BGE of 50 mM borate buffer (pH 9.3), 20 kV, 50 mbar, 35 s, 25 °C.
3.2.5. Precision
Intraday precision (repeatability) and interday precision (intermediate precision) were expressed as relative standard deviation (RSD). The obtained %RSD values can be seen in Table 2 and suggest a satisfactory degree of method precision in both cases (Della Betta et al., 2014).
3.2.6. Application to commercial biostimulants
The samples of biostimulants were analysed under the optimized CE conditions. The method allowed to determine the phytohormones with specificity, accuracy, precision, and linearity in the range 10 to 100 μg/mL. The detection of assessed compounds altogether was achieved within 9 minutes, and they were confirmed by comparison of their corresponding UV absorption spectral as illustrated in Figure 3. As expected, GA3 was detected in product 1 while IAA was detected in product 1 and 2. Differences of migration time among standard compounds and samples could be related to sample matrices which can contain interfering substances that affect analyte migration (Masár et al., 2020). ABA was not detected in any of the evaluated commercial products since it was not described in the chemical composition labels of the plant biostimulant products. CE methods for the quantification of ABA, and GA3 in different matrices have been validated individually, demonstrating comparable sensitivity results and short analysis time (Liu et al., 2003; Quijano-Avilés et al., 2018). Nevertheless, similar findings of validation using capillary electrophoresis-ultraviolet (CE-UV) has been described for the multiple detection of phytohormones including ABA, IAA, and GA3 in plant tissue samples. A good peak separation was reached after a fast extraction procedure (Assunção et al., 2009). In contrast, another study conducted with fruit and vegetable extracts has reported outstanding validation results for the plant hormones. However, the high sensitivity achieved by the CE-UV method required an extensive sample preparation step to remove matrix interferences (Huang et al., 2014).
Notably, the present work employed liquid-liquid extraction with ethyl acetate after pH adjustment, which allowed the separation and detection of IAA and GA3. This technique based on the exchange of plant growth regulators among organic solvents and the acidified samples was previously proposed for the extraction and quantification of cited compounds in seaweed extracts by electrospray ionization mass spectrometry (ESI-MS) as well as HPLC (Prasad et al., 2010).
Advantageously, the phytohormones containing carboxyl groups were detected in biostimulants samples using CE-DAD after this simple extraction method avoiding the employment of expensive and non-conventional sample preparation techniques as well as purification processes. These results indicate that the established procedure is appropriate for quantification of ABA, IAA, and GA3 in commercial plant biostimulants as a method for assessing product quality.
4. Conclusions
This work developed an effective CE-DAD method for the simultaneous quantification of the phytohormones containing carboxyl group ABA, IAA, and GA3 in commercial biostimulants. A straightforward sample preparation step was necessary to detect more than one compound in a single run using different wavelengths. Therefore, the validated method could be used as a low-cost and fast alternative procedure instead of performing individual determination of phytohormones using expensive analytical techniques, purification steps, and a non-conventional extraction process.

