


 Inglés (pdf)
 Articulo en XML
 Referencias del artículo
 Enviar articulo por email
 Citado por SciELO
  Similares en
SciELO
Similares en
SciELO 
 Permalink
INTRODUCTION
Many societies consider alcohol consumption to be part of their identity or culture (Andrade, 2021). As a chronic disease that leads to behavioral disturbances that persist during abstinence, it also interferes with physical, mental, social, and familial health (Díaz & Calderín, 2020). At the same time, Mondragón-Maya et al. (2021) discuss the pattern of excessive alcohol consumption, which is influenced by the number of drinks consumed and gender, it is mentioned that when men exceed five drinks and women exceed four, they exhibit Excessive Alcohol Consumption (EAC), if this consumption occurs once a month with periods of abstinence, as Chung et al. (2018) note, we could be talking about potential excessive alcohol consumption.
Reports from international public health organizations show alarming data regarding excessive alcohol consumption. The World Health Organization (WHO, 2021) stated that “283 million people live with alcohol use disorders, of which 237 million are male and 46 million are female, noting that alcohol consumption begins as early as 14 years old”. The Panamerican Health Organization (PHO, 2020) in the Regional Situation Report on Alcohol and Health in the Americas, indicated: "Excessive alcohol consumption is responsible for 200 diseases, injuries, trauma, neoplasms, HIV/AIDS infections and various mental disorders." In the region of Puno, the onset of alcohol consumption is early; the National Institute of Statistics and Informatics (NISI, 2021) reported an increase in alcohol consumption starting at the age of 15 years old.
From the Transtheoretical Model, “which aims to describe the change process as a variant composed of a series of transitions or stages” (Rondón & Reyes, 2019), there is an innovative proposal in health promotion and disease prevention, as it provides opportunities for specific interventions in the population targeted by the actions (López, 2020). Initially, the Transtheoretical Model of change is established as the primary theoretical basis for the development of the scale due to its inclusion in the addiction psychotherapy system. Furthermore, in the field of addiction behavior treatment (Prochaska & DiClemente, 2005), motivation for change is considered a key element in overcoming each part of the change process, with stages detailed as pre-contemplation, contemplation, preparation, action and maintenance; these stages describe how the person recognizes the presence of a health problem. There is a solid explanatory theoretical foundation, but it lacks internal consistency when evaluating these stages through a questionnaire (Fahrenwald & Walker, 2003; Matsumoto & Takenaka, 2004), as Rosen (2000) mentioned in his meta-analysis to analyze the relationship between the stages and change processes, revealing that cognitive and behavioral factors do not influence the same way in each stage, this is the main criticism of the theoretical model; therefore, it is decided to structure those cognitive change processes in the early stages: pre-contemplation, contemplation, and preparation in the behavioral change processes in the action and maintenance stages.
From the reports presented, it is evident that excessive alcohol consumption brings with it a range of challenges; in the psychological realm, we are faced with the responsibility of establishing new theoretical-explanatory approaches to provide treatment for alcoholism. Prior to this, it is necessary to have tools that allow us to understand how the cognitive-behavioral change process is progressing in relation to this condition, so that we can have a preliminary diagnosis to guide and adapt the sessions to the patient’s needs. To contribute to knowledge, a scale will be designed that meets optimal indicators of content validity, construct validity, and reliability, which, through its items, will allow the identification of the level of awareness regarding excessive alcohol consumption and the behavioral changes the person exhibits to break this harmful habit.
METHODS
Design
The research has a non-experimental, psychometric, and cross-sectional design, since data collection took place over a period without manipulation of the variable. The quantitative research method was used using statistical models that typify the scale (Hernández et al., 2014).
Participants
A non-probability snowball sampling method was used for the sample due to the difficulty in identifying participants who met the inclusion criteria, which were: being over 18 years old, having consumed alcoholic beverages five or more times in the past month, and providing informed consent for voluntary participation. It is worth noting that once a participant was identified, they were asked about their social circle and the possibility of identifying other individuals who consumed alcoholic beverages before proceeding with the search for additional participants.
For the exploratory factor analysis, a sample of 300 participants was established; however, stratified sampling was not considered due to the complexity of identifying potential participants. While the sample for the confirmatory factor analysis was delimited with the Sample Size Calculator (web) for structural equation modeling (Kim, 2005) considering the Confirmatory Factor Analysis - Root Mean Square Error of Approximation (RMSEA) considering expected RMSEA values of 0.05, a significance level of 0.01, a sample power of 95% and a loss rate of 20% for 20 items and 2 factors, resulting in a sample of 260 (Arifin, 2024), corroborated with the "Structural Equation Models" of Arrogante (2018) where to have a significant sample the number of items must be multiplied by 20, we see that our sample of 479 for the CFA exceeded both sample calculations.
Instruments
The scale is based on the transtheoretical model of change (SRCAA) in people with alcoholism problems, of Peruvian origin, in order to assess the phase of change in which an individual is who shows signs of apparent abuse in alcohol consumption from cognitive-behavioral, the resolution of the scale can take up to 20 minutes at most and the way of giving an answer is given by a Likert scale that varies from Almost Never = 1, Once in a while = 2, Sometimes = 3, Frequently = 4 and Almost Always = 5, consists of 19 items and two dimensions; cognitive (contemplation) and behavioral (preparation, action and maintenance), the age for its application is from 18 years. The scale guarantees its validation through a statistical analysis according to its validity and reliability. To carry out convergent validity, a 7-item anxiety scale (GAD-7) was applied, considering a Likert rating scale that ranges from not at all = 0, some days = 1, more than half the days = 2, almost every day = 3. Where scores 0-5 refer to a mild level, 6-10 moderate level, 11-21 severe level of anxiety symptoms. The scale has excellent internal consistency (Cronbach α = .92) and good test-retest reliability (intraclass correlation = 0.83) (Spitzer et al, 2006).
Procedure
For the execution of the project in the first phase, the degree of content validity of the items was evaluated by the evaluation of seven expert judges, who have 3 years of experience in the clinical psychological treatment of patients with alcoholism. In the second phase, permits were coordinated in five health centers that had patients with the F10 diagnosis. Alcohol-related disorders as mentioned in the International Classification of Diseases (World Health Organization, 1992), was applied to the general public who voluntarily responded to the scale, and was also applied only to individuals who responded affirmatively to the filter question "Have you consumed alcohol more than five times during the last month?" This process was carried out with the help of 3 interviewers, data collection was done through physical surveys, between May and August of this year, informed consent and instructions were detailed to solve the scale by asking them to respond as sincerely as possible, since they are guaranteed confidentiality and the degree of anonymity, by not asking for the name and data that exhibit the identity of the respondent.
Data Analysis
The data obtained through the application of the scale were processed in a rigorous manner in specialized software to optimize the statistical analysis; Jamovi, JASP. 0.18.3. and Microsoft Excel were used. The first analysis of content validity was carried out to find V-Aiken Analytics of expert responses, considering 7 expert judges with 3 years' previous experience in the clinical treatment of alcoholic patients. This process was analyzed through an Excel spreadsheet made by Ventura-León (2019). As a result, the validity of only 20 items with adequate indicators of relevance, representativeness, and clarity is observed.
Afterwards, the cleaning of those surveys with atypical values was developed to begin the analysis based on statistical models. Once a clean database was obtained, descriptive analyses were carried out, where the numerical variables presented measures of central tendency and dispersion, as well as the estimation of asymmetry and kurtosis where a value (g1, g2 < ±1.5) was considered to have a normal distribution; while for the categorical variables, absolute and relative frequencies were estimated (Bonett & Price, 2015).
For construct validity in exploratory factor analysis, the Kaiser-Meyer-Olkin test was applied, considering a KMO > 0.5 (Montanero, 2008), and Bartlett's sphericity contrast with a p < 0.05 indicated the presence of latent factors in the construction proposal (Everitt & Wykes, 2002). To verify the factor weights and the presence of factors, the maximum likelihood method and varimax rotation were used to verify the factors. The factors are also identified by means of the sedimentation graph (Mavrou, 2015, Kaiser, 1958). Items with factor loadings of λ < 0.40 were removed (López-Aguado & Gutiérrez-Provecho, 2019), as well as those with high polychoric correlation coefficients (r > 0.80) and those with a uniqueness value of θ > 0.70 (Ramos-Barberán & Plata-Alarcón, 2015).
Subsequently, the confirmatory factor analysis was performed, verifying the goodness-of-fit values with the WLSMV estimator, where the goodness-of-fit indices such as the CFI and TLI were estimated, which for an adequate fit must present values > 0.90 and the SRMR and RMSEA values < 0.08; Likewise, SEM Modeling was performed to obtain the factor loadings of the construct (Schermelleh-Engel et al, 2003). It is worth mentioning that high residual error was also considered a criterion for item elimination.
To estimate the internal consistency of the scale and its dimensions, Cronbach’s Alpha and McDonald's Omega coefficients were estimated (Elosua-Oliden & Zumbo, 2008) where values > 0.70 indicated reliable factors.
Finally, for external validity based on the relationship between variables, associations were estimated using Spearman’s Rho correlation (Campbell & Fiske, 1959), comparing SRCAA scores by dimension with GAD-7 scores to determine external validity based on relational evidence.
Ethical Considerations
The research was analyzed and approved by the Ethics Committee of the University Peruvian Unión (2021) with report number 2024-CEB-FCS - UpeU-067. Furthermore, the ethical principles of research involving human subjects of the Declaration of Helsinki (World Medical Association, 2024) were adequately complied with in the process of this research, such as the use of informed consent.
RESULTS
Descriptive analysis
In Table 1, it is observed that the AFE sample consisted of n=300 participants with an average age of 38 years, of which the majority, 193 (64.3%), were male, 292 (97.4%) reported having higher education, 107 (35.7%) were single, and 232 (77.3%) stated that they had never sought help from a psychologist. On the other hand, the AFC sample was made up of n=497 participants with an average age of 34 years, of which 309 (62.2%) were male, 448 (90.2%) indicated having higher education, 237 (47.7%) were single, and 370 (74.4%) had not sought psychological help.
Table 1 Characteristics of the population at risk of alcohol consumption.
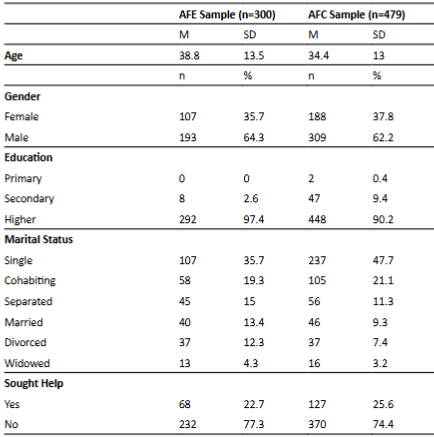
Note: SD = Standard deviation, AFE Sample = Sample for exploratory factor analysis, AFC Sample = Sample for confirmatory factor analysis.
Content Validity
In Table 2, the indices from Aiken’s V by item are shown. The scores for the precontemplation dimension range from 0.43 to 0.67, indicating that none of its items have relevance, representativeness, or clarity, thus allowing us to eliminate them from the scale. On the other hand, items with acceptable values are considered, where the indicators range from 0.81 to 1.0, showing high relevance, representativeness, and clarity, and should be kept on the scale. In the contemplation dimension, items 16, 17, 19, 20, and 21 remain, for the preparation dimension, items 24, 26, 27, 29, and 30, for the action dimension, items 33, 34, 37, 38, and 39, and finally, for the maintenance dimension, items 41, 42, 44, 45, and 46 remain. Thus, 27 items were eliminated for failing to meet the criteria for each dimension, leaving 20 items in the scale with optimal indicators that adequately describe the theoretical model. Furthermore, modifications were made to some valid items to make them clearer, according to the observations from the expert judges. Item 20, which originally said, "People who care about me will support me in quitting drinking" was changed to "I know that people who care about me will support me in quitting alcohol, but I doubt I will succeed," and item 46, "I have managed to stay away from alcohol and will make an effort to keep it that way" was replaced with "I have managed to stay away from alcohol because of the new activities I continue to pursue."
Table 2 Content validity based on Aiken’s V by items.
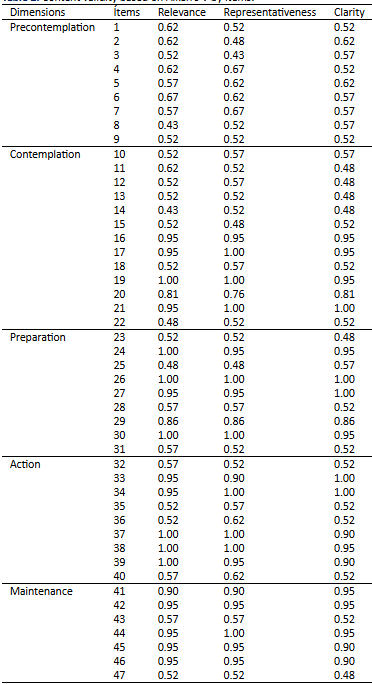
Note: The validity indices are determined through Aiken’s V, with the participation of 7 expert judges.
Exploratory Factor Analysis
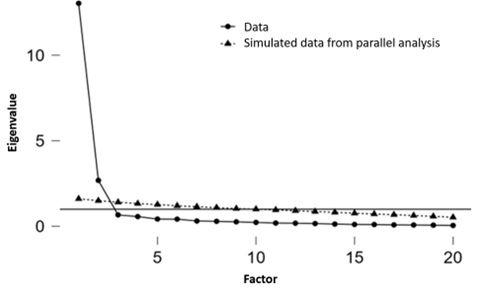
In Table 3, the final version of the 20 items was used for the Kaiser-Meyer-Olkin test and Bartlett's sphericity test (KMO = 0.96, p < 0.01), confirming the presence of two factors based on the variables included, with factor loadings ranging from (λ = 0.62 - λ = 0.94), obtained using the maximum likelihood method and a varimax rotation. This indicates that theoretically, the items form two factors. Figure 1 of the scree plot shows the relationship between the eigenvalues and the extracted factors in the exploratory factor analysis, indicating the presence of two latent factors.
Table 3 Factor structure of the scale. Descriptive analysis of the items in the SRCAA.
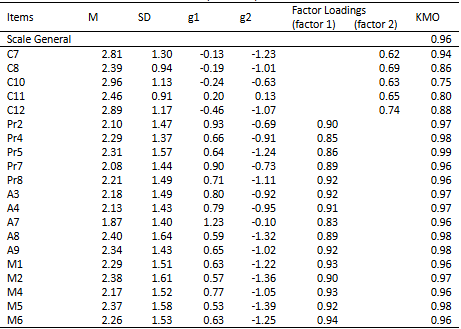
Note:M = Mean, SD = Standard deviation, g1 = Skewness, g2 = Kurtosis
Confirmatory Factor Analysis
The two-factor model, after the removal of item C11, showed better and more appropriate goodness-of-fit values for the SRCAA (CFI = 0.987; TLI = 0.985; SRMR = 0.073; RMSEA = 0.077). Thus, the decision was made to adopt this model (Table 4). The reason for removing item C11 was its low factor loading in the CFA (e.g., in SEM modeling), which was λ = 0.24, along with a high residual error. After removing this item, the factor loadings ranged from λ = 0.39 to λ = 1.05 (Figure 2).
Table 4. Model Fit Indices with WLSMV Estimator for the SRCAA with two factors.
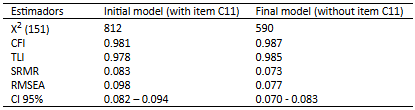
Note: X² (df >) for the model versus base, CFI = Comparative Fit Index, TLI = Tucker-Lewis Index, SRMR = Standardized Root Mean Square Residual, RMSEA = Root Mean Square Error of Approximation, CI = Confidence Interval.
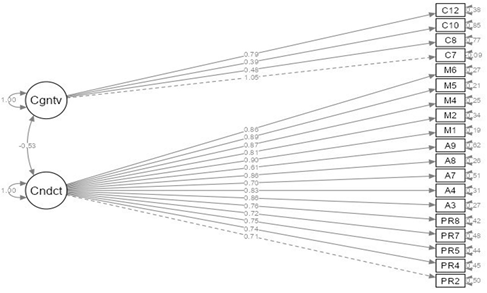
Figure 2 shows the final model where the factor and the items it comprises are displayed. The findings show that in the relationship between factors and items, no standardized estimators are below 0.39. Additionally, an inverse covariance between the factors is observed, which would explain their difference rather than their complicity, thus corroborating the theoretical foundation proposed.
Reliability
Regarding the reliability of the SRCAA, good reliability (> 0.70) was reported for both factors based on the internal consistency reliability indices, using Cronbach’s Alpha (α) and McDonald’s Omega (ω). The results show that the Cognitive Factor has good reliability (Cronbach’s Alpha (α) = 0.805; McDonald’s Omega (ω) = 0.801), and similarly for the Behavioral Factor (Cronbach’s Alpha (α) = 0.963; McDonald’s Omega (ω) = 0.962). This determined that the instrument has good reliability.
Convergent validity
Regarding convergent validity, based on the relationship with other variables, a Spearman’s Rho correlation was estimated between the global score and the dimensional scores of the SRCAA and the GAD-7, which assesses generalized anxiety. A direct and moderate correlation (Rho = 0.380; p = 0.000) was found between the cognitive factor and GAD-7, an inverse and strong correlation (Rho = -0.690; p = 0.000) between the behavioral factor and GAD-7, and an inverse and strong correlation (Rho = -0.670; p = 0.000) between the SRCAA and GAD-7. In the cognitive factor, it is noted that if the individual is not aware of their alcoholism, anxiety symptoms increase. Meanwhile, in the behavioral factor, it is understood that if the participant has strategies to cope with alcoholism, the anxiety symptoms decrease.
DISCUSSION
As the first version of the Readiness to Change Scale in a population of people with alcoholism problems, the scale showed adequate fit for a bifactor model. The EFA indicates the presence of two latent factors and 20 items; however, the CFA offers a two-factor model with 19 items with optimal fit and acceptable reliability for use in this population.
In this research study, regarding the statistical findings, five factors with a total of 47 items were initially proposed for the scale. However, the results of the Aiken’s V statistical analysis, which aims to quantify the degree of agreement among judges regarding the relevance of the items and their correspondence with their respective factors (Pedhazur & Schmelkin, 1991), showed that 27 out of the 47 initial items did not meet the established criteria, such as relevance, representativeness, and clarity. For this reason, the scale was reduced to 20 items. Therefore, it is appropriate to mention that the elimination of certain items was carried out based on the criteria proposed by Polit and Beck (2017), who state that items with an Aiken’s V value below 0.70 should be modified or removed. In the scientific literature, the study Psychometric Analysis of the Alcohol Use Disorders Identification Test (AUDIT) in Peruvian University Students includes a sample of individuals aged between 18 and 51 years, both male and female. The results of this analysis indicate that all items of the questionnaire were well-received by the evaluators, except for items 2, 4, 5, and 9, which showed discrepancies regarding the clarity of the questions. However, the validity of these items was confirmed, as their Aiken’s V validity index reached a value of 0.80, which is considered acceptable (Colán & Rosario, 2022).
Secondly, through Exploratory Factor Analysis (EFA), the presence of two latent factors and 20 items with adequate factor loadings is confirmed. Similarly, several items showed a low correlation load towards their respective factors (precontemplation, contemplation, preparation, action, and maintenance), leading to the identification of two latent factors: cognitive and behavioral. On the other hand, a study conducted by Wild et al. (2019) on the Abstinence-Related Change Readiness Scale (AACRS) initially proposed five factors based on the principles of the Transtheoretical Model of Change (TMC). However, due to the results of the EFA, it was determined that two of the factors should be combined, resulting in four final factors with scores greater than 0.65, indicating the strength and direction of the relationship between each item and its corresponding factor. Similarly, a review of scientific literature, particularly the work of Rosen (2000), suggests that better results are obtained when this model is applied with only two factors: cognitive processes and behavioral processes. Additionally, a study titled "Design of Two Questionnaires to Evaluate Relapse and Recovery in Risky Alcohol Consumption" analyzed a population of individuals aged 18 to 35 in Bogotá, Colombia. In this study, the Recovery Predictors Questionnaire was analyzed after the purification process, consisting of 32 items. The results indicated that the sample adequacy test (KMO = 0.73) and Bartlett’s test of sphericity (p < 0.00) confirmed the suitability of performing the analysis. Similarly, for the Relapse Predictors Questionnaire, the values obtained were also KMO = 0.73 and p < 0.00 in Bartlett’s test of sphericity, indicating that the results were adequate (Vargas et al., 2022).
Third, a two-factor model showed adequate fit. However, upon removing item C11 (λ = 0.24), improvements were observed in the Comparative Fit Index (CFI = 0.987), suggesting that the model adequately represents the relationships between the observed variables and fits the sample (Sebnem et al., 2020; Lai, 2020). The Tucker-Lewis Index (TLI = 0.985), where values above 0.95 are generally considered optimal (Escobedo et al., 2016), and the Standardized Root Mean Squared Residual (SRMR = 0.073), which indicates minimal differences between observed and model-predicted covariances, suggest an optimal fit (Sebnem et al., 2020). Furthermore, the Root Mean Squared Error of Approximation (RMSEA = 0.077) suggests that the model demonstrates an acceptable fit (Sebnem et al., 2020). Consequently, it can be concluded that the model with two factors and 19 items (CFI = 0.987; TLI = 0.985; SRMR = 0.073; RMSEA = 0.077) provides superior results. Similarly, in the study by Colán and Rosario (2022), the AUDIT questionnaire showed adequate fit indices for a three-dimensional model, with the following values: RMSEA < 0.07, SRMR > 0.08, CFI > 0.95, and TLI > 0.95. On the other hand, the Recovery Predictors Questionnaire presented the following indices: RMSEA < 0.067, CFI > 0.943, and TLI > 0.934. Regarding the Relapse Predictors Questionnaire, the obtained indices were: RMSEA < 0.052, CFI > 0.905, and TLI > 0.886. Consequently, it can be concluded that the questionnaires demonstrate a good fit (Vargas et al., 2022).
Fourth, regarding the reliability of the two-factor version of the scale; the cognitive factor (Cronbach’s Alpha = 0.805; McDonald’s Omega = 0.801) and the behavioral factor (Cronbach’s Alpha = 0.963; McDonald’s Omega = 0.902) demonstrate that the instrument exhibit's good reliability. Specifically, for the omega coefficient, values between 0.70 and 0.90 are considered acceptable (Campo & Oviedo, 2008). Similarly, Cronbach’s Alpha values ranging from 0.70 to 0.90 indicate strong internal consistency, suggesting that the instrument is reliable in measuring consistently across different situations and/or populations (Oviedo & Campo, 2005). In a similar study, the AUDIT questionnaire showed adequate reliability values, with a coefficient of 0.86 for Cronbach's alpha and 0.87 for McDonald's coefficient (Colán and Rosario, 2022). In other studies, such as that of Vargas et al. (2022), the following values were reported for the Relapse Predictors Questionnaire: Cronbach's alpha for all items was 0.71, while McDonald's Omega coefficients ranged from 0.53 to 0.77. Regarding the Recovery Predictors Questionnaire, Cronbach’s alpha value for all items was 0.98, and McDonald's Omega coefficients ranged from 0.970 to 0.972, reflecting excellent internal consistency.
Regarding convergent validity, Yang & Mindrila (2020) suggest that various instruments should be compared to determine the level of correlation. Accordingly, Spearman’s Rho correlation was estimated between the total score and the subscale scores of the SRCAA scale and the GAD-7, which assesses generalized anxiety. A moderate positive correlation (Rho = 0.380; p = 0.000) was found between the cognitive factor and the GAD-7, a strong negative correlation (Rho = -0.690; p = 0.000) between the behavioral factor and the GAD-7, and a strong negative correlation (Rho = -0.670; p = 0.000) between the SRCAA and the GAD-7. Regarding the literature review, it was found that García et al. (2016) conducted a study on the validity of the Alcohol Use Disorders Identification Test (AUDIT), in which convergent validity was assessed by considering the Alcohol Use Disorders Identification Test - Consequences (AUDIT-C) and the Alcohol Use Disorder Severity (AUDIT). The results revealed a significant correlation, suggesting that the scales measure the same construct.
Limitations and Strengths
Regarding the limitations identified during the research, there are two key aspects: First, the study was conducted with individuals over the age of 18, which limits the generalizability of the findings to minors who engage in excessive alcohol consumption, compounded by the limited accessibility to the population due to potential cognitive avoidance present in the sample. Secondly, there is a shortage of addiction specialists within our region. Thirdly, the literature review revealed a scarcity of studies adapted to our specific context. It is also worth noting that measurement invariance was not evaluated due to subgroups with underspecified sample sizes, which prevented the development of a multigroup CFA analysis. Future studies with representative strata in each subgroup could assess invariance by age, gender, marital status, and education level. Lastly, our strength lies in the fact that our instrument, being novel and original in our context, offers an innovative contribution to the body of research in this field.
Conclusions
The aim of this study was to evaluate the reliability and validity of the Scale of Readiness for Change in Adults with Alcoholism (SRCAA). The results indicated that the scale, with 2 factors and 19 items, provides robust evidence of validity concerning its internal structure and external validity, as well as optimal reliability. Therefore, it can be effectively applied in clinical and research settings. Application in Diverse Contexts: Future studies should include more diverse samples and validate the questionnaire in different cultural and clinical settings, ensuring measurement invariance. Sample Expansion: Conduct studies with larger and more diverse samples to enhance the external validity of the SRCAA and ensure the instrument is suitable for various subgroups. Form Establishment: Implement norms to facilitate the interpretation of scores relative to a reference group, such as percentiles, standard scores, or other comparison systems.

