


 texto en
  Inglés (pdf)
 Articulo en XML
 Referencias del artículo
 Enviar articulo por email
 Citado por SciELO
  Similares en
SciELO
Similares en
SciELO 
 Permalink
1. Introduction
Bangladesh is one of the most climate vulnerable countries in the world. She suffers from regular natural hazards e.g. floods, storm surges, droughts and tropical cyclones etc. These hazards leads to the loss and destruction of housing, land and property that resulted the livelihoods of the affected people and hence, widespread displacement across the country. These adverse impact of climate change and variability has converted an environmental and socio economic tricky which is progressively causing climate-driven hazards to people (Barua and Rahman, 2018; Barua et al., 2017). However, in response to the regular and severe natural disasters the Government of Bangladesh has developed a number of programs to relocate and rehabilitate these people (Rahman 2017; Das et al. 2012; Hossain 2015; Momen 1996; Barkat et al. 2001; Barkat et al. 2000; Rahman and Rahman 2015; Mallick and Sultana2017).
The Ashrayan Project is a unique example of how a home can be a major tool for overall family well-being and social development. In 1997, the government of Bangladesh launched the first Ashraya Project and took the initiative to rehabilitate the homeless, uprooted and helpless poor people. These people have also been engaged in income-generating activities through the providence of loans and training facilities in order to improve their quality of life. Up to 2019, a total of 298,249 families have been rehabilitated. In Mujib Borsho, Bangladesh government re-introduced the housing program through Asharan-2 project to provide houses to the homeless and landless people in the quickest time. In addition to the construction of barracks, a program was undertaken for the construction of a two-room house, a spacious verandah, a kitchen and a toilet, including the provision of 2 decimals of land foreach destitute family. In the first phase of the project (reported on 23 January 2021) a total of 69,904families and in the second phase (reported on June 20, 2021), more than 53,000 families have been given houses along with ownership rights (Miah 2021).
Due to numerous reasons the various development projects in Bangladesh have failed in achieving their goals between 1950 and 1972 (Barkat et al., 2000; Momen, 1996). Still today, the actual extent of land redistributed to the landless is influenced by powerful elites including government officials, private stakeholders and local politicians who have benefited from the policy initiatives to strengthen their socio-economic and political position (Das, 2010; Momen, 1996; Barkat, 2004; Barkat et al., 2000; Das et al. 2012). Besides, the rehabilitation of displaced persons by government and non-government sectors are, to date, insufficient compare to the number of displaced persons. Importantly it is also found that livelihood problems remain after the rehabilitation of displaced persons (Mallick and Sultana2017). Therefore, there is a need to examine the impact of various government policies taken for the displaced marginal people.
The main objective of the study is to starch the impact of Ashrayan-2 project on the livelihood of the beneficiary households. To achieve the main objective, the study set its specific objectives as follows:
i. To calculate the standard of livelihood of beneficiary people before resettlement.
ii. To calculate the standard of livelihood of the beneficiary people after resettlement.
iii. To compare the standard of livelihood before and after resettlement.
To achieve these objectives, the study follows both qualitative and quantitative data. The study uses weighted index technique for calculating the livelihood standard of the beneficiary people.
Natural disasters are common phenomena in Bangladesh. Various natural hazards including floods, tropical cyclones, storm surges and droughts occur regular basis. Bangladesh government is also aware about the crises and since its independence, has implemented various projects for the affected people.
Table 1 Different Resettlement and Rehabilitation Projects in Bangladesh
| Name | Starting Year | Total Number of Beneficiaries |
|---|---|---|
| Cluster village | 1972 | Data is not available |
| Ashrayon | 1997 | 50,000 landless families |
| Adarsha Gram | 1998 | 71,032 families |
| Abashan | 2001 | 65,000 landless and rootless family |
| Guchchagram (Project-I) | 2009 | 10,706 landless families |
| Guchchagram (Project-II) | 2015 | 50,000 landless |
| Ashrayon II | 2020 | More than 1,22,904 |
Source. Cited in Mallick and Sultana 2017 and Miah 2021.
As a riverine country, riverbank erosion is a common phenomenon in Bangladesh. Therefore, the impact of riverbank erosion is particularly pronounced. Countless Bangladeshis have seen their homes destroyed, compelling them to uproot their lives. This phenomenon predominantly affects the country’s major rivers, such as the Ganges, Brahmaputra, and Meghna, along with their tributaries and distributaries (Kadir and Naher 2023). Displacement marginalized. Such forty million homeless people in Bangladesh are compelled to lead a floating life and affected through livelihood patterns and psycho-physical troubles. Newly settled people along with the native inhabitants have been interviewed to reveal the problems associated with making rearrangements for the displaced people. Besides these includes adaptation strategies and relationships with the local people, their socioeconomic losses, sufferings, perception of natural disaster and psycho-physical problems, environmental reinspect. (Islam and Rashid 2011). However, government initiatives are not sufficient for in this regard. Thus, people use different types of indigenous knowledge to reduce the sufferings of the affected people (Borua et al. 2019). Experience from Guchhagram project reveals that there is a significant improvement in the livelihood conditions of the relocated people, but due to locational disadvantages and lack of access to agricultural production, the local employment market, some of the targeted objectives of the project have not achieved. To some extent, the rehabilitated families have similar risks as they had before (Mallick and Sultana 2017; Rudra et al. 2022). Hence, it becomes essential to examine the impact of various project on the livelihood of the beneficiary people. However, albeit some of the previous studies conducted on the issue, as per our knowledge few research conducted on the Ashrayan 2 project and its impact on the relocated people. Therefore, the study aims to fill up the gap.
#No borrar (espacio de sección, si se tiene dos espacios seguidos mantener solo uno)
2. Methology
2.1 Study Area and Data Collection
The study follows both qualitative and quantitative approach in its analysis. By following multistage sampling technique, the study collects its required data. At first stage it selects Tangail district for convenience. Then it selects Tangail Sadar Upazila in second stage. Finally, eight program intervention areas are selected randomly. For its analysis the study collects required data from 145 beneficiary households through systematic random sampling technique. Besides, the study used secondary data also when it required.
2.2 Theoretical Framework
Changes in livelihood quality have been explained in different approaches: the livelihood approach (De Sherbinin et al. 2008; Ashley and Carney 1999; Soltani et al. 2012), production and consumption analysis (Ellis 2000), livelihood activity choices (Lambini and Nguyen 2014), and sustainable livelihood’s approach (SLA) (DFID 1998). Livelihood strategy identification is helpful in ensuring efficiency in implementing intervention programs and hence improving the livelihood of the rural poor people. Among different methods (Nguyen et al. 2015) focus on the rural livelihood strategies and the determination process in Cambodia. They have defined livelihood framework by three closely connected components viz. livelihood platforms, livelihood strategies, and livelihood outcomes. The livelihood platforms are defined by natural capital and household capital (physical, human, financial, and social). This contextualization of livelihood platforms is similar to the DFID’s SLA (Lambini and Nguyen 2014; DFID 1998). As the main objective of this research is to assess the outcome of the relocated livelihoods in Ashrayan-2 project intervention areas, it considers the analysis of the ‘livelihood platform’ approach of the SLA framework of DFID.
2.3 The Livelihood used in the Study
The research considers total 30 variables for constructing a weighted index under SLA approach. These variables are classified into four major groups viz. Natural capital: Proximity to rivers and resilience to natural hazards, i.e., floods, erosion, tidal surges, etc.; Financial capital: Production of rice, having a home garden, having livestock, having poultry, ability to store food, access to safe water, per capita monthly food expenditure, having fixed income and per capita monthly income; Social capital: Having relatives or friends help if there is a problem, receiving credit or making loan to relatives and friends, receiving credit or making loan to others people, received help from a community leader, received help from a political leader, feeling dishonor from others and have any conflicts with neighbors and Physical capital: Having the capacity to preserve food, having easy access to fresh water at home, having access to electricity, having safe and sanitary latrine facilities, having access to telephone or mobile technologies, having access to primary health care facility, having access to an educational facility, having access to public transport facility, having access to public places like hat, bazar, school etc., having access to public religious place, having access to solid-waste management, having drainage facility.
2.4 Analytical Technique and Result Presentation
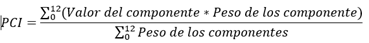
All these 30 capitals are the sources of livelihood strategies, which are termed as the indicators of changes in livelihood and have been analyzed in both the pre- and post- relocation situation. Following Mallick and Sultana (2017) weighted indexing method has been applied to calculate the changes at an individual household level. However, the study used two-way analysis in this regard. In first case, the study used a weighted index considering all 30 variables in a single index. Then the study used a composite weighted index method. In both cases all factors are treated equally. Depending on the direction of effects (positive or negative for the improvement of livelihood condition), a value of negative or positive 1 is assigned to the factors. Then, all the assigned values are summed and divided by the number of factors. The scores obtained describe the improvement in the quality of livelihood. The weighted livelihood index is constructed as follows:
Weighted Livelihood Index
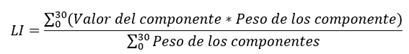 (1)
(1)
The study also used a composite livelihood index by summing four individual weighted indices: Natural Capital Index (NCI), Financial Capital Index (FCI), Social Capital Index (SCI), and Physical Capital Index (PCI).
Natural Capital Index:
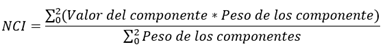 (2)
(2)
Two variables are used in this index- Proximity to river (No=1, Yes= -1) and protected from tidal surges (Yes=1, No=-1).
Financial Capital Index:
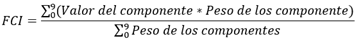 (3)
(3)
Nine indicators are used for developing weighted index for financial category. Production of rice, Having a home garden, Having livestock, Having poultry, Ability to store food, Access to safe water, The cost of daily food is equal to or lesser than the national average, Having regular and fixed income (business or job) and Daily income per capita is equal to or larger than the national average. In case of all variables weights are: Yes=1, No=-1.
Social Capital Index:
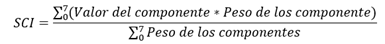 (4)
(4)
Seven indicators are used for constructing Social Capital Index viz. Having relatives or friends help if there is a problem (Yes=1, No=-1), Receiving credit or making loan to relatives and friends (No=1, Yes=-1), Receiving credit or making loan to others people (No=1, Yes=-1), Received help from a community leader (Yes=1, No=-1), Received help from a political leader (Yes=1, No=-1), Feeling dishonor from others (No=1, Yes=-1), Do you have any conflicts with neighbors (No=1, Yes=-1)
Physical Capital Index:
 (5)
(5)
Twelve livelihood indicators are used in Physical Capital Index viz. Having the capacity to preserve food, Having easy access to fresh water at home, Having access to electricity, Having safe and sanitary latrine facilities, Having access to telephone or mobile technologies, Having access to primary health care facility, Having access to an educational facility, Having access to public transport facility, Having access to public religious places like hat, bazar, school etc., Having access to public religious place, Having access to solid-waste management, Having drainage facility. Finally, Composite Livelihood Index is constructed with the help of these weighted indices.
Composite Livelihood Index,
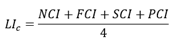 (6)
(6)
The output factor (quality of livelihood index) is in the range of -1 to 1. This method is applied before and after relocation. The difference in the livelihood index before and after relocation describes whether there was an improvement in livelihood at the individual household level. A negative output shows that the livelihood quality has not improved. Then the study used a composite weighted index method. In this case a weighted index is made for all capital groups and then construct a composite index.
3. Results and Discussion
The results of the study are discussed in two phases. In first phase discusses the results of qualitative analysis and the second phase discusses the results of quantitative analysis.
3.1 Results of Qualitative Analysis
3.1.1. Results of KII Analysis
The study conducted three KII and found that:
i. The beneficiaries have received two decimal land, one house with two rooms, one toile and varanda. They also get some tube well in the project intervention area and also electricity connection. Some of the cases they have received cattle, training and sewing machine. Besides, sometimes they get food assistance from government and non-government agencies.
ii. Most of the cases the beneficiary households in others’ house for rent. Therefore, these houses ensure a shelter for them. Further, most of the cases the respondents were in kachha house which was destroyed by during rainy season due to rain and flood which required a large amount of cost for repair. Hence, Ashrayan-2 project reduced their housing cost. Provided tube-well have ensured save drinking water that contributed in better health. Sometimes the government provide them rice, wheat, oil and other food items. Some household, though a few in number, get income generating assistance like goat, sewing machine and required training, rickshaw/van etc. Provided cattle, rickshaw/van, sewing machine and required training are enhancing households’ income. Therefore, this program affects the livelihood of these poor people positively. Thus, the project has significantly contributed in ensuring a better livelihood for the beneficiary households.
iii. As the beneficiary households were land less and homeless thus they do not have resettlement cost at large extent. Although in some cases they have some time and monetary costs. It is observed that before resettlement some respondents were in town and after resettlement, they have to go to town for works for which they need huge time and money.
iv. Only the land less and houseless people get the benefit. Therefore, the beneficiary households are considered as very poor and floating people. Thus, many of the cases the main steam people neglect them. Further, the people benefited from the khas land before resettlement consider these marginal people as their enemies. However, some of the beneficiaries came from same village. Thus they do not face social dishonor at large extent. Although in case of setting marital relationship they face some problems.
v. The project has some limitations also. Some districts or upazilas that required more house get small number of house. The house and the land is not sufficient for a family with parents and children. It may create conflict among children in case the ownership of the house. Most of the cases the houses are located on the river bank and they do not have road connection. Therefore, they cannot reach their patients at hospital timely. There is no sufficient light in the project so that they feel unsecured in such area outside of locality. The yard is so small that beneficiaries cannot make a garden in the house. Further, they do not get any agricultural land. The government assistances do not distribute sufficiently and properly. Additionally, is has been stopped for around two years. There is no mosque, graveyard, school for the people. The main steam people are not interested to include them (beneficiaries) in their society. In some project intervention areas government established health center albite it is non-operational. Finally, in some cases, rich people get the house for their personal relationship with local political leader or authorities where landless-homeless were remain behind.
vi. The project has ensured shelter for the people and enhancing income. Hence, it contributing in better livelihood for these marginal people. Therefore, this project should be continued. In this case a complete baseline survey is required for such large scale project. Further, the beneficiaries should provide sufficient land area as well as more facilities. Selection should be in blind process. Authority should take income generating programs for such people such as providing rickshaw/van, livestock, shop/small business etc. The provided land size should be large and should provide some land for cultivation. Religious and social institutions like Mosque, Temple, Graveyard etc. should be established for these people. Established health centers should be operational so that these poor people can get health facilities. Required manpower should be employed in this regard. At the same time government can give financial support and different assistance for these marginal people.
3.1.2. Results of FGD Analysis
The study conducted 9 FGD and their results are given below briefly.
i. They have received a tin-shed semi pacca house, Tub-well, electricity line. There is a drainage system in some project intervention areas while some others do not. The beneficiaries also get a Toilet, supply water in front of the house. But they do not have water connectivity with toilet or bathroom. Majorities of the families are living permanently albeit some families are living temporarily. Due to lack of income opportunities in project intervention areas, they go to town for works. Majority of them get the documents of ownership of their houses.
ii. Generally, they do not get cash money or food assistance from government and non-government organizations. Although two/three years ago they got some food grains though it was not sufficient for them.
iii. A few numbers of project interventions areas government and non-government organizations arranged income generating programs. A small number of women get sewing machine and required training. Some households get goat, rickshaw/ van from the project though the number is very small. Though some beneficiaries rear livestock personally but due to insufficient yard area they it becomes difficult for them.
iv. They can go to public places (viz. hat, bazar); public religious places (mosque, temple etc.) like main stream people. There children can go to school and they can take their patient to the hospital normally although due to poor communication system and more distance they face difficulties. In some areas government establish health center albeit unfortunately it remains non-operational. There is no doctor, no nurse and no medicine at all.
v. They were landless and homeless. Due to this project, they get house with land. It is a great gift for them. They get free of costs shelter for their family. Otherwise, they were floating and lived in others’ house for rent. Due to get the house they have their own house.
vi. Most of them were homeless. So, they do not have much costs for resettlement. However, due to lack of road facilities the rickshaw/ van poolers cannot bring their vehicle at their house. So they have to bare garage cost. But as the houses are located in very remote areas, most of the time in the year there is no working opportunity. So, they have to go to work in the town. For this they have to pay a large amount of transportation cost in terms of both time and money. Although they get a shelter, they have to leave their village, people and relatives. So, if they get it near their own village, it would be more convenient for them.
vii. The beneficiaries face some social dishonor. Although they can go hat, bazar, school, mosque like other people they don’t have society. Besides, they are proven poor and considered as poor slum people. So, that they become subject to dishonor in case of marriage their children and during a quarrel with local people. Even the main steam people do not give them any land for share-cropping.
viii. The house is so small that they cannot live with their parents and children together. The Land is so small that they cannot make a garden or rearing livestock. As they do not have any agricultural land, they cannot grow any crops. Even local people do not give them their land for cultivation in share cropping. The houses are located on the river side. So there is no road connection and they cannot take their patient to hospital due time. There is no sufficient light in the project intervention area. There are no health care facilities for mothers and children. Due to lack of job facilities many families live in the house irregularly. Because of lack of alternatives, they have to use cylinder gas that requires huge cost. There is no pipe line water supply at bath room and toilet. There is no school for children and no clinic for patient. So, they do not get proper education and healthcare facilities. Therefore, although they get a shelter, till now they lead a measurable livelihood.
ix. As the program benefited marginal people and till now there are many people remain homeless so, this program should be continued for these poor people. In this case the respective authorities should be more careful so that the original poor get the benefits. They get house in a long distance from their house. So if it is near their village they do not lost their village, friends and families. There is no school, Masjid, graveyard and health clinic for these poor people. Government should generate income opportunities for man through providing rickshaw/ van. Sewing machine and related training should be provided for female so that they can change their life. Health facilities should be given for these poor families. Government health center can be established near the project intervention area. If they get line gas they would be benefited. Water line should be connected with toilet and bathroom. The safety tank should be large. The house should be large so that they can live comfortably and rear livestock. It would be better, if they get more land including some agricultural land.
3.2 Results of Weighted Index Analysis
3.2.1. Results of Weighted Index Analysis
The study constructed a weighted index where all 30 variables are used in a single weighted index and have given equal weights. It is observed in Table 1 and Table 2 that there exist significant difference in the livelihood scenario of the beneficiary people. In some cases, livelihood standard increases while in some other cases it decreases. In a few cases the livelihood standard remained unchanged. However, according to weighted index the value of average livelihood standard before relocation was -0.08 which becomes -0.07 after relocation.
Table 2 Result of weighted index
| After | Before | After | Before | After | Before | After | Before | After | Before |
| 0.00 | 0.00 | 0.34 | -0.08 | -0.22 | -0.04 | -0.27 | -0.04 | -0.33 | -0.41 |
| 0.10 | -0.17 | 0.10 | -0.08 | 0.01 | 0.01 | -0.15 | -0.28 | 0.05 | 0.08 |
| 0.20 | 0.03 | -0.13 | -0.10 | -0.33 | -0.32 | -0.27 | -0.38 | 0.03 | -0.13 |
| 0.28 | 0.33 | 0.06 | 0.24 | -0.34 | -0.33 | -0.34 | -0.26 | 0.10 | 0.01 |
| 0.36 | 0.33 | 0.07 | 0.19 | -0.14 | -0.19 | 0.27 | 0.07 | 0.02 | -0.04 |
| 0.04 | -0.02 | -0.13 | -0.01 | -0.09 | 0.11 | -0.22 | -0.36 | -0.39 | -0.32 |
| 0.26 | 0.26 | -0.40 | -0.59 | 0.08 | -0.09 | -0.21 | -0.13 | -0.35 | -0.39 |
| 0.02 | 0.05 | -0.48 | -0.40 | -0.18 | -0.23 | 0.07 | -0.28 | -0.22 | -0.16 |
| -0.01 | 0.03 | -0.49 | -0.34 | -0.21 | -0.39 | -0.26 | -0.18 | -0.28 | -0.30 |
| -0.07 | 0.08 | -0.29 | -0.33 | 0.19 | 0.21 | -0.21 | -0.54 | -0.15 | -0.11 |
| 0.13 | -0.05 | -0.26 | -0.37 | 0.30 | 0.25 | -0.02 | -0.11 | -0.35 | -0.30 |
| 0.02 | 0.01 | -0.28 | 0.06 | 0.03 | 0.00 | -0.07 | -0.03 | 0.05 | 0.24 |
| 0.07 | -0.04 | -0.02 | -0.16 | 0.00 | 0.46 | -0.06 | 0.12 | -0.12 | -0.21 |
| 0.06 | -0.07 | -0.19 | -0.06 | 0.09 | 0.40 | -0.13 | -0.11 | -0.02 | 0.01 |
Source: Prepared by the authors based on research results.
Tabla 3 Resultados del Índice Ponderado (continuación de la tabla 2)
| Antes | Después | Antes | Después | Antes | Después | Antes | Después | Antes | Después |
|---|---|---|---|---|---|---|---|---|---|
| -0.14 | -0.06 | -0.07 | -0.14 | -0.01 | -0.64 | -0.21 | -0.33 | -0.18 | -0.23 |
| -0.02 | -0.46 | 0.25 | 0.26 | -0.17 | -0.41 | 0.14 | -0.06 | -0.15 | -0.14 |
| -0.07 | 0.01 | -0.04 | 0.10 | -0.01 | -0.04 | -0.13 | 0.03 | -0.01 | -0.06 |
| -0.13 | 0.25 | -0.07 | 0.03 | 0.06 | -0.13 | 0.12 | 0.66 | -0.13 | -0.15 |
| -0.06 | 0.06 | -0.06 | -0.05 | 0.07 | -0.05 | 0.12 | 0.20 | 0.02 | 0.06 |
| 0.12 | 0.21 | -0.01 | -0.06 | 0.06 | -0.06 | 0.02 | 0.10 | -0.04 | -0.03 |
| -0.17 | -0.16 | 0.19 | 0.27 | -0.01 | -0.03 | -0.06 | 0.03 | -0.15 | -0.06 |
| -0.01 | -0.73 | -0.06 | 0.03 | 0.02 | 0.02 | -0.33 | -0.03 | -0.02 | 0.13 |
| 0.02 | 0.13 | -0.39 | -0.63 | -0.19 | -0.21 | -0.34 | -0.19 | 0.12 | 0.15 |
| -0.07 | 0.15 | -0.21 | -0.67 | -0.06 | -0.13 | -0.40 | 0.01 | -0.01 | 0.01 |
| -0.28 | -0.25 | -0.19 | -0.30 | 0.14 | 0.47 | 0.13 | 0.23 | ||
| -0.21 | -0.04 | 0.06 | -0.03 | 0.02 | -0.14 | -0.12 | 0.36 | ||
| -0.20 | -0.71 | -0.04 | -0.11 | -0.01 | -0.19 | -0.22 | -0.15 | ||
| 0.05 | -0.68 | -0.19 | -0.23 | 0.06 | -0.33 | -0.08 | -0.19 |
Source: Prepared by the authors based on research results.
Cambios en el estándar de medios de vida
It is observed from Chart 1 that livelihood of the beneficiary households has been changed. Some households can improve their livelihood where some other cannot
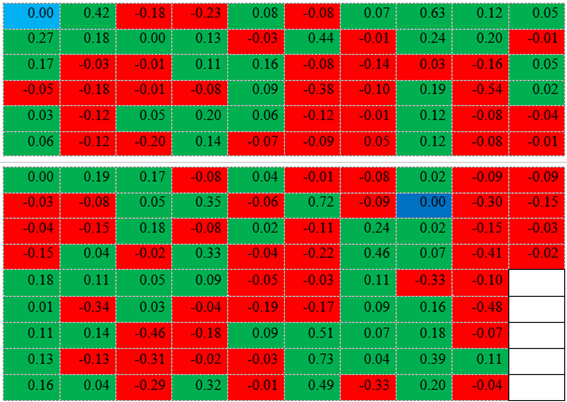
The green color represents a positive change (69 households) and the red color represents negative change (74 households). Only 2 households expose same livelihood standard as before which is presented through blue color.
Distribución de los hogares según el cambio en el nivel de subsistencia
It is observed that only 1 percent household has remains same standard. Livelihood standard increased in case of 48 percent households where it decreased in case of 51 percent households.
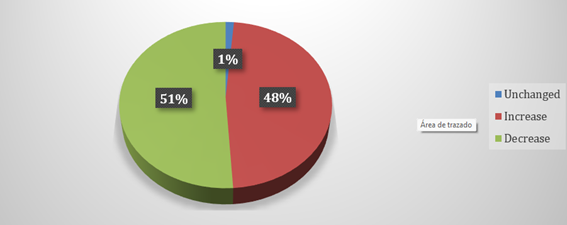
Various socioeconomic factors viz. transportation facilities, school facilities, healthcare facilities, safe drinking water facilities, drainage facilities, previous location, current location, income opportunities etc. have significant contribution in such difference in livelihood standard.
3.2.2. Resultados de análisis del Índice Compuesto
The study is constructed a composite index where all 30 variables are divided into four broad categories. Natural capital category contains 2 variables and financial category contains 9 variables where 7 variables go to social capital category and rest 12 variables contain in physical capital category. However, results of composite index in Table 3 and 4 reveals that livelihood standard of all beneficiary households have been changed. In case of some households it has been increases in case of other households it has been decreased. However, the weighted composite index reveals the value of average livelihood standard before relocation -0.04 which becomes 0.09 after relocation.
Table 4 Results of composite index
| After | Before | After | Before | After | Before | After | Before | After | Before |
| 0.25 | 0.00 | 0.44 | -0.05 | 0.02 | -0.04 | -0.08 | 0.05 | -0.12 | -0.26 |
| 0.19 | -0.09 | 0.19 | -0.09 | 0.11 | -0.03 | 0.03 | -0.21 | 0.24 | 0.10 |
| 0.28 | 0.01 | 0.03 | -0.11 | -0.11 | -0.25 | -0.05 | -0.28 | 0.23 | -0.04 |
| 0.35 | 0.29 | 0.19 | 0.16 | -0.09 | -0.24 | -0.06 | -0.19 | 0.25 | 0.00 |
| 0.47 | 0.26 | 0.20 | 0.12 | -0.01 | 0.10 | 0.40 | 0.09 | 0.17 | -0.04 |
| 0.12 | -0.10 | 0.05 | -0.03 | 0.13 | 0.09 | -0.05 | -0.28 | -0.16 | -0.24 |
| 0.34 | 0.24 | -0.16 | -0.42 | 0.23 | -0.04 | 0.02 | 0.17 | -0.12 | -0.28 |
| 0.12 | -0.06 | -0.22 | -0.31 | -0.03 | -0.21 | 0.17 | -0.07 | -0.04 | -0.15 |
| 0.13 | 0.01 | -0.22 | -0.25 | -0.03 | -0.28 | -0.07 | -0.24 | -0.08 | -0.26 |
| 0.07 | 0.01 | -0.02 | -0.18 | 0.36 | 0.21 | -0.04 | -0.15 | 0.00 | -0.11 |
| 0.26 | -0.07 | -0.07 | -0.32 | 0.37 | 0.40 | 0.13 | 0.08 | -0.12 | -0.23 |
| 0.14 | 0.03 | -0.08 | 0.26 | 0.14 | 0.20 | 0.10 | -0.08 | 0.20 | 0.50 |
| 0.14 | -0.08 | 0.14 | 0.07 | 0.20 | 0.49 | 0.10 | 0.08 | 0.00 | -0.26 |
| 0.14 | -0.08 | -0.01 | -0.12 | 0.17 | 0.33 | 0.09 | -0.05 | 0.12 | -0.03 |
Source: Prepared by the authors based on research results.
Tabla 5. Results of composite index (Continuation of Tabla 4 )
| Antes | Después | Antes | Después | Antes | Después | Antes | Después | Antes | Después |
|---|---|---|---|---|---|---|---|---|---|
| 0.00 | -0.07 | 0.04 | 0.11 | 0.13 | -0.51 | 0.02 | -0.24 | -0.04 | -0.22 |
| 0.12 | -0.31 | 0.34 | 0.12 | 0.00 | -0.31 | 0.21 | -0.10 | 0.03 | -0.11 |
| 0.10 | 0.00 | 0.06 | 0.06 | 0.12 | -0.05 | 0.00 | 0.29 | 0.14 | 0.21 |
| 0.08 | 0.25 | 0.09 | -0.02 | 0.17 | -0.10 | 0.18 | 0.43 | 0.09 | 0.10 |
| 0.04 | 0.22 | 0.06 | -0.05 | 0.16 | -0.07 | 0.26 | 0.13 | 0.20 | 0.02 |
| 0.29 | 0.11 | 0.12 | -0.07 | 0.16 | 0.18 | 0.16 | 0.07 | 0.04 | -0.07 |
| -0.01 | -0.15 | 0.25 | 0.18 | 0.17 | -0.07 | 0.09 | 0.03 | 0.00 | -0.10 |
| 0.19 | -0.52 | 0.13 | 0.06 | 0.17 | 0.27 | -0.09 | 0.03 | 0.09 | 0.07 |
| 0.12 | 0.09 | -0.15 | -0.47 | 0.02 | 0.01 | -0.06 | -0.16 | 0.20 | 0.06 |
| 0.04 | 0.09 | 0.05 | -0.22 | 0.10 | -0.19 | -0.12 | 0.03 | 0.09 | -0.06 |
| -0.05 | -0.13 | -0.03 | -0.04 | 0.27 | 0.39 | 0.24 | 0.16 | ||
| 0.04 | -0.02 | 0.23 | 0.18 | 0.12 | -0.15 | 0.00 | 0.30 | ||
| -0.04 | -0.55 | 0.10 | 0.06 | 0.12 | -0.15 | -0.02 | -0.15 | ||
| 0.23 | -0.47 | 0.02 | -0.24 | 0.22 | -0.22 | 0.09 | 0.10 |
Source: Prepared by the authors based on research results.
Change in Livelihood Standard
It is observed from Chart 2 that results of composite index reveals that livelihood standard for majority of the households is improved after resettlement (Green color). Among 145 responding households 117 households can ensure better livelihood. While rest 28 households expose a decrease in livelihood standard. Some of the beneficiary households were living at rent house in town area which ensured more facilities than present one. In some cases, beneficiaries were living in their own village and engaged in agricultural activities along with share cropping and livestock rearing. But after resettlement they have lost these opportunities.
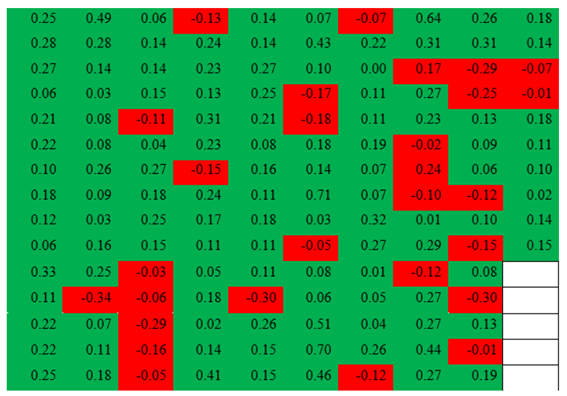
Figure 3: Difference in livelihood standard between after and before resettlement (Weighted composite index)
Distribution of Households According to Change in Livelihood Standard
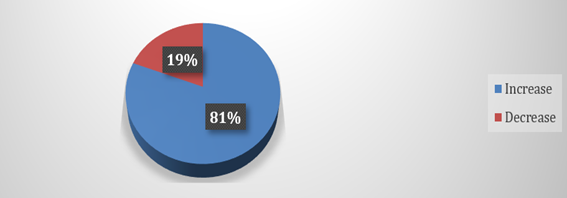
It is observed from Figure 2 that 81 percent households can ensure better livelihood after resettlement and in case of 19 percent households’ livelihood standard decreases. Living location before and after resettlement contributes significantly in this difference.
4. Major Findings of the Study
i. The beneficiary people, before resettlement, were land less and homeless. They have no identity. Most of them lost their house and land due to river erosion or financial crisis where as some were very poor by generations. It is found that most of they were living in rural areas at other’s land or slum areas in the town. Although some of them were living in rent house in the town. Therefore, these marginal people were either living miserable livelihood or paying rents for a shelter. Therefore, obviously the project is a bless for them. Under this project the beneficiary households get a semi pacca house with 2 decimal land. There are two rooms, one kitchen, one toilet, one varanda. In some cases, they received income generating facilities like sewing machine, richskaw/van and livestock as well as food assistance.
ii. The project has some limitations also. The house is so small to live with parents and children. Due to small yard they cannot make garden or rear livestock. They have no agricultural land. So they cannot cultivate agricultural product and cannot ensure sufficient food for themselves. These marginal people, thus, basically depending upon day labor for agriculture cropping. But, this demand for labor is seasonal. Therefore, theses marginal people lead a miserable livelihood rest of the year. Thus, some of them go to town for works which has extra time and monetary cost. There is health center some project intervention areas. But it is non-operational due to absence of doctor, nurse and medicine. Further, most of the project intervention areas were located on river bank which consequences a poor road connectivity with the locality. Hence, they face difficulties in getting education and health related facilities. Albeit there is drainage system in some areas, most of the cases there is no drainage system at all. Besides, the safety well of the toilet is so small that it over flooded within few months. In addition, the beneficiary people do not have any society or any religious places. Hence, they become subject to neglects and discrimination from main stream people. Therefore, till now they lead a miserable livelihood.
ii. The beneficiary people lead miserable livelihood both before and after resettlement. They get a house and two decimal land but the livelihood indicators have no change at large extent. Thus, Ashrayan 2 project increase the livelihood standard of the beneficiary people but at small extent. The livelihood standard of the beneficiary people may be improved after some revision of the project.
5. Policy Suggestions
Aiming improving livelihood standard of the beneficiary people the study suggests some policy as follows:
i. The provided house can be large enough so that beneficiary people can live comfortability with their parents and children. The amount should be increased to gardening and rearing cattle in the yard. They can provide some agricultural land also.
ii. Various problems in the project interventions areas should be solved. Authority should ensure proper drainage and sewerage system in the area. Water line should be connected with toilet and kitchen.
iii. Various income generating program should be implemented in the project intervention areas. Providing rickshaw/van, sewing machine, small business shop, cattle etc. can contribute in income enhancement of the beneficiary people.
iv. Project should be established near to the town. It ensures more work opportunities for the beneficiary people. It also contributes in reducing education, health and communication related problems.
v. Some awareness program should be implemented for reducing discrimination against the beneficiary people.

