


 English (pdf)
 Article in xml format
 Article references
 Send this article by e-mail
 Cited by SciELO
  Similars in
SciELO
Similars in
SciELO 
 Permalink
In general, all individuals pursue happiness, life satisfaction, and success in social, personal, and professional spheres. This has been the object of multiple investigations examining, for example, life satisfaction (Pavot & Diener, 1993; Smith et al., 2017) and job satisfaction (Judge et al., 2017). However, when it comes to undergraduate students, investigating their level of satisfaction in the degree program (Krieg, 2013; Webber et al., 2013) seems to be more suitable and relevant than analyzing their satisfaction in the work environment, that is more explored among adults (Ritter et al., 2016).
Many students, influenced by the work market demand, by their families, by the social value of a profession, or even by the possibility of a good income, start a degree program without necessarily identifying themselves with the chosen academic course (Rodrigues & Liberto, 2016). Academic dissatisfaction poses some negative consequences for individuals, companies and the society in general. In fact, individuals that are unhappy with their academic course tend to be more passive in their business life and present lower desire to improve their career (Erdoğan & Arsal, 2015). Because of such negative impacts of academic satisfaction/dissatisfaction, this topic has been object of multiple empirical investigations exploring academic satisfaction either as a predictor or as a dependent variable. For example, students’ academic experience seems to predict performance and intentions to remain in the university (Sarah & Crede, 2015; Wach et al., 2016). Predictors of academic satisfaction have also been identified, such as personality traits (Trógolo & Medrano, 2012; Wach et al., 2016), self-efficacy (DeWitz & Walsh, 2002), and values/individual motivations (Madison et al., 2017; Holland, 1997) to mention only a few.
Different perspectives have studied academic satisfaction, which has resulted in different ways of operationalizing this variable that has been measured either by using scales with a single item or by multiple-items (Sovet et al., 2014). Some examples of the latter include inventories such as the College Satisfaction Scale (CSS; Betz et al., 1971; Lodi et al., 2017), the Student Satisfaction Inventory (SSI; Martirosyan, 2015) the Perceived Quality of Academic Life Scale (PQAL; (Staats & Partlo, 1990), and the Multidimensional Students’ Life Satisfaction Scale (MSLSS; Huebner, 2001) that assesses several aspects of students’ satisfaction (e.g. interaction with their peers, quality of the lectures, physical environment). Nevertheless, this plurality of facets evaluated the construct minimize a more parsimonious assessment of students’ global academic satisfaction. This is because to investigate the satisfaction with the academic degree itself by applying measures of satisfaction with the lectures and with the physical environment may lead to biased results. Some students may be happy about the university physical structure or satisfied with their lectures and yet unsatisfied with their degree.
Recently, different authors, aiming at overcoming these limitations (e.g. Camp & Chartrand, 1992; Leong et al., 2005), used “single items” to assess global academic satisfaction, not obtaining, however much success due to the items lack of suitable parametric parameters. On the other hand, some studies have emphasised cognitive or affective aspects to explain academic satisfaction (Mathis, 2016); others define satisfaction as an attitude towards the studies, or even, mix job satisfaction and academic satisfaction. The bottom line is that this is a complex phenomenon marked by inconsistent results due to the lack of a common definition in the literature (Wach et al., 2016).
Academic Major Satisfaction Scale (AMSS)
Given this topic’s relevance, to overcome the limitations previously discussed, Nauta (2007) developed the Academic Major Satisfaction Scale (AMSS) that is a multiple-item measure of global academic satisfaction. This instrument considers global academic satisfaction as a crucial factor for students’ decision-making, affecting students’ integration into their academic program and consequently, their permanence in the course and satisfaction with their future professional life (Betz et al., 1971; Santos et al., 2013).
Following the concept of life satisfaction (e.g., Diener et al. 1985) and job satisfaction (e.g., Hsieh & Huang, 2017), the AMSS evaluates both cognitive and emotional dimensions, such that its total score provides a general evaluation of academic satisfaction (Nauta 2007). The original version consisted of 20 items responded on a five-point scale, ranging from 1 (totally agree) to 5 (totally disagree). Two hundred and twenty-seven American undergraduate students from a large middle-west university and with mean age of 21 years (SD 2.26) completed the questionnaire. The results demonstrated a structure of one factor, composed of the six items that reached the highest discriminant power in students that completed the measure in an interval of 2.5 years. Out of the six items, four (Item 1,2,3 and 6) are negative (e.g., 1. I often wish I hadn’t gotten into this course; 2. I wish I was happier with my choice of an academic course) and two are positive (Item 4. Overall, I am happy with the course I’ve chosen; Item 5. I feel good about the course I’ve selected). Internal consistency was satisfactory as shown by Cronbach’s alpha (.94).
Nauta (2007) confirmed the scale’s unidimensionality in a different sample of 244 American undergraduate students by using confirmatory factor analysis (CFA) techniques. The author also assessed the convergent validity of the measure that presented significant correlations with measures of self-efficacy, anxiety, indecision in choosing a career and their marks in completed academic modules. Such findings suggest evidence of psychometric suitability for this measure, which has been corroborated in other contexts, such as the Korean (Sovet et al., 2014) and Turkish (Erdoğan & Arsal, 2015).
Erdoğan and Arsal (2015) validated the measure in 354 Turkish undergraduate students split in three groups. The first, encompassing 33 students, was used to translate the instrument from English to Turkish, confirming the linguistic equivalence of the Turkish version. The construct validity was verified in the second group of 267 students by using exploratory and confirmatory factor analysis that confirmed the uni-factorial structure of the measure that also showed suitable internal consistency (.83). Test-retest reliability (r = .94) was verified in the remaining 53 students after a four-week interval. The results were consistent with Nauta’s (2007) findings, demonstrating the psychometric suitability of the Turkish version of the AMSS.
In South Korea, Sovet et al. (2014) adapted the AMSS in a sample of 275 Korean undergraduate students, with a mean age of 21 years (SD = 1.86). The results demonstrated a suitable internal consistency (alpha = .87) for the total sample and teste-retest reliability of .84. The construct validity, tested by running exploratory and confirmatory factor analysis, also confirmed the unidimensionality found in the original and in the Turkish study (Erdogan & Arsal, 2015; Nauta, 2007). Furthermore, in South Korea, the authors found the measure to be gender invariant, which along with the previous reported findings confirmed the AMSS suitability to evaluate academic satisfaction in South Korea.
In Brazil, the measure’s name was modified from “Academic Major Satisfaction Scale (AMSS)” to “Academic Course Satisfaction Scale (ACSS)” due to the term “major” not being applicable to the Brazilian higher education system. In this context, students opt for a course since the selective process and their degree structure is guided by guidelines that are specific to each course, without any type of “emphasis”.
Overview of the Higher Educational System in Brazil
In Brazil, in recent years, a grown of policies to encourage access to higher education has been observed, which has, in fact, resulted in a considerable increase of the number of students enrolled in both public and private universities. The 2016 Census of Higher Education (National Institute of Educational Studies and Research Anísio Teixeira - Inep) revealed the number of enrollments in federal universities increased in about 105.8%. Nevertheless, degree abandonment, enrollment cancellation, course transfers and changes have also increased (INEP, 2016). This data demonstrates that, although university admissions increase, choosing a satisfactory career remains a major challenge for those who want to enter higher education.
University evasion has shown to be a complex phenomenon with multiple factors, such as dissatisfaction with the course and with the academic experience (Bardagi & Hutz, 2012). In addition, problems with academic activities, relationships with colleagues and tutors (Bardagi & Hutz 2012), students’ perception that the degree program does not match their interests, failure in initial subjects (Barroso & Falcão, 2004) are also pointed out in literature as aspects that may influence students’ academic dissatisfaction, resulting in academic evasion.
Based on the aforementioned, to understand the predictors and consequents of academic satisfaction in Brazil, a measure with good psychometric qualities to evaluate such construct is necessary. Considering the parameters gathered in other countries for the Nauta’s (2007) AMSS, this measure may be appropriate to evaluate academic satisfaction in Brazil. Thus, this study aims to adapt the AMSS to Brazil by gathering evidence of construct validity (factorial and convergent), internal consistency and factorial invariance in two studies. Study 1 aimed to verify construct validity, internal consistency and estimate items parameters through Item Response Theory (TRI). Study 2 sought to confirm AMSS’s one-factor structure, test convergent validity and measurement invariance across genders.
Study 1: Exploratory factor analysis and item parameters analysis
Method
Participants
Participants were 294 undergraduate students, mostly female (56.7%), attending their first or second year of higher education, aged from 16 to 57 years (M= 21.92, SD = 6.27), studying Journalism (23%), Visual Arts (12%), Economics (12%), History (11%) and Pedagogy (10%). As a convenience sampling (non-probabilistic) technique was employed, participants were those who agreed to participate in the online survey. As inclusion criterion, only Brazilian university students were considered.
Measures
Participants were given a booklet containing demographic questions (e.g. gender, age, course year, etc.) and the Brazilian version of the Academic Major Satisfaction Scale (AMSS). For the Brazilian version, term “major” was replaced with “course” as it seems more appropriate to this context, resulting in the Academic Course Satisfaction Scale (ACSS) in the Portuguese version. The AMSS is a six-item self-report measure developed by Nauta (2007) to assess global academic satisfaction (e.g. I often wish I hadn’t gotten into this course; I feel good about the course I’ve selected), administered using a 5-point Likert scale (1 = strongly disagree; 5 = strongly agree).
To translate the English version into Portuguese, we used the back-translation procedure. First, a bilingual researcher translated the instructions, scale of response and the items of the original English version to Portuguese. Following that, another researcher (also bilingual) undertook the back-translation, translating the items back into English. Finally, a third researcher (also bilingual) compared both translations and did not suggest any substantial changes. The semantic validation was verified in a group of 15 junior high school students, who were invited to collaborate voluntarily. After careful analysis of the instructions, the response scale and the content of the items, the Portuguese version did not require any substantial amendments.
Procedure
Once the Brazilian version of the AMSS was ready, the authors proceeded to designing its online version. Specifically, the questionnaire was created on LimeSurvey research platform and the study was later advertised on social network (e.g. Facebook, Instagram). The link for participating in the research was made available for the period of 60 days, and the researcher responsible for the study was available for any clarifications via social networks or via email. Prior to completing the survey, participants were required to read and agree with the terms of free and informed consent. We received approval for the research from the Ethical Committee for Scientific Research of the Federal University of Mato Grosso do Sul (Ethics code - 1.804.289, CEP/UFMS). Participation was voluntary and the average time to complete the instrument was around 15 minutes.
Data analyses
The Factor 10.5.03 software (Lorenzo-Seva & Ferrando, 2006) was used to perform an exploratory factor analysis (Minimum Factor Analysis, Shapiro & ten Berge, 2002) using Promin oblique rotation and the Hull method (HM) as a criterion of factor retention (Lorenzo-Seva et al., 2011), which aims to identify the factorial structure that best adjusts to the data, observing their respective degrees of freedom. In addition, polychoric correlation matrices (Holgado-Tello et al., 2010) were used. The reliability of the Mislevy factors (Mislevy & Bock, 1990) was evaluated and values above 0.70 are considered satisfactory (Kline, 2000). To analyze the parameters of the items via item response theory (IRT), we used the ‘R’ statistical program. The AMSS uses a 5-point response format, for this the Graded Response Model (grm function) of IRT was applied (Samejima, 1969).
Results
Before analyzing the items via IRT, an Exploratory Factorial Analysis was performed to estimate the measure’s factor structure. Initially, we confirmed the adequacy of this analysis by calculating the relevant indexes [KMO = .85 and Bartlett, χ 2 (15) = 967.90, p <.001]. Next, we applied the Minimum Rank Factor Analysis to extract the factors and the Hull method (CFI = .98, df = 9) to select the number of common factors. The results clearly showed a solution of one factor (Table 1).
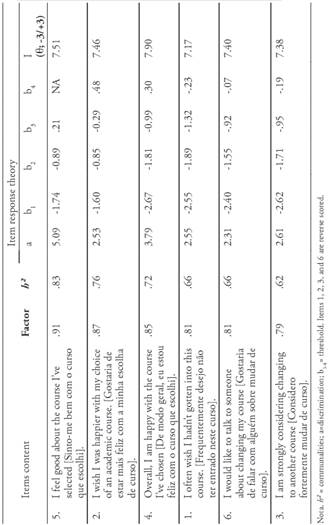
As shown in Table 1, all the items presented saturations above |.70|, varying from .79 [Item 3. I am strongly considering changing to another course (Item 3. I am strongly considering changing to another course (Considero fortemente mudar de curso)] to .91 [(Item 5. I feel good about the course I’ve selected (Sinto-me bem com o curso que escolhi)], resulting in an eigenvalue of 4.41, explaining 74% of the total variance. The coefficient of reliability (Mislevy) was .87, a value above the recommended in the literature (Kline, 2000). Next, we performed an IRT to evaluate the items parameters by testing the capacity of the six items to discriminate between the participants and the spread in the thresholds (5-point response scale = 4 thresholds). Results indicated that the items’ ability to discriminate between people were strong (>1.70, Baker, 2001) with an average of 3.14 (SD = 1.08), ranging from 5.09 (Item 5. I feel good about the course I’ve selected) to 2.31 (Item 6. I would like to talk to someone about changing my course). The most discriminator items (see parameter a) were items 5 and 3.
The item threshold (difficulty parameters), also called item difficulty, describes where the item functions along the trait (Baker, 2001). A low theta (b1-4) indicates that the item is “easier” to answer, and a higher theta indicates an item that is more “difficult” to answer. The results demonstrated that items 5 (I feel good about the course I’ve selected, M = -.60) and 1 (I often wish I hadn’t gotten into this course, M = -1.49) presented the lowest and highest average thresholds, respectively. Overall, the scale offered 44.82 of information in the range of -3 to +3, with item 4 as the most informative [I (θ; -3 / + 3) = 7.90]. These results confirm the one-factor solution and shows that the items are suitable to measure academic satisfaction.
Discussion
Study1 aimed to provide preliminary evidence of AMSS suitability in Brazil regarding construct validity, internal consistency and parameter of items through TRI. The minimum factor analysis (Shapiro & ten Berge, 2002), using the Hull-CFI retention method identified a uni-factorial structure equivalent to that of the original (Nauta, 2007) and adapted versions (e.g., Sovet et al., 2014). Furthermore, internal consistency index was superior to the recommended in the literature (Kline, 2000). The measure discrimination was also above the recommended cut-off point, such that most of the items were highly discriminant (a> 1,70; Baker, 2001), demonstrating that they satisfactorily differentiate between participants with different levels of the trait around their location. Nevertheless, because the analyses performed were prominently exploratory, we carried out a second study, described next.
Study 2: Confirmation of the factor structure, convergent validity and factorial invariance of the AMSS across gender
Participants
Participants were 599 undergraduate students from Brazil, aged from 18 to 71 years (M = 23.3, SD = 6.35), mostly female (68.3%), single (83.1%), catholic (39.2%) and attending the first year of their undergraduate course (30%). This was a convenience sample (non-probabilistic).
Measures
The participants received a booklet containing the AMSS, demographic questions (described in Study 1) and other two scales:
The Positive Affectivity-Negative Affectivity Scale (PANAS, Watson et al., 1988) it is composed of 20 items equally distributed to measure positive and negative affect, using a 5-point scale that ranged from 1 (Very slightly or not at all) to 5 (Extremely).
The Satisfaction with Life Scale (SWLS, Diener et al., 1985) is composed by five items (e.g. In most ways my life is close to my ideal; The conditions of my life are excellent, and I am satisfied with my life). These items are answered on a 7-point scale, ranging from 1 (strongly disagree) to 7 (strongly agree).
Procedure
The same procedures for data collection and ethical parameters from Study 1 were reapplied. Participation was voluntary and the average time to complete the questionnaire was around 20 minutes.
Data analysis
‘R’ statistical program (R Development Core Team, 2011) was used to calculate descriptive statistics and correlations (convergent validity). Mplus software (version 6) was used to conduct the confirmatory factor analysis (CFA) and analysis of factorial invariance (FI) across gender. For the CFA, we used the Weighted Least Squares Means and Variance adjusted (WLSMV; Muthén et al., 1997) as the extraction method. In the CFA, multiple indicators of adjustment were taken into account, such as CFI (Comparative Fit Index), TLI (Tucker-Lewis Index), RMSEA (Root Mean Square Error of Approximation) and its 90% confidence interval (90% CI). To estimate the factorial invariance, we consider additionally, ΔCFI and ΔRMSEA (factorial invariance) (Byrne, 2010; Cheung & Rensvold, 2002; Tabachnick & Fidell, 2013; Milfont & Fischer, 2010). In addition, convergent validity between the AMSS and the PANAS and SWLS was calculated (Pearson’s correlations) and we anticipated significant correlations between the measures.
Results
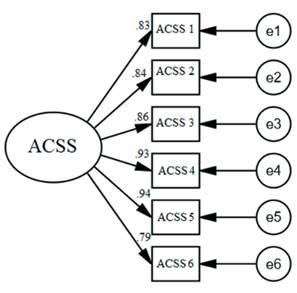
Considering the structure observed by Nauta (2007), and the findings of Study 1, we tested the factor structure of the AMSS with the six items loading on the same general factor. The results confirmed the uni-factor structure of the scale [CFI = .98; TLI = .96; RMSEA = .235 (90% CI = .213, .258) and e χ² (9) = 306.09, p < 0,001]. All items presented saturations (lambda) different from zero (λ ≠ 0; z > 1.96, p < .001), with values varying from .94 [Item 5. I feel good about the course I’ve selected] to .79 [Item 6. I would like to talk to someone about changing my course]. These results suggest that, overall; the theoretical model fits the data. A summary of the findings is shown in Figure 1.
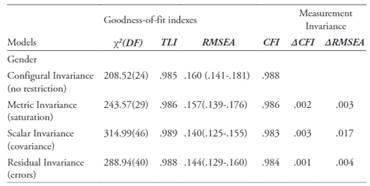
After testing the uni-factor structure of the adapted version, we verified its invariance across genders. Overall, the results presented satisfactory indices for factorial invariance (Chen, 2007). The initial model without restrictions was tested as baseline for the investigation of configural invariance. Subsequently, loading restriction (saturation), covariance, and residuals (errors underlying the items) were tested. Even though the ∆RMSEA (scalar invariance = .017; ≥ .01) values were not entirely satisfactory, a comparison between the model without restrictions and all others indicated satisfactory results regarding ∆CFI (≤ .01), suggesting that scale structure is invariant across gender.
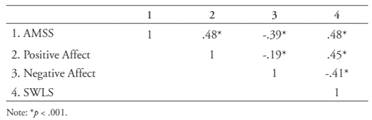
To provide convergent validity evidence for the AMSS we used the PANAS and SWLS, all variables that contribute to the psychological well-being. Thus, as expected, the AMSS presented significant correlations with satisfaction with life (positive), positive affect (positive) and negative affect (negative). The results are described in Table 3.
Discussion
Study 2 aimed to gather more robust evidence on the factor structure, convergent validity and factorial invariance of the AMSS across gender. The results confirmed the adequacy of the one-factor structure (without requiring any error correlations), presenting satisfactory adjustment indicators (e.g., CFI, TLI, GFI < .90) (Byrne, 2010; Tabachnick & Fidell, 2013). Regarding the factorial invariance, results indicated configural (without restriction; the model exhibited the same factor structure across groups), metric (the factor loadings were equivalents across groups), structural (covariance), and residual (error variance) invariance. For the convergent validity, we correlated the AMSS with the SWLS and Affects (positive and negative) and the link between these two variables was significant, attesting the convergent validity of the AMSS.
General discussion
Students’ academic satisfaction levels is an important variable for understanding students’ academic development (Erdogan & Arsal, 2015; Sovet et al., 2014). Because academic satisfaction may help understand the performance and engagement of students in their undergraduate course and in their future jobs, to count with an appropriate measure of academic satisfaction in Brazil seems relevant. Thus, this study sought to gather evidence of psychometric suitability of the AMSS by evaluating its validity (factorial and convergent), internal consistency and measurement invariance. Our findings suggest that the AMSS is appropriate to estimate satisfaction of Brazilian college students.
However, as any research project, this study presents some limitations that, although do not invalidate our results, should be discussed. One limitation is the usage of self-report measures given that participants may falsify their responses when completing this type of measures, giving biased answers that do not correspond to the reality, which may be a result, for example, of social desirability. Nevertheless, this limitation is not restricted to the AMSS, but it is an issue of most of psychological instruments. This issue could be addressed by using alternative measures, such as implicit measures (Gawronski et al., 2017). Furthermore, another potential limitation convenience nature of our sample, composed by those individuals that voluntarily decided to take part in the study, which may limit the generalization of the findings. Therefore, more studies are necessary in order to overcome these limitations, such as studies using larger and more diverse samples, comparing, for example, different Brazilian states.
Regarding the main contributions of this study, in Study 1, we gathered evidences of psychometric suitability on an exploratory level through EFA using Minimum Rank Factor Analysis estimation (Shapiro & ten Berge, 2002), applying the Hull method (CFI). The results corroborated the psychometric qualities of the current scale, confirming its unifactorial structure, observed in previous studies (Erdogan & Arsal, 2015; Nauta, 2007; Sovet et al., 2014). The scale reliability demonstrated to be adequate, presenting indexes above the recommended in the literature (α >.70, Hair et al., 2009), a precision index (α = .87) below its original version (α = .94), but similar to the one found by Sovet et al. (2014; α = .87) in South Korea and superior to the index observed in Turkey (Erdogan & Arsal, 2015; α = .83).
Besides, the items’ discriminative power was above the cut-point proposed in the literature, such that all the items presented higher discriminative power (a > 1.70; Baker, 2001), i.e., they are able to discriminate accurately the magnitude of participants’ latent trait. Such evidence obtained from TRI reinforce the discriminatory power of the items, providing extra evidence to support the adequacy of the AMSS in addition to previous studies on this measure.
Study 2 aimed at replicating the model found in Study 1 and exploring its goodness of fit in a different sample. The findings confirmed the unifactorial structure, presenting satisfactory indexes of fit (e.g., CFI e TLI >,90; Tabachnick & Fidell, 2013), similar to those of the original solution (Nauta, 2007). Therefore, it seems clear the presence of one general factor that represents academic satisfaction assessed by the AMSS.
The convergent validity was also evaluated by correlating the AMSS with the PANAS (Watson et al., 1988) and with the SWLS (Diener et al.,1985). We expected positive correlations between the positive affects dimension and life satisfaction, and negative associations with the negative affects dimension, because individuals with higher academic satisfaction tend to be more satisfied with life in general and are more prone to endorse positive affects. In fact, those people that score higher on life satisfaction tend to be more satisfied with their jobs (Cox et al., 2015; Judge et al., 2017; Smith et al., 2017).
Consistent with the findings of Sovet et al. (2014), we verified that the AMSS is also gender (male and female) invariant in Brazil on the configural, metric, scalar, and residual levels. It is important to highlight that the scalar invariance ΔRMSEA was only slightly superior (ΔRMSEA = .017) to the recommended (ΔRMSEA < .01). The remaining indexes, however, were all appropriate, obtaining values within the acceptable range (ΔRMSEA and ΔCFI < .01; Byrne, 2010; Tabachnick & Fidell, 2013; Milfont & Fischer, 2010).
In sum, based on the literature reviewed and on the current empirical findings, the relevance of a psychometrically suitable measure to assess academic satisfaction in Brazil is evident. Finally, we acknowledge that exploring the psychometric qualities of this measure in Brazil should not be limited to this study. Future research projects are necessary to further investigate the suitability of the AMSS in this country using larger and heterogeneous sample and applying implicit measures that could minimize the bias inherent to self-report instruments (e.g. social desirability), which would help to generalize the empirical findings beyond a given study. In addition, studies exploring the temporal stability of the measure and investigating potential correlates of academic satisfaction are also necessary to allow for the elaboration of interventive strategies that could assist the students to better adjust to the academic context.

