


 Inglés (pdf)
 Articulo en XML
 Referencias del artículo
 Enviar articulo por email
 Citado por SciELO
  Similares en
SciELO
Similares en
SciELO 
 Permalink
Sexual intercourse is one of the main pathways of transmission for HIV and is the main cause of infection among young in Colombia (Instituto Nacional de Salud, 2019), several strategies are developed to recognize condom use as the only effective rate against both STIs, and pregnancy (UNFPA, 2015).
Studies showed that variables with greatest prediction about condom use include attitudes towards condom (Fergunson, 2011; Albarracin et al., 2001; Diez et al., 2000; Sheeran et al., 1999). Other psychosocial key variables are knowledge about HIV and other ITS´s, (Vallejo-Medina et al., 2018; Yi et al., 2018), subjective norms or beliefs (Vincent et al., 2016; Ellis et al., 2015) intention to use (Morales et al., 2019; Visser, 2017; Farrington et al., 2016; Widman et al., 2019), communication about condom (Cassar , 2019; Gause et al., 2018; Caouette et al., 2018; Horan & Cafferty, 2017) and condom use self-efficacy (Brien et al., 1994; Forsyth et al., 1997; Barkley & Burns, 2000; Asante & Doku, 2010; Shaweno & Tekletsadik, 2013; Sanchez-Mendoza et al., 2020). Intentions to use condom and subjective norms or beliefs are usually measured with single questions, while others are assessed trough standardized scales. In Colombia, some versions are adapted to measure such variables (Plaza-Vidal et al., 2020; Morales et al., 2019; Morales et al., 2018; Vallejo, 2017; Vallejo et al., 2016; Soler et al., 2016) but not to measure condom use self-efficacy yet.
Despite the importance of assessing the content validity, most psychometric studies skip this step (Vallejo-Medina et al., 2019; Mansouri et al., 2019; Gil-Llario et al., 2019) in fact, most psychometric works just give Cronbach’s alpha and an Exploratory Factor Analysis - with main components - (Gil-Llario et al., 2019; Golub & Gamarel, 2017). Content validity is usually obtained through the inter-judge agreement, frequently three expert judges are needed (appointment) although this number of judges is not an agreement (Cronbach, 1971; Carmines & Zeller, 1979; Haynes et al., 1995; Polit & Beck, 2006; Carretero-Dios & Pérez, 2007; LeBreton & Senter, 2008). In any case, it does not seem a difficult requirement to reach for a researcher. Some of the most popular estimators calculate consensus among judges are: a) the kappa statistic used to test interrater reliability, and represent the extent to which the data collected are correct representations of the variables measured, taking into account the possibility that two judges on categorical (or ordinal) data actually guess on at least some variables due to uncertainty (Cohen, 1960) is easily calculated through statistical programs like SAS, SPSS or STATA; b) iota coefficient, used when a variety of targets are rated by different set of judges, is an index of interrater agreement of quantitative or nominal multivariate observation (Janson & Olson, 2001); c) Kendall’s coefficient of concordance, used as an index of interrater reliability of ordinal data (McGraw & Wong, 1996) and, d) Coefficient of content validity (Aiken’s V), applied to summarize the ratings of expert judges through estimates of content validity by means of coefficients (Aiken, 1985).
At the mathematical or technical level, they do not seem difficult indicators to obtain either. So, why do so many researchers skip this step that minimizes the problems of construct validity so much? A possible explanation may be related to the number of words in the article, for example, an evaluation on a table of specifications that measures five attributes of 20 items by five judges, assumes at least 500 words for a table. It is possible to save words by highlighting trends, but much relevant information would be lost.
To achieve the aim, the authors made an interrater agreement using alluvial visual representation in R, a tool that shows a lot of relevant information about items marking and agreement between judges.
Method
Participants
On one hand, participants took place in this study as follows: two translators, five researchers with adequate expertise in sexuality, and three bilingual psychologists, whom translate and adipate linguistically the CUSES (see procedure). On the other hand, twelve professionals (three sexual health specialists, four psychometrics, one public health PhD and three sexologists) were asked to evaluate the translation and cultural adaptation of the CUSES in four attributes and they assessed the content validity, and some item properties through a specification table.
Instruments
Condom Use Self-Efficacy Scale (CUSES, Brien et al., 1994). Evaluates a person’s feelings of confidence about the possibility of buying condoms, putting them on, taking them off, and negotiating their use with a new sexual partner. The CUSES, in its first version, had 28 items with five Likert-scale response alternatives ranging from “Strongly disagree” = 0, to “Strongly agree” = 4. It also had seven items coded in reverse. These 28 items grouped in the initial application into 15 factors. Cronbach’s alpha was .91 and test re-test correlation after two weeks .81 (Brafford & Beck, 1991). Later studies propose changes in the factorial structure of the scale, reducing both, items, and factors (Brien et al., 1994; Forsyth et al., 1997; Barkley Jr. & Burns, 2000; Asante & Doku, 2010; Shaweno & Tekletsadik, 2013,) with Cronbach’s alpha between .66 and .92 in all new versions.
Abbreviated version has 15 items with five response alternatives in Likert scale ranging from Strongly disagree = 0, to Strongly agree = 4, seven items coded in reverse. It has four factors, Mechanics (e.g., “I feel confident in my ability to put a condom on myself or my partner”; Cronbach´s alpha = .79), Partner’s disapproval (e.g., “I would not feel confident suggesting using condoms with a new partner because I would be afraid he or she would think I have a sexually transmitted disease”; Cronbach´s alpha = .71), Assertive (e.g., “I feel confident in my ability to suggest using a condom with a new partner”; Cronbach´s alpha = .73) and Intoxicants (e.g., “I feel confident that I would remember to use a condom even if I were high”; Cronbach´s alpha = .82).
Adapted version of the scale can be consulted in supplemental materials.
Procedure
In the first part of the study a team of psychologist and translators, translated and adapted linguistically the CUSES for use with Colombian Spanish speaking participants. Translators used intercultural adaptation guidelines for psychological measurement instruments based on Muñiz et al. (2013), as well as AERA, APA, and NCME (2014) standards.
Twelve professionals were asked to evaluate content validity and some item properties through the following criteria: a) representativeness, item’s representative degree of the self-efficacy variable in condom use; b) comprehensiveness, assessment of whether the item is properly understood; c) interpretability, number of item’s interpretations; d) clarity, item’s conciseness / direct; and e) belonging, construct’s component to which the item belongs. Four construct’s components were the options: Appropriation (confidence to acquire and use condom in a sexual intercourse), Partner’s disapproval (confidence to deal with the possible rejection of a sexual partner), Assertiveness (individual’s perceived ability to be assertive about the use of condoms) or Intoxication - “Self-control” in the Spanish version- (confidence to use a condom under the effect of substances that alter consciousness or sexual excitement). These evaluations enabled a final version of the scale to be reached.
Data analyses
This study was conducted with R (R Core Team, 2017) under RStudio interface (RStudio Team, 2016) content validity and other items properties were plotted using “ggplot2” package, “a system for declaratively creating graphics using the grammar of graphics” (Wickham et al., 2019. p. 1), an alluvial diagram, with “ggalluvial” function as a categorical data visualization technique generated its graphical representation, consist of axes, strata, alluvial and lodes (Brunson, 2019).
An axis is a dimension in which the data are vertically grouped at a fixed horizontal position, as is shown in the chart below (Figure 1) these correspond to representativeness, comprehensiveness, interpretability, and clarity. The strata are related to the categorical options for each dimension, for example, in representativeness, are four categories: none, low, moderate, and high. Finally, the alluvial is the horizontal-coloured spline and, each alluvium represents the fixed value of the dimension evaluated by the judge for each item.
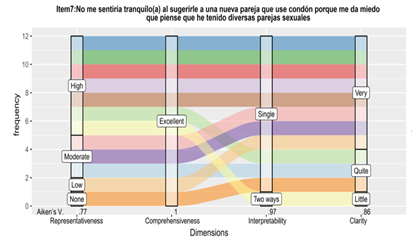
The Alluvial diagram is a variant of a Parallel Coordinates Plot (PCP) but for categorical variables, these are assigned to vertical axes that are parallel. Values are represented with blocks on each axis and observations are represented with alluvia spanning across all the axis (Palma & Masera, 2018). An alluvial diagram allows us to visualize the interconnection of frequencies, for this study, those related to the categories stablished in the four dimensions of evaluation of the CUSES items. This function visualizes categorical data with accurately convey proportions to viewers from tabular (or array) form, popular for storing data with multiple categorical dimensions. Raw data and syntaxes can be consulted in: https://github.com/CUSES/CUSES-Validation
For a better understanding, we present the description of the alluvial data and the explanation of the syntaxes for this study. The image below (Figure 2) reflects the visual layout of an alluvial plot for item 1. Each row corresponds to a judge whose observations take a specific value in each category, and each category has its own column (R: representativeness; C: comprehensiveness; I: interpretability; Cl: clarity). This same layout of the information was done for each item in the same layout and later converted to the format in which the base function can be executed in R as.data.frame().
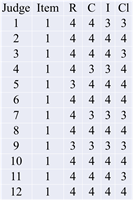
First, open the RStudio database, install and use the following packages from the library, ggalluvial, ggplot2 and ggpurb. Now set factors in each item, as follow, in parenthesis are the categories chosen by judges for the item and organize the order in which the data must be presented, for this study begins with judge1 and ends with judge12. Add as many labels as need, (“High”, “Moderate”, “Low”, “…”))
it1jueces$Rord <- factor(it1jueces$representativeness, c(“High”, “Moderate”))
it1jueces$Cord <- factor(it1jueces$Comprehensiveness, c (“Excellent”, “Good”))
it1jueces$Iord <- factor (it1jueces$interpretability, c(“Single”, “Two ways”))
it1jueces$Clord <- factor (it1jueces$Clarity, c(“Very”, “Quite”))
it1jueces$Jord <- factor (it1jueces$Jugde, c(“judge1”, “judge2”, “judge3”, “judge4”, “judge5”, “judge6”, “judge7”, “judge8”, “judge9”, “judge10”, “judge11”, “judge12”))
Next, create the figure by applying the following steps, start naming the figure and using the database in the format as.data.frame; establish the axes names and characteristics; define the alluvium characteristics, as to fill, width, space between axis, labels, categories, title, and, the desired appearance like colour.
Figure1<-ggplot(as.data.frame(it1jueces),
aes(y = frec, axis1 = Rord, axis2 = Cord, axis3 = Iord, axis4 = Clord)) +
geom_alluvium(aes(fill = Jord), width = 1/8) +
geom_stratum(width = 1/8, alpha=0.5) +
geom_label(stat = “stratum”, label.strata = TRUE, size = 3) +
scale_x_discrete(limits = c(“representativeness”, “Comprehensiveness”, “interpretability”, “Clarity”), expand = c(.1, .1)) + scale_fill_brewer(type = “qual”, palette = “Paired”) +
ggtitle(“Item2: Tengo confianza en mi capacidad de ponerme un condon o ponerselo a mi pareja”)+ xlab(“Dimensions”)+
theme(plot.title = element_text(lineheight=.8, face=”bold”,hjust = 0.5, color = “black”, size = 10)) + coord_cartesian(ylim=c(0, 12)) + scale_y_continuous(breaks=seq(0, 12, 2))
Include the Aiken’s Value in each figure, it is obtained by means of a formulated Excel sheet, in which the category chosen was multiplied by the number of judges who awarded it, divided by the total number of judges minus 1 and, this value divided into 3. The resulting coefficient of this value can have rates between 0 and 1, the closer the value is to 1, the greater the validity of content the item will have. For example, for item 1, the formula was as follows:
=(((( category [4] * number of judges who awarded it [12])+( category [3]* number of judges who awarded it [1]))/12)-1)/3
Then integrate all the independent figures into a single one using the following syntaxes, this makes it possible to choose the number of columns and rows to present the figures.
Sfig1<-ggarrange(FJ1, FJ2, FJ3, FJ4,FJ5,FJ6, FJ7, FJ8, FJ9, FJ10, FJ11, FJ12, FJ13, FJ14, FJ15, common.legend = TRUE, ncol = 3, nrow = 5)
Afterwards, analyse the data base to prepare the figure 2, include the factors information and the order in which the data will be displayed for example from least to greatest.
JA2$Itemreord <- factor(JA2$Item, c(“item1”, “item2”, “item3”, “item4”, “item5”, “item6”, “item7”, “item8”, “item9”, “item10”, “item11”, “item12”, “item13”, “item14”, “item15”))
JA2$Factoreord <- factor(JA2$Factor, c(“Appropriation”, “Partner disapproval”, “Assertiveness”, “Self control” , “Missing”))
mutate(JA2$Item = stats::fct_relevel(JA2$Item, “item1”, “item2”, “item3”, “item4”, “item5”, “item6”, “item7”, “item8”, “item9”, “item10”, “item11”, “item12”, “item13”, “item14”, “item15”)) %>%
Finally, make the figure 2 through the following syntaxes, define the information that goes on the axes and assign the desire labels, size and appearance characteristics.
F2<-ggplot(as.data.frame(JA2),
aes(y = frec, axis1 = Itemreord, axis2 = Factoreord)) +
geom_alluvium(aes(fill = Factoreord), width = 1/8) +
geom_stratum(width = 1/8, alpha=0.5) +
geom_text(stat = “stratum”, label.strata = TRUE, size = 3) +
scale_x_discrete(limits = c(“Factor”), expand = c(.1, 0)) +
scale_fill_brewer(type = “qual”, palette = “Set3”) +
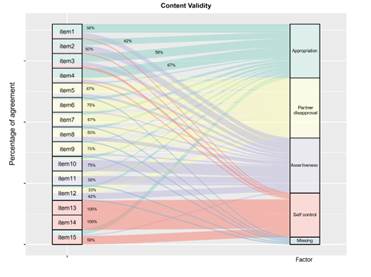
ggtitle(“Content Validity”)+
xlab(“Criterio”)+
theme(plot.title = element_text(lineheight=.8, face=”bold”,hjust = 0.5, color = “black”, size = 10))
Results
Figure 3 shows the observations of the expert judges and the coefficient of content validity for inter-observer reliability analysis. Visual representation illustrates the behaviour of each judge in the evaluation process as well as the evaluation of each judge against each criterion by item. For instance, we can observe how judges 1, 2, 4 and 6 had an acquiescent trend to value items as “perfect”. While judges 8 and 11 had a more critical view of the items content. Furthermore, item 2 and 5 -despite Aiken V value is the same for comprehensiveness and interpretability (item 2) and, representativeness and clarity (item 5)- but labels of the characteristic representing those values with different weight.
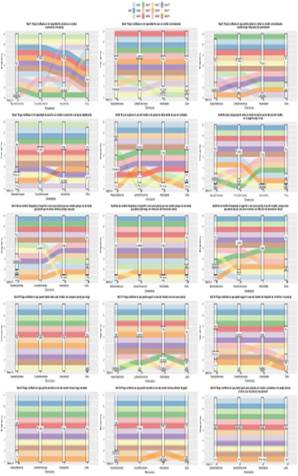
Figure 4 shows the percentage of agreement between judges against the factor to which each one belongs. An additional benefit of using this visualization is that is easier to observe items codominance in two dimensions, opposite to a classical numerical presentation. Thus, items 1, 2, 3 and 4 have mixed qualitative weights within appropriation and assertiveness, and item 15 with appropriation and self-control. Implications for FA will be discussed.
Discussion
The objective of the present study was to show a visual representation about some item’s properties -content validity included- trough R studio. For those purpose, after translating and adapting the CUSES, twelve professionals were asked to evaluate its translation and cultural adaptation in four attributes and four factors. Semantic definition of the construct to be measured facilitates its syntactic definition and decreases the likelihood of ambiguities in the adaptation process; also state that its presentation through a specification table facilitates the evaluation that judges do, although it is common to ignore it (Carretero-Dios & Pérez, 2005).
Present study graphic representation provides helpful information about the distribution of the weights in each criterion evaluated by judges. It also displays trends of each judge evaluation and contrast the value of coefficient of content validity according to criteria. As could be seen here, three judges may not be a good number. Presence of missing data, acquiescence of some experts in the “best label”, or an extreme criticism may determine the final agreement. Thus, we suggest using a higher number of experts. Additionally, the presentation of the test specifications is usually carried out through a table that summarizes the general data of the judge’s evaluation. Perhaps limited by the manuscript words limitation, this prevents describing in depth the behaviour of the item in relation to the global scale and of each judge in relation to the set of judges. This feature is fixed with the use of the alluvial plot, since this allows identifying differentially the values attributed to each dimension and the relevance of each one in relation to the set of the items.
It is known that from a clear semantic definition of the construct it is possible to have better indicators of content validity, which in turn is related to the construct validity (Carretero-Dios & Pérez, 2007). Thus, with the results proposed here it is easy to see the possible overlap of some items in several factors. Despite, as happened with the versions by Brien, Thombs, Mahoney y Wallnau (1994), Asante and Doku (2010) and Shaweno and Tekletsadik (2013), four factors seems to set the scale (Appropriation, Partner´s disapproval, Assertiveness and Self-control), although this is different from results obtained in Thomas et al. (2000) with three factors. Visually is noted that some items may have relationships with two factors. In advance we could anticipate the using of Exploratory Structural Equation Modeling (ESEM) or by using rotations that force the positioning of an item on one of the factors. If item content is related to two dimensions, a rewording may help to clarify its factor. So that items with high scores are obtained even if judges do not agree about the attribute judged, or items with low scores can be obtained, although the judges are agreeing with item’s attribute
This study suggests the use of a graphic representation to show the agreement between the judges, however the numerical indicators used here were inserted afterwards. Thus, we still do not have an R package that matches the graphical display with the numerical descriptor, something that could be addressed in the future.

