


 Inglês (pdf)
 Artigo em XML
 Referências do artigo
 Enviar este artigo por email
 Citado por SciELO
  Similares em
SciELO
Similares em
SciELO 
 Permalink
Scientific research is an important activity aimed at generating new knowledge and solving practical problems in the real world. As such, it constitutes a fundamental means to transform and improve the lives of human beings (Khan et al., 2021). Along the same lines, nowadays, research is widely promoted in the educational field and is considered a key competence for the training of professionals of high academic level (Aldana et al., 2020; Medina, 2018).
According to Medina (2018), research training is one of the core tasks of universities and, consequently, research courses are part of most curricula in higher education. However, despite their importance research courses are often the most difficult and least preferred courses for many undergraduates (Murtonen, 2005; Murtonen & Lehtinen, 2003; Papanastasiou, 2014; Sizemore & Lewandowski, 2009).
According to Earley (2014), most students who take introductory research methods courses often do not perceive the relevance of such courses to their lives and professional training, feel anxious about its level of difficulty, are not interested and motivated to learn the class material, and exhibit poor attitudes and misconceptions about research. For this reason, it is important for teachers to be able to assess the attitudes of their students at the beginning of these courses in order to make decisions and implement strategies aimed at promoting research learning and academic achievement in these subjects (Murtonen, 2005; Murtonen & Lehtinen, 2003; Papanastasiou, 2005; Wishkoski et al., 2022; Younas et al., 2022).
According to Eagly & Chaiken (2007), attitudes are those psychological tendencies that are expressed by evaluating a particular entity or object as favorable or unfavorable. These develop from prior perception or exposure to a specific entity or object, which predisposes people to respond consistently to the entity on subsequent occasions. In that sense, attitudes towards research refer to cognitive, affective and behavioral predispositions towards the field of research, regardless of orientation towards quantitative, qualitative or mixed methods (Papanastasiou, 2014).
These attitudes may fluctuate throughout the academic semester (Sizemore & Lewandowski, 2009; Wishkoski et al., 2022) and play an important role in the difficulties students experience towards research methods courses (Murtonen, 2005; Murtonen & Lehtinen, 2003) and their academic performance in them (Oguan et al., 2014). Probably, because attitudes toward research influence interest toward research courses (Gredig & Bartelsen-Raemy, 2018) and the academic effort devoted to learning activities specific to these courses (Mensah et al., 2023).
Because of its importance, researchers have developed different instruments to measure attitudes toward research. A quick review of the literature reveals at least three types of measures. Instruments that assess attitudes toward research: (a) in a field-specific manner, that is, in a particular field such as architecture (Obeidat & Obeidat, 2023), education (Ozturk, 2011), nursing (Björkström & Hamrin, 2001), stomatology (Holman et al., 2014), medicine (Díaz et al., 2008; Siemens et al., 2010), etc.; (b) globally, that is, instruments whose items could be applied in any field (Aldana et al., 2020; Papanastasiou, 2005, 2014), and (c) others, focused on different research methods, for example, qualitative (Roberts & Povee, 2014b) or mixed (Roberts & Povee, 2014a) research.
The scale developed by Papanastasiou (2005, 2014), is one of the most widely used instruments to measure attitudes towards research globally. These types of measures are particularly useful for assessing attitudes toward research in undergraduate students from different academic programs and majors. Indeed, both the original 32-item version and the revised 13-item version of this instrument have been used and analyzed in different samples of students in Cyprus (Papanastasiou, 2005, 2014; Papanastasiou & Schumacker, 2014), the United States (Howard & Michael, 2019; Walker, 2010), South Africa (Van Der Westhuizen, 2015), the Netherlands (Jansen et al., 2022), Canada (Morgenshtern et al., 2011) and Pakistan (Shaukat et al., 2014).
Initially, Papanastasiou (2005) developed the Attitudes Toward Research Scale (ATR) to measure attitudes toward research in a global and multidimensional way. This first version was composed of 32 items with a 7-point Likert-type response scale (1 = “strongly disagree” and 7 = “strongly agree”). The ATR was applied to 226 students of a course on research methodology in education at the University of Cyprus. The author performed an Exploratory Factor Analysis (EFA) and found a factorial structure of five dimensions that explained 66.25% of the total variance. The dimensions were (a) research usefulness in profession, (b) research anxiety, (c) positive attitudes toward research, (d) relevance to life, and (e) research difficulty. Finally, acceptable and excellent Cronbach’s alpha coefficients were obtained, ranging from .71 to .95.
Subsequently, Papanastasiou & Schumacker (2014) applied a Rasch model to the ATR, finding that two of its items did not present good fit values and, for that reason, recommended eliminating them and using a second version of 30 items. Finally, Papanastasiou, (2014) conducted a review of the psychometric properties of the ATR in a similar sample to that of the original study consisting of 317 students. This author performed a CFA to test a three-factor correlated model, which obtained a good fit (χ2 = 160.23 [gl = 62, p<0.001]; χ2/gl ratio = 2.58; NFI = 0.95; RFI = 0.92; CFI = 0.97; IFI = 0.97; TLI = 0.95; AIC = 244.23). Also, good and excellent Cronbach’s alpha coefficients were found, which ranged from .86 to .92. The final version of this scale (R-ATR) consisted of 13 items grouped into three dimensions: (a) research usefulness, (b) research anxiety and (c) positive predisposition towards research.
Unlike ATR, R-ATR has received less attention in the literature. In the United States, Howard & Michael (2019) evaluated 128 master’s and doctoral students in clinical psychology enrolled in statistics and/or research methods courses and found a moderate fit for the correlated three-factor model (χ2 = 116.82 [gl = 60, p<0.001], GFI = .89, AGFI = .83, NFI = .88, RMSEA = .08, CFI = .94, IFI = .94, PGFI = .57, PNFI = .68). In the Netherlands, Jansen et al. (2022) administered the Dutch version of the R-ATR to 80 architecture students enrolled in a research course and only reported an RMSEA of .069, as well as factorial saturations of .40 to .95 and Cronbach’s alpha coefficients of .81 to .93.
While the results of the Papanastasiou (2014) study provided strong evidence of validity and reliability for the R-ATR, the few findings obtained subsequently have not been entirely satisfactory. This may be due to the methodological limitations observed in these studies, such as the sample size and composition of the study samples. On the other hand, the psychometric properties of the R-ATR in Spanish have not been examined to date. Therefore, there is a need for further research to confirm the internal structure of the R-ATR and to extend its use in other populations and cultural contexts. This will allow obtaining greater scientific guarantees that accredit its use for both research and applied purposes. Therefore, this study had the following objectives: (a) to translate and adapt the R-ATR from English to Spanish and (b) to obtain evidence of validity based on content and internal structure and to estimate internal consistency reliability in a group of Peruvian university students.
Method
Participants
A total of 214 university students, 141 women (65.9%) and 73 men (34.1%), aged between 18 and 48 years (M = 24.79; SD = 5.15), from a private university in Metropolitan Lima were evaluated. Most of them were single (92.5%) and employed (61.2%). The sample was mainly represented by students from psychology (42.1%), business administration (26.6%), engineering (19.2%), law (5.6%) and other majors (6.5%). As for the academic semester, 15.9% were in the 5th and 6th semesters, 19.2% in the 7th and 8th semesters and 64.9% in the 9th and 10th semesters. Regarding the study modality, 11.7% studied face-to-face, 56.5% remotely/virtual and 31.8% blended. All participants reported that they were enrolled in a research course or had been in the past.
On the other hand, a non-probabilistic purposive sampling was used to select the cases or elements. Participants had to meet the following inclusion criteria: (a) be a university student, (b) be over 18 years of age, (c) be or have been enrolled in a research course. Likewise, the following were excluded: (a) those who did not provide informed consent and (b) those who did not have experience in research courses.
Design
An instrumental study (Montero & León, 2007) was carried out to translate and adapt a scale of attitudes towards research in Peruvian university students.
Instruments
Revised Attitudes Toward Research Scale (R-ATR;Papanastasiou, 2014)
The R-ATR consists of 13 items that assess attitudes towards research, through three components: research usefulness, research anxiety and positive predisposition towards research. This instrument has a 7-point Likert-type response scale (1 = “strongly disagree”; 7 = “strongly agree”). In order to obtain the scores, the negatively worded items (1, 3, 8, 9 and 12) must be inverted and the scores of the items added together. The overall score ranges from 13 to 91, with high scores expressing favorable attitudes toward research.
R-ATR was translated following the phases proposed for the cross-cultural adaptation of self-report measures (Beaton et al., 2000). In this regard, the original English version was independently translated into Spanish by two Peruvian bilingual professionals. Both translations were summarized in a first version in Spanish by the first author of this article. This initial version was then translated back into English by two native English-speaking translators, resulting in two back translations that were compared to verify their quality. The authors reviewed each of the reports of this process, identifying some small discrepancies that were addressed to obtain a preliminary version of the instrument. Finally, this version was applied to 36 university students, through an online survey, who reported that instructions, response scale and items were sufficiently clear and understandable.
Procedure
The approval of the UTP Research Ethics Committee was requested to carry out this research. First, the R-ATR was translated from English into Peruvian Spanish. The final version of the test was submitted to the criteria of ten expert judges, researchers and/or teachers of research methodology in psychology or education, in order to obtain evidence of content validity. The judges assessed the relevance, clarity and consistency of the items.
After this process, coordination and authorization arrangements were made to carry out the research. To collect the data, an online survey was designed in Google forms, which contained the informed consent, the sociodemographic form and the self-report instruments. The informed consent described the objective of the study, the voluntary and anonymous nature of the study, the activities to be performed by participants, and the possibility of refusing or cancelling the survey at any time.
The survey was conducted during the last weeks of the second academic semester of 2022. A total of 283 responses were obtained, of which 68 were filtered out because the subjects had no previous experience in research courses and 1 of them did not provide informed consent.
Data Analysis
Data analysis consisted of exploring the responses obtained in each of the items of the R-ATR and obtaining evidence of validity and reliability for its use in the Peruvian context. In that sense, descriptive statistics of central tendency, dispersion and shape were calculated. Then, the items were analyzed considering as an evaluation criterion the limit of r > .20 (Kline, 1986).
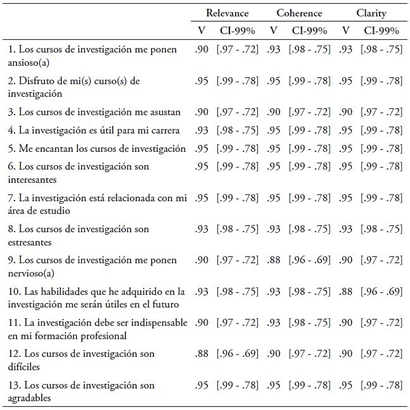
To evaluate the evidence of content validity, Aiken’s V coefficient with 99% confidence intervals was calculated using the program developed by Merino & Livia (2009). Aiken V coefficients and CI-99% greater than .50 were considered appropriate for each of the criteria assessed by the expert judges (relevance, consistency and clarity).
Subsequently, a confirmatory factor analysis was carried out to find evidence of validity in terms of internal structure. The Diagonally Weighted Least Squares with Mean and Variance corrected (WLSMV; DiStefano & Morgan, 2014) estimation method was used, due to the non-normal and ordinal nature of the items. The following goodness-of-fit indices were calculated: Chi-square (χ 2 ), Goodness of Fit Index (GFI), Comparative Fit Index (CFI), Tucker Lewis Index (TLI), Root Mean Square Error of Approximation (RMSEA), Standardized Root Mean Square Residuals (SRMR). The model fit was assessed according to the following criteria: χ2 not significant; GFI, CFI and TLI ≥ .95; RMSEA < .06 and SRMR ≤ .08 (Lei & Wu, 2007; Schreiber et al., 2006).
Finally, internal consistency reliability coefficients such as Cronbach’s alpha coefficient and McDonald’s omega coefficient were calculated. In both cases, values above .70 were considered appropriate (Nunnally & Bernstein, 1994).
Data were analyzed using STATA 16 and R Studio version 4.2.2.
Results
Content-Related Validity Evidence
To obtain the first evidence of validity of the R-ATR, we relied on the participation of 10 expert judges, who assessed the relevance, coherence and clarity of items.
Table 1 shows the results of Aiken’s V and their 99% confidence intervals. In general, the judges rated positively the items that make up the R-ATR. The three criteria evaluated show Aiken’s V coefficients very close to 1, with values fluctuating between .95 and .88, which represents a high degree of agreement among the judges on the importance of the items.
Descriptive Statistics and Item Analysis
Table 2 shows the results of the descriptive analysis and item analysis. In the first case, it is observed that the mean scores of most of the items fluctuate around 4 points, the middle value of the response scale. Also, according to the criteria of Finney & DiStefano (2013), skewness < ± 2 and kurtosis < ± 7, about half of the items present a marked asymmetry, which could be problematic for the use of CFA with estimation methods based on Maximum Likelihood.
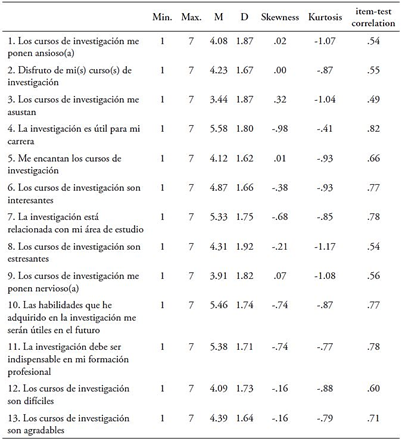
As for the item analysis, all corrected item-test correlations exceeded the set limit of .20 and are statistically significant (p < .001). In fact, almost all of them are superior to .50, with the exception of item 3 which has the lowest correlation with .49. The highest correlation corresponds to item 4 with a magnitude of .82.
Evidence of Validity Based on Internal Structure
Based on previous research, it was decided to perform a CFA with the purpose of studying the internal structure of the R-ATR. In particular, the three-factor correlated model proposed by Papanastasiou (2014) was tested.
Figure 1 shows the results of the CFA with the WLSMV estimation method (DiStefano & Morgan, 2014). As for the model’s goodness-of-fit indices, the following results were obtained: χ2 = 343.897 (gl = 62), p < .001; GFI = .99; CFI = .98; TLI = .98; RMSEA = .15; SRMR = 0.06. Although χ2 was significant, this is likely to be affected by the sample size, therefore, this result should be considered with extreme caution. On the other hand, the GFI, CFI and TLI indices are highly superior to .95 and indicate a good fit. Similarly, the SRMR which is less than .08. However, the RMSEA is higher than .06 and indicates an inadequate result. In summary, most of the goodness-of-fit indices used indicate a good fit for the proposed theoretical model.
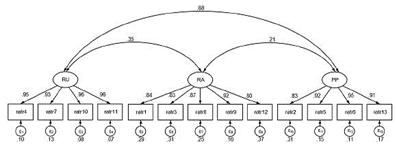
Note. All standardized coefficients and correlations are significant (p < .001). RU = Research usefulness, RA = Research anxiety, PP = Positive predisposition towards research.
Figure 1 Confirmatory factor analysis of the R-ATR
On the other hand, factorial saturations or loads (λ) of the model, as well as correlations between factors are statistically significant (p < .001). All λ are greater than .50 and indicate robust factorial loads. In the first factor research usefulness, the λ fluctuate between .93 and .96; in the second factor research anxiety, the λ fluctuates between .80 and .92, and in the third factor positive predisposition towards research, the λ fluctuates between .83 and .95. As for the factorial correlations, the highest correlation is observed between research usefulness and positive predisposition towards research. The correlations between research anxiety and the other factors are noticeably lower.
Reliability
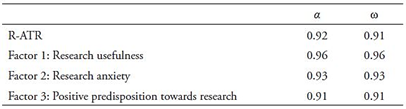
Finally, Table 3 contains the results of the reliability analysis. The Cronbach’s alpha and McDonald’s omega coefficients, both for the complete scale and for the three factors of the R-ATR, are greater than .90. These values represent excellent internal consistency reliability coefficients.
Discussion
Research methods courses are part of most curricula in higher education, both undergraduate and graduate. However, these courses are often the most overwhelming and challenging for many undergraduate students, who often tend to perceive them as irrelevant, feel anxious, unmotivated, and present misconceptions and negative attitudes towards research (Earley, 2014). For this reason, it is important to evaluate and identify students’ attitudes towards scientific research. From there, teachers can promote positive thoughts, feelings, and behaviors toward research (Murtonen, 2005; Murtonen & Lehtinen, 2003; Papanastasiou, 2005), as well as implement effective strategies for learning research methods (Wishkoski et al., 2022; Younas et al., 2022).
In this sense, literature offers instruments that assess attitudes towards scientific research in some specific field, other instruments are aimed exclusively at assessing attitudes towards qualitative or mixed research methods, and others do so from a global perspective, that is, they could be applied in the case of students from different professional fields both at undergraduate and postgraduate levels. This approach is particularly useful for measuring attitudes toward research in students at different academic levels and programs. However, there are few measurement instruments that comprehensively assess attitudes towards research in the Spanish language and, in particular, in the Peruvian context. In this sense, the main objective of this study was to translate and adapt the R-ATR in a sample of Peruvian university students.
The findings of this study indicate that this Spanish version of the R-ATR presents appropriate evidence of validity and reliability for measuring attitudes towards research in Peruvian university students. Specifically, evidence was provided of validity based on content and internal structure, as well as internal consistency reliability. First, the 13 items of the R-ATR were evaluated by 10 expert judges, who assessed their relevance, consistency and clarity. Aiken’s V coefficients and their CI-99% were very close to 1, indicating a high degree of agreement among the judges on the importance of the items in the above criteria.
Regarding the internal structure of the R-ATR, a CFA was performed to test the three-factor correlated model proposed by Papanastasiou (2014). In general, the findings suggest an adequate fit of the proposed theoretical model and the presence of high factorial saturations. These results are similar to those found by Papanastasiou (2014), although in the present study the factorial loads were slightly higher. Also, these results were better than those found in other studies in which moderate and inadequate goodness-of-fit indices were obtained, as well as lower factorial saturations, possibly due to methodological limitations reported at that time (Howard & Michael, 2019; Jansen et al., 2022).
Regarding reliability estimation, Cronbach’s alpha and McDonald’s omega coefficients were calculated in this study, respectively. Excellent reliability coefficients above .90 were found for both the full scale and its dimensions. These results are superior to those found in the original study (Papanastasiou, 2014) and that of the Dutch adaptation (Jansen et al., 2022). For the US version, it is impossible to make a comparison because only the reliability coefficients of the ATR are reported (Howard & Michael, 2019).
On the other hand, the main limitations of the study have to do with the type of sampling and the size and composition of the sample. In the first case, the sampling was non-probabilistic and purposive, which makes it difficult to generalize the results to the target population. In the second case, the sample was relatively small and, although it sought to include undergraduate students from various professional careers, it was mainly represented by students of psychology, business administration, engineering and, to a lesser extent, law and others. Future research could overcome these limitations by using probability sampling and larger samples that include students from most university courses.
However, despite these limitations, this study provides a new measurement instrument with a global approach for the evaluation of attitudes towards scientific research in Spanish. Likewise, appropriate evidence of validity and reliability is reported, which accredits its use in the Peruvian university setting, both for research and applied purposes.
In this sense, this may be the starting point for further psychometric studies with the R-ATR, aimed at obtaining other types of validity evidence, such as those based on the relationship with other variables. In particular, its ability to predict important criteria for the construct in the teaching-learning domain of research. Evidence of validity and reliability could also be obtained in other populations and contexts, such as in the case of graduate students and university professors. Undoubtedly, these possibilities may increase the scientific guarantees of the instrument in question.

