


 Inglés (pdf)
 Articulo en XML
 Referencias del artículo
 Enviar articulo por email
 Citado por SciELO
  Similares en
SciELO
Similares en
SciELO 
 Permalink
INTRODUCTION
Inequality and poverty are two of the most serious social problems that result from the historical relations established between the spheres of society, which are, the State and the market. These phenomena are observed on a global scale, where at different magnitudes and depending on the analysis variables, societies present a profile of inequality (Atuesta Montes et al., 2018). This social event continues to be present in the Peruvian society, in which certain social strata do not perceive an effective presence of the State and have been characterized by their high degree of vulnerability to internal and external events that endanger life quality.
It should be noted that vulnerability, as a social occurrence, must be understood like a multidimensional figure that converges in a risk where the individual is affected by exogenous and endogenous events (De Sena, 2020), a fact that has materialized given the instabilities on the internal front, due to deficiencies in government policies and global shocks, as occurred with the COVID-19 pandemic, which exposed the shortcomings or anomalies of the new global regime, specifically in the areas of extreme poverty (Anaya Narváez et al., 2022).
By this, if government policies do not lead to the creation of a horizontal and transversal benefit from economic progress, the levels and types of vulnerability will continue to affect the social strata that lives under greatest socioeconomic weakness. For this reason, an effective redistribution and budget management can be useful to minimize the social risks that arise (Campos Vásquez et al., 2021), statement that is also recognized by Cerra et al. (2022) when they point out that in order to guarantee a world of inclusivity and sustainability, it is important to recognize the essential role of the national budget (p. 9).
It is known that Peru, due to external factors and the application of economic policy measures (fiscal and monetary), showed a growth reflected in the gross domestic product (GDP), where an increase of 3.96% was shown between 2010 and 2021, in comparison to the rest of the Latin American and Caribbean (LAC) region, which according to World Bank figures (2020) was of 1.88%.
Thus, in the international economic community, there was a discussion concerning the "Peruvian miracle" that serves as an example to manage and direct an economy, even in scenarios of high volatility and uncertainty, which are characteristics of the globalization.
Nevertheless, said process has not been able to structurally close social asymmetries, where governments chose to give sustainability to their economy through foreign investments directed to the extractive sector, a successful economic strategy, as mentioned by Mieres Brevis (2020), who demonstrates that the population considered to be more socially vulnerable and located in the strips where extractive activities are carried out and that provide the greatest contribution to GDP, such as mining, can enjoy efficient redistributive policies to improve their social condition.
However, due to a series of factors, such as poor budget management, high degrees of corruption and political interests, it did not transcend socially as expected, a topic that resonates with Schwarz (2018), who points out that in the Peruvian case the poverty gaps have not been reversed with the development of this activity.
It should be noted that the dynamics of foreign direct investment (FDI), in part, depend on how internal risks, reflected in the Emerging Markets Bond Index, are managed. In the same line of thought, Elizalde Guzman et al. (2020) instrumentalize taking risks as a key element in economic stability and investment profitability. Likewise, Mamingi and Martin (2018) highlight the relevance of FDI in the process of growth and transformation of developing countries.
Also, adjustment schemes under a market economy are necessary for economic progress since they are imperative to attract investment. The use of these adjustments was framed within the orientation promoted by the “Washington Consensus”, that conveyed the strong ideological dominance established by the ideas of the free market that proclaimed the elimination of state economic intervention (Gonzáles de Olarte, 2005, as cited in Ayelén Almada & Hernán Reche, 2019, p. 9).
In addition, macroeconomic stability and innovation contribute to economic growth (Aromí et al., 2022; Nihal et al., 2023), and this in turn contributes to the reduction of poverty and inequality (Ayala & Cantó, 2022; Sánchez Dávila, 2023). Therefore, although the macroeconomic adjustments in Peru are perceived as a way to promote stabilization and economic growth, the lack of equity and equal opportunities is still observed. In this sense, Ortiz Benavides and Ruales Suarez (2021) define inequality as the space that occurs within a society, regarding the uneven distributions of resources and opportunities (p. 101). For their part, Abramo et al. (2019) explain that the eradication of poverty and extreme poverty continue to challenge countries of Latin America (p. 2), which is a matter that government policies under a market context need to resolve.
Accordingly, both macroeconomic and microeconomic robustness in a country, do not condition the generalized social welfare in economies where GDPs with sustained development can be observed, given that non-materialized social agendas will always be present where social exclusion exists; that is, economic benefits are not transformed into social ones or, as Murphy (2022) explains, the relation between modernity and prosperity is not egalitarian. This phenomenon is also noticeable in the Peruvian economy since the economic miracle was not reflected in significant social improvements.
An interesting analysis concerning this point is explained by Coppelli Ortiz (2018), who mentions the benefits of economic globalization and points out the direct incidence that socio-economic effects have on a country’s economy (p. 14). However, Ofori et al. (2021) are more cautious when intertwining globalization with poverty and explain that the first one exposes nations to financial ruin (p. 5). In this sense, although there is no doubt that the phenomenon of globalization has generated important monetary benefits, it has not been integrating nor inclusive.
Additionally, the data presented by the World Bank (2020) on poverty puts globalization under question, as a tenth of the world population lives on less than USD 1.90 a day. For their part, Jain et al. (2020) also refer to the COVID-19 pandemic, implying that poverty has also spread along with the globalization of markets.
In the Peruvian case, the National Institute of Statistics and Informatics (2022a) shows that in the year 2021, poverty affected 25.9% of the population (par. 1). For its part, the estimated GINI coefficient in recent years, which is also emphasized by Huesca Reynoso et al. (2021), could be a good indicator of the levels of inequality and the effects of failed redistributive mechanisms that have not been able to eliminate extreme poverty, where those affected are deprived and are struggling to subsist (Si et al. 2019, p. 3).
Equally important, the gaps in technological and communication infrastructure, sanitation, education, among others, are evident to a greater degree in poverty-stricken areas in Peru, where the lack of State presence is notorious and the quality of the population’s lives have not substantially improved with economic growth. Furthermore, Astudillo-Torres et al. (2020) highlight the significance of access to technology, stating that digital divide establishes a delay for social development, given that social exclusion will emerge if people do not have equal access to modern information and communications technology (p. 2). An affirmation related to the lack of technological infrastructure that macroeconomic strength cannot solve due to the insufficiency of effective public policies, which, if not corrected, will end up deepening the aspects of poverty, such as educational quality, which is a key aspect to improve the indicators of social vulnerability (Merino Núñez et al., 2019); also, as Vera Zegarra (2022) argues, the educational system’s state will preserve social inequalities (p. 5).
From what has been explained, the following question arises: Is economic growth necessarily related to improving social conditions of the population considered poor or more vulnerable? Question that leads to the research’s objective: Determine the relation that exists between economic growth and the social conditions of the population in a situation of poverty or greater vulnerability in Peru. Likewise, the study is justified as its results can be used as management instruments by the different governments’ branches whose responsibility is to apply policies aimed at closing social gaps, especially within the most vulnerable population.
METHODS
The research was descriptive, based on an analysis of the historical behavior of the variables and economic and social indicators, between the years 2010 and 2021. In addition, the study was correlational because the degree and type of relation between the variables was set. Lastly, it was non-experimental, since no variable that influences the result was intentionally altered.
The economic and social variables were GDP per capita, technology and communications coverage, real income, water supply and demand for energy services in the vulnerable or extremely poor population. The information used was of an official source, which was the National Institute of Statistics and Informatics.
Similarly, the normality analysis was used under the Shapiro-Wilk test, which raises the null hypothesis that the sample in question comes from a normal distribution. Thus, if the p value is greater than 0.05 the null hypothesis cannot be rejected, then the distribution is normal and it is appropriate to use a parametric test.
On this basis, the Pearson's r test was applied to determine the level of correlation between the study variables, so that the existence, meaning, and magnitude of their relation can be known. So if 0 < r < 1, then there is a positive correlation; if it is 0, there is no linear correlation; if -1 < r < 0, the correlation is negative; and if r = -1, there is a perfect negative correlation.
RESULTS
Hence, the GDP per capita was used as an indicator of economic growth, which from 2010 to 2021 was of an average level of 2.10%, supported by an increase in GDP in a greater proportion than the increase in population and which the growth rate was 1.32%. It should be noted that the growth of the GDP per capita is 97.45%, as shown in Figure 1, which is a clear sign of the importance of this macroeconomic indicator to achieve better levels of well-being, as it occurs with the human development index (HDI), so it is relevant to generate the necessary conditions to attract investment, boost exports, as well as internal consumption that affect this macroeconomic indicator.
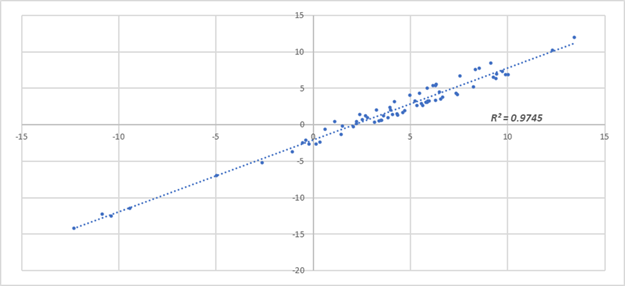
Note. Evolution of the GDP per capita that considers the GDP figures at 2007 prices with the total population of Peru. Prepared with data taken from the Sistema de información económica, by Instituto Nacional de Estadística e Informática, 2022c (https://m.inei.gob.pe/estadisticas/indice-tematico/economia/).
Figure 1 Gross product per capita 2010-2022
Regarding the evidence of the progress in the use of technology, specifically the internet in the strata considered poor and extreme poor, figures published by the National Institute of Statistics and Informatics (2022b) were contrasted to households that have access to the information and communication technologies with GDP per capita. The results indicate that the extreme poor are the ones who were least included in the technological advance (internet) in relation to economic growth, reaching a weak correlation of r = 20.8%, compared to the non-poor who reached r = 63.5%. Likewise, the results for the vulnerable and non-vulnerable show a correlation coefficient of r = 43.9% and r = 68.1%, supporting the greater strength of this relation in the last social sector.
In addition, an evident fact about internet connectivity in extremely poor localities, which can be seen in Figure 2, is that, until 2019, the use of this type of service in this social stratum is practically non-existent. As of 2020, the increase on its use can be appreciated, which is an important factor in educational activity. Also, this figure shows the greatest advantages in the use of this technological factor by the non-poor and non-vulnerable population, who according to the National Institute of Statistics and Informatics (2022b), by 2021 53.8% and 64.1% had internet access, respectively, compared to the extreme poor, which only reached 15.1%, which contrasts the correlation coefficients determined, and projects the social asymmetry in the use of technology (See Figure 2).
It should be noted that the Pearson correlation coefficient was used, since all the data submitted to the normality test under the Shapiro-Wilk method (less than 50) obtained a p-value above 5%, therefore, the data under analysis respond to a normality path, which occurs in all cases where this correlation test is used.
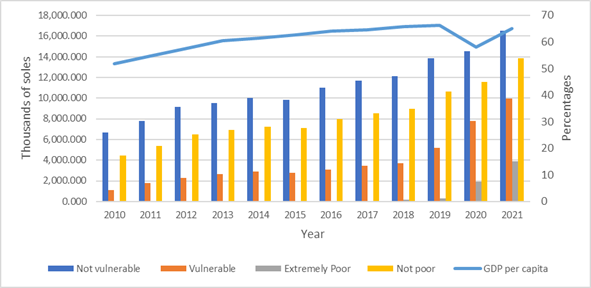
Note. Prepared with data taken from the Evolución de la pobreza monetaria 2010-2021, by Instituto Nacional de Estadística e Informática, 2022b (https://www.gob.pe/institucion/inei/informes-publicaciones/3878272-evolucion-de-la-pobreza-monetaria-2010-2021); Sistema de información económica, by Instituto Nacional de Estadística e Informática, 2022c (https://m.inei.gob.pe/estadisticas/indice-tematico/economia/).
Figure 2 Peru: Internet access according to poverty status and GDP per capita 2010-2021
On the other hand, it is relevant to evaluate the way in which real monthly per capita income has behaved by area and geographical domain, in regards to the progress of the country's economy. It is understood that an economy with horizontal, cross-sectional, inclusive and sustained growth must lead to substantial improvements in the people’s income, focused on different regions of the country; however, based on the information processed, a high and direct correlation can be seen between GDP per capita and the real income in the rural, rural mountain and the rural coast areas, which reach r = 77.3%, r = 79.9% and r = 76.5%.
In addition, the National Institute of Statistics and Informatics (2022b) indicates that by 2021 the income of the rural, rural mountain and rural coast areas reached S/ 617.00, S/ 604.00 and S/ 867.00, respectively, amounts that exclude the regions from the modern society and limit them to improve their quality of life (See Figure 3). On the other hand, the income of the urban zone contrasted to the GDP per capita reaches r = 41.5%, which also reflects the advance of this income with the improvement of the country's economy, but in monetary terms it is a social sector that presents greater income, which in 2021 reached S/ 1064.00, clearly evidenced in Figure 3. Also, due to the behavior of the data and the Shapiro-Wilk normality test, it was verified that the use of the Pearson correlation test was suitable to determine the degree and type of relation between the variables under analysis.
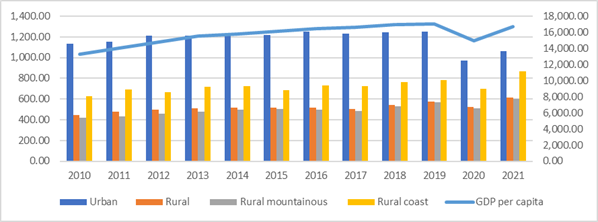
Note. Prepared with data taken from Evolución de la pobreza monetaria 2010-2021, by Instituto Nacional de Estadística e Informática, 2022b (https://www.gob.pe/institucion/inei/informes-publicaciones/3878272-evolucion-de-la-pobreza-monetaria-2010-2021); Sistema de información económica, by Instituto Nacional de Estadística e Informática, 2022c (https://m.inei.gob.pe/estadisticas/indice-tematico/economia/).
Figure 3 Peru: Average real monthly per capita income by area and geographic domain 2010 -2021
Another relevant indicator that leads to analyze the way in which economic growth is related to social indicators, is the manner in which family units, especially those living in vulnerability or extreme poverty, have been using a certain type of fuel for their household activities and how the relation between the behavior and the macroeconomic aggregate GDP per capita has developed. Thus, in social sectors considered vulnerable or in extreme poverty, where the presence of the State is minimal or marginal, people continue using resources that offer a picture of the seriousness of the social and economic conditions in which they are living. As can be seen in Figure 4, in 2010, 68.90% of this social stratum used firewood as a combustion element; in 2021, this figure dropped to 32%, but it is still used in a higher proportion as a combustion resource in people’s daily activities.
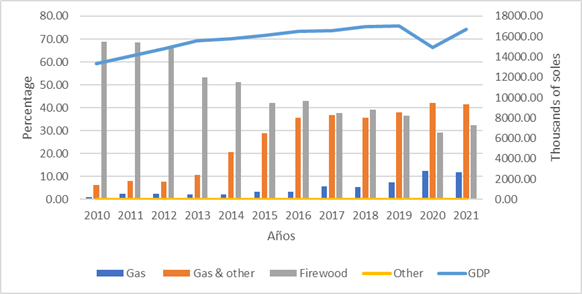
Nota. Prepared with data taken from the Evolución de la pobreza monetaria 2010-2021, by Instituto Nacional de Estadística e Informática, 2022b (https://www.gob.pe/institucion/inei/informes-publicaciones/3878272-evolucion-de-la-pobreza-monetaria-2010-2021); Sistema de información económica, by Instituto Nacional de Estadística e Informática, 2022c (https://m.inei.gob.pe/estadisticas/indice-tematico/economia/).
Figure 4 Peru: Type of fuel used by families in extreme poverty to cook food 2010-2021
Then, in rural areas of extreme poverty, firewood, kerosene, corn cob and dry branches are mostly used as combustion resources compared to gas, under a context of economic growth, where GDP increased on average by 3.95% from 2010 to 2021. In light of the figures analyzed, it can be noted that the economic strength did not lead to better living conditions for the population living under a higher degree of vulnerability. Furthermore, given the health crisis, these social indicators deteriorated even more, and according to the figures for 2021 in relation to 2020, families replaced the use of gas by a percentage that fell by 0.7 points, with firewood, which increased by 3.2 points in its use.
Thus, if economic growth is contrasted with the use of firewood as a combustion resource, the correlation coefficient reaches r = -77.32%, a figure that shows that an improvement in the economy has a negative relation with this type of fuel. The use of only gas and gas with other resources, such as kerosene, coal, electricity, had a correlation coefficient of r = 39.08% and r = 76.58%, respectively. To carry out the contrasts of indicators and determine their types of relation, the Pearson correlation coefficient was used, based on the normality of the data, which according to the Shapiro-Wilk test, the P value exceeds 5%.
In addition, another social indicator that measures the population’s quality of life is the access to drinking water, where its source responds to the investments of companies or State entities in charge of generating sustained supply. It is clear that the development of these types of projects must go hand in hand with the growth of the economy at the national level, since it must obey a State’s redistributive policy.
For purposes of analyzing the way in which this sanitation activity has been developed, it is important to take into account the population in extreme poverty or the most vulnerable. Thus, it can be seen that part of the population living in extreme poverty uses river or well water for household activities, which, although it has dropped in use from 50.6% 2010 to 15.6% in 2021, it is still a sign that the essential deficiencies in these areas have not been solved. On the other hand, home plumbing has improved from 32.4% to 71.5%, but there are still gaps or unmet demands; therefore, water supply through wells, tanker trucks and pylons, project a profile of vulnerability.
Moreover, if the economic growth measured through the GDP per capita is compared to each of the modalities of water supply, it is observed that with the economic advance comes an improvement in home water systems, a situation that is reflected in the degree of Pearson correlation that reaches r = 76.5%. Likewise, there is a decrease in the use of other types of sources, such as river and well water, which correlation is r = -71.34% and -51.55%, respectively. In general terms, despite the economic progress and the upgrading of home water systems, which are essential to maintain good health, there are still gaps that must be covered with public investment projects of this nature (See Figure 5).
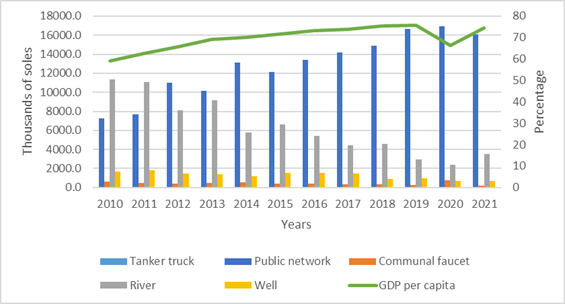
Nota. Prepared with data taken from the Evolución de la pobreza monetaria 2010-2021, by Instituto Nacional de Estadística e Informática, 2022b (https://www.gob.pe/institucion/inei/informes-publicaciones/3878272-evolucion-de-la-pobreza-monetaria-2010-2021); Sistema de información económica, by Instituto Nacional de Estadística e Informática, 2022c (https://m.inei.gob.pe/estadisticas/indice-tematico/economia/).
Figure 5 Evolution of the forms of water supply for human consumption. Extreme poverty 2010-2021
Finally, regarding extreme poor households’ access to electricity, significant coverage is observed through public lighting, which went from 48.80% in 2010 to 83.0% in 2021, generating almost great coverage through this type of resource in this population segment; however, the use of candles as means of lighting in homes is still observed, which in 2010 reached 30.9% and then fell to 6.3% in 2021 (See Figure 6). Thus, by contrasting the GDP per capita with different forms of home lighting, a Pearson correlation coefficient (r) of 71.85% was found for public network lighting and r = -80.9%, r = -71, 7% and r = -82.8% for lighting with burners, lamps and candles, respectively, results that indicate that in the period under analysis, the use of these types of sources for home energy bears a negative relation with economic growth.
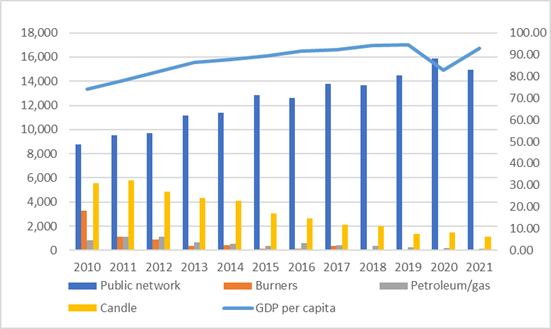
Nota. Prepared with data taken from the Evolución de la pobreza monetaria 2010-2021, by Instituto Nacional de Estadística e Informática, 2022b (https://www.gob.pe/institucion/inei/informes-publicaciones/3878272-evolucion-de-la-pobreza-monetaria-2010-2021); Sistema de información económica, by Instituto Nacional de Estadística e Informática, 2022c (https:g//m.inei.gob.pe/estadisticas/indice-tematico/economia/).
Figure 6 Evolution of the type of lighting used by households according to the condition of extreme poverty. 2010-2021
DISCUSSION
The fact that the economy has experienced signs of macroeconomic strength in recent decades, supported above all by the good international scenario, did not mean that the deficiencies or social needs of the most vulnerable population in the country were met, which leads to the affirmation that economic growth has not necessarily translated into an inclusive and transversal social improvement at national level.
Thus, it is necessary to use public policy instruments to make social projects viable, because if these are not correctly channeled and executed, it will not be possible to close sectoral gaps. Furthermore, this problem will worsen if governments do not present clear policies to improve social indicators.
Equally, the use of internet and other media are important factors in the process of social inclusion, especially in educational activity. Over time, the internet access has been differentiated, exposing that the population considered poor and extremely poor were the least favored in accessing this technological tool, which is supported by the Pearson correlation coefficient of r = 20.8% compared to the non-poor population that reaches r = 63.5%; a result that agrees with Astudillo-Torres et al. (2020), who argue that this type of asymmetries are part of social exclusion and it is what happens with the vulnerable population that historically has not had access to information technology.
On the other hand, when the economy experiences sustained growth, due to the redistributive effect and the inclusion of labor in the market, the real income of those who participate in productive activities should also improve, but if this indicator is contrasted to the population focused on rural areas, it can be seen that the income levels would not generate a better quality of life within this population segment.
Using Pearson's r correlation coefficient, a high relation can be seen between monthly per capita income and GDP, which exceeds 70% on average. However, this type of result is not evident in the amount obtained by the most vulnerable population, whose income does not cover a basic family basket, which explains that the macroeconomic results, if not effectively distributed, do not cause substantial changes in poverty indicators, which is also pointed out by Murphy (2022), Coppelli Ortiz (2018) and Ofori et al. (2021), authors who intertwine the economy with social results, where the market’s supposed benefits have not been able to close poverty gaps.
If the economic improvements are largely absent within the extremely poor population and those considered to be more vulnerable, showing a clear sign of their exclusion from the benefits of growth, the results will also be reflected in the use of fuels in the people’s household activities, where the use of firewood in 2010 was 68.90% and was replaced by gas and other combustion resources such as kerosene or coal over time. This substitution effect can be seen in the correlation coefficient (r) of the use of firewood with GDP per capita, which reaches -77.32%, in contrast to other types of combustion, such as kerosene, coal or electricity, which correlation is r = 76.58%.
Although the results of the correlation level show a drop in the use of firewood in extremely poor households, this does not mean that the material has ceased to have an important presence in its use as a combustion resource, given that in 2021, under the pandemic context, its use reached 32.4%.
Another indicator of vulnerability is the source of water used by the extremely poor. Thus, in 2010, 50.6% used river or well water and then fell to 15.6% in 2021, with the advancement of public water supply networks, which coverage reached 71.5% this last year. Therefore, a correlation of 76.5% concerning the GDP is observed, along with a negative correlation for other water supplies, such as river and well, which reach -71.34% and -51.55%, respectively. Even so, the fact that there is greater drinking water coverage does not imply that this type of gap has been closed within the extremely poor population, given that, as of 2021, 15.6% still used river, well, spring and cisterns for water access.
Social vulnerability is also observed in the way in which the extremely poor population uses the various supplies for lighting at home. This is due to the fact that in 2010 50.0% used candles, lighters and gas, whereas 48.8% used public lighting, which has reached a coverage of 83.0%. Thus, according to this last modality, the correlation coefficient shows a result of r = 71.85% for public network while it is -80.9%, -71.7% and -82.8%, for burners, lamps and candles, respectively.
The results, product of the contrasts and the descriptive analysis -for the use of fuel, water for consumption, and the system of home lighting supply- show that economic robustness has not led to closing the gaps in this type of shortcomings observed within the extremely poor, who still have to use candles, firewood, or wells for their survival, which is related to the findings of Ortiz Benavides and Ruales Suarez (2021), who develop the theme of inequality in the allocation of resources and the lack of opportunities for the vulnerable population; as well as to Si et al. (2020), who argue that the negative impacts of internal or external events occur more severely in societies that do not obtain the benefits of economic progress and that leave people within the limits of subsistence.
In conclusion, the macroeconomic strength obtained, materialized in continuous economic growth and greater budgetary resources, did not lead to generating substantive and structural improvements for the vulnerable or extremely poor sectors, where there is an evident lack of correction of social and technological gaps, which is a clear sign of deficiency of sectorized projects and the areas where the population with the highest degree of vulnerability has historically settled. It is observed that the redistributive effects of wealth, product of economic progress, have not had the expected impact; for this reason, there are still sectors without internet connection, with precarious income, inadequate water supply, precarious lighting, and who still use firewood to cook their food.
In this way, the subject of study leaves a series of open questions: Why are the symptoms of extreme poverty or the most vulnerable population not corrected if strong economic growth was evidenced in Peru? Why were redistributive policies not robust enough to end poverty or extreme poverty? Why, despite the fact that the State has budgetary resources, is it not possible to correct social vulnerabilities? Why is the technological infrastructure not inclusive, especially in areas of extreme poverty? These questions leave new research topics open, which contributions will serve to mitigate poverty anomalies in Peru.

