


 Español (pdf)
 Articulo en XML
 Referencias del artículo
 Enviar articulo por email
 Citado por SciELO
  Similares en
SciELO
Similares en
SciELO  uBio
uBio 
 Permalink
INTRODUCTION
Dual purpose production system is the most common way to produce milk and meat from cattle in the tropics of the world and in those of Mexico. Milk is important to feed the calf and for human consumption; therefore, it is important to know the potential milk production of dual-purpose cows to improve total milk production per lactation. Dairy cows’ lactation curve in specialized systems show an increase from calving up to a peak milk yield between weeks 4 and 8 of lactation, pursue by a reduction in milk until being dried-off (Macciotta et al., 2005). In addition, it is known that environmental factors affect the milk production of cows under temperate conditions, such as breed, season of calving and parity number (Kunaka and Makuza, 2005; Karadas and Birinci, 2019) and in consequence the shape of the lactation curve changes (Guler and Yanar, 2009). However, studies about lactation curves of crossbred Bos taurus x Bos indicus cows under the humid tropical conditions of Mexico are scarce. Some studies in crossbred cattle in the tropics suggest the effect of breed group, season and parity number in the form of the curve of lactation (Osorio-Arce and Segura Correa, 2005). However, much of those studies have been carried out under subhumid-tropical conditions. Differences exist between the subhumid and humid tropics of Mexico, due to amount of rain, its effect on pasture availability and level of stress caused by environmental conditions and disease.
Many equations have been tested to describe the lactation curves, the most widely applied being those of the non-linear type.
Some of the most used models are Brody, Dijkstra, Wilmink and Wood (Val-Arreola et al., 2004; Kawata, 2011; Khan et al., 2012). The choose of the correct statistical model is important to make management decisions and to predict milk production per cow and during its lifetime. It is also important to know the peak of production, persistency of milk, and age and weight at maturity. Therefore, it is worth to depict the shape of the lactation curve of dual-purpose cows under the Mexican tropical conditions. The aim of this study was to estimate the parameters and to describe the lactation curve of multiparous dual-purpose cows (Holstein x Gyr) under the humid tropical conditions of the southeast of Mexico.
MATERIAL AND METHODS
Location of the Study
The production unit was located at the north of Chiapas Mexico. The area has a humid-tropical environment, high mean temperature (26.5 °C), and high annual rainfall (about 3250 mm), most of which falls during June and September (INEGI, 2021). The lactation records used in this study included 1231 test-day milk yield data obtained from 160 dual-purpose Holstein x Gyr cows collected during November 2017 to February 2019.
Management and Breed Groups
Cows in the studied herd belongs to three breed groups: 0-25%, F1 (50%) and 62.5-75% Holstein x Gyr. They grazed on star grass (Cynodon plectostachyus), milked once a day, and they were given 2 kg of a commercial feed concentrate (16% crude protein and 2.3 Mcal EM/kg). Calves were submitted to a restrict feeding, had access to one teat during the first month of lactation and thereafter they only suckled the residual milk. Milk yield was weighed at approximately 14 day-intervals and included only the extracted milk, excluding that consumed by the calf. Cows were vaccinated against common diseases of the region.
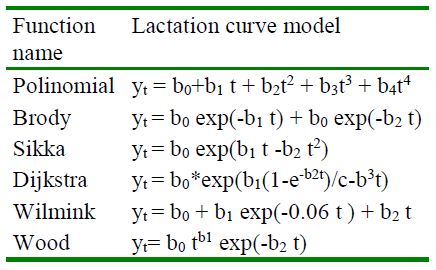
Lactation Curve Models
Six functions were used to model the lactation curve and to estimate lactation curve parameters for cows with 3 to 6 parities. The curve fitting was carried out applying the algorithm of Gauss-Newton in the NLIN procedure (SAS, 2012). The lactation curve models used to describe milk yield with time are shown in Table 1. In normal curves, Yt is the milk production at day t of measure; b0 is the parameter estimated related with milk yield at the start of lactation, b1 is a parameter correlated with the ascending phase of the curve before peak yield, and b2 is the parameter estimated correlated with the declining phase after the peak yield is reached.
The formulas to estimate the number of days up to the peak milk yield (DIMP) and the yield of milk (kg) at the peak of the lactation curve for the Wood model were estimated as: b /b and b (b /b )b1 exp-b1, respectively.
Ethical Standards
The manuscript does not contain clinical studies or patient data. Data were obtained from the record books where milk information was kept.
Statistical Analysis
A total of 1231 milk records from 160 lactations from same number of cows ranging from 105 to 270 days in length were used. Milk was registered for each cow approxi- mately every two weeks. Lactations starting after 28 days of calving were not included in the study (n=16).
The milk data were captured into Microsoft Excel data sheets and then imported into SAS (2012) for posterior data debugging and fitting in the best lactation curve. All non-linear models were fitted using NLIN procedure (SAS, 2012).
The goodness-of-fit of the best model was determined using the Akaike Information Criterion (AIC). However, the root of the mean squares of the prediction error (RMSPE) and coefficient of determination (R2) were also calculated. Smaller values of AIC and RMSPE and higher of R2 indicate a better fit when two models are compared. AIC were calculated from the results provided by NLIN as suggested by Motulsky and Christopoulos (2003): AIC= n*(ln(SSE/n))+ 2k+2k*(k+1)/ (n-k-1), where n is the number of records, ln is the logarithm base 2.718, SSE is the sum of squares of the residual provide by the NLIN procedure, and k means the number of parameters involve in the non-linear model. The probability of choosing between two models was calculated as p = exp (-|AIC difference|/2)/(1+exp(-|AIC difference|/2); where a p<0.05 indicates difference between the two models being compared (Motulsky and Christopoulos, 2003).
RESULTS
The RMSPE, AIC and R2 for each model are shown in Table 2. There were no differences among Wood, Wilmink and Sikka models being better than the Polynomial model. The Brody equation has problem to converge for the high graded Holstein x Gyr group. In this group, the Brody model con- verge, but a problem with the model was advised by SAS. Dijkstra model did not con- verge for any of the three breed groups.
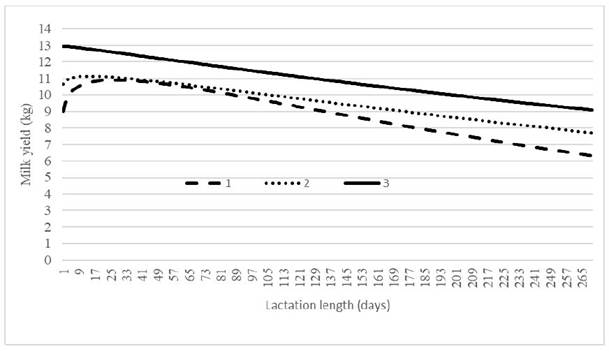
The shape of the lactation curves for the three breed groups based on the Wood model is shown in Figure 1. Differences in the appearance of the lactation curve between breed groups were observed, especially in the number of days at the peak, the slope, and the flatness of the curves. The days at peak milk yield for the 0-25, 50 and 62.5-75% Holstein graded cows were 26.9, 14.4 and 1.7 days, respectively.
The parameter values of the lactation curves are shown in Table 3. In the Wood model the b1 and b2 coefficients were positive and close to zero for the F1 and 62.5-75% Holstein x Gyr cows. The b1 value of the 0- 25% Holstein x Gyr cows was also low 0.0813, but 3.29 and 35.35 times greater than those for the F1 and highly graded cows which affected the shape of the lactation curve.
DISCUSSION
Model Fit
There were no differences among Wood, Wilmink and Sikka models based on the comparison of AIC and the formula to determine the best of two models. Considering the AIC, the Wood model was used to depict the lactation curve, the aspect of the lactation curve and model parameter estimates for the three breed groups. In addition, the Wood model is commonly used to depict the lactation curves of dairy cattle (Val-Arreola et al., 2004; Gradiz et al., 2009; Macciotta et al., 2011).
Table 3 Parameter estimates of models used to describe the lactation curve of Holstein x Gyr cows
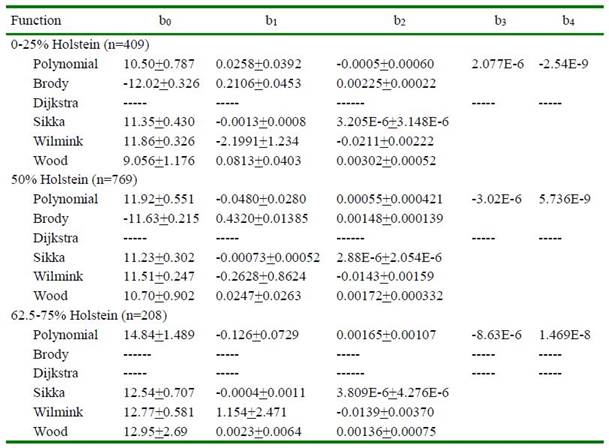
b0, b1, b2, b3, b4 coefficients that define the shape of the lactation curve.
The difference of fit of the models between breed groups may be due to different genetic potential for milk production of the breed groups. Pure Holstein cows are recognized because of its high milk yield capability, and the pure Zebu cows for their adaptation to the tropical climate, and resistance to parasites and diseases. Some authors from tropical countries suggest that the F1 cross of dairy cattle from temperate climate and those from tropical breeds pro- duce more milk per day than pure breed cows under tropical environments (Syrstad, 1989; Madalena et al., 1990). Peralta-Torres et al. (2022) using the same source of data of this study, showed short lactation length and total milk yield per lactation for 0-25% Holstein x Gyr, compared to F1 and 62.5-75% Holstein x Gyr cows, but without significant differences between the last two breed groups.
Lactation Curve Shape
The lactation curve of the 0-25% Holstein x Gyr cows was similar to the shape of typical lactation curves notified for Holstein cows under temperate climates (Tozer and Huffaker, 1999; Moraes-Concalves et al., 2002), showing a sharp increase followed by a gradual decline after the peak, until cows are dried-off. Typical shape curves were also observed by other authors (Osorio-Arce and Segura-Correa, 2005) under humid tropical conditions in Tabasco, Mexico, for – Holstein ¼ Zebu and F2 generation of ½ Holstein ½ Sahiwal cows. On the other hand, the curves for F1 and 62.5-75% Holstein x Gyr cows corresponded to those reported for dual- purpose cattle in the tropics, which showed to be negative linear with a slight or no peak of milk production. Atypical curves are distinguished by the lack of a lactation peak (Boujenane and Hilal, 2012; Jeretina et al., 2013; Chegini et al., 2015) and are partially due to variations in the amount and quality of feeds, as well as to physiological and health complications associated with hard environmental conditions. Here, it could be associated with pasture quality and quantity across the year. However, it is worth to mention that cows in this study were given 2 kg of a feed supplement (16% CP and 2.3 Mcal ME/kg) during the critical months of the year. Furthermore, the variation in the aspect of curve is also attributed to the effect of season due to better quality of pasture in spring (Macciotta et al., 2011).
Lactation Curve Parameters
The differences in the shape of the lactation curve between groups can be attributed, among other reasons, to differences in the model parameter estimates for each breed group (Table 3). The shape of the curve for 0-25% Holstein cows were more similar to the normal lactation curve, but with lower milk yield at the beginning of lactation period than the other groups. F1 and 62.5- 75% Holstein cows had atypical lactation curve shapes (Figure 1).
The milk yield at the start of the lactation period (intercept) here obtained (Table 3) was greater than those estimated for – Holstein ¼ Zebu (7.49 kg) and the F2 generation of ½ Holstein ½ Sahiwal cows (6.70 kg) in the Mexican humid tropics (Osorio-Arce and Segura-Correa, 2005). Moreover, it was greater than the 4.67 kg reported for Holstein × Brahman, Holstein × Brown Swiss and Brown Swiss × Brahman crossbred cows in Honduras (Gradiz et al., 2009), but agree to values reported by Madalena et al. (1979) for F1 Holstein x Gyr (12.81 kg), – Holstein × ¼ Gyr (11.36 kg) and pure Holstein (10.91 kg). The higher daily milk yields in this study were due to the use of Gyr cows in the cross with Holstein.
The form of the lactation curve is depicted by the parameters of the model used. In the Wood model, positive values for b1 and b2 give a normal curve with a milk peak. A curve with negative b1 and b2 parameter estimates provide a negative linear curve as that for 62.5 to 75% Holstein cows (Figure 1). As an example, Khan et al. (2012) using the Nelder model found an increase in the rate of milk (b1) up to the peak of the lactation curve various breeds and crosses. The positive values of b1 and b2 for the 0-25% breed group (0.081 and 0.003 kg/day, respectively) in the study were lower than those reported in crossbred female (Gradiz et al., 2009), and in Holstein x Zebu (0.178 and 0.366 kg/day) and Holstein x Sahiwal (0.196 and 0.364 kg/day) under tropical humid conditions of Tabasco, Mexico (Osorio-Arce and Segura-Correa, 2005).
Days at Peak and Milk Yield at Peak
Only the 0-25% Holstein x Gyr cows showed a lactation peak, and this occurred at day 26.92 with the highest milk yield of 10.91 kg, being lower than the means notified by Tekerli et al. (2000) and Chegini et al. (2015) in Holstein cattle. However, those values were close to the ones reported in Mexico (5) for Holstein x Zebu and Holstein x Sahiwal cows (11.89 and 11.01 kg, respectively).

