


 Inglês (pdf)
 Artigo em XML
 Referências do artigo
 Enviar este artigo por email
 Citado por SciELO
  Similares em
SciELO
Similares em
SciELO  uBio
uBio 
 Permalink
INTRODUCTION
Ethanol production that uses corn as raw material is rapidly increasing worldwide to lessen oil dependence and to improve the environment quality. Many countries, including Brazil, are seeking technologies to roam this business (Silva et al., 2015). According to Vázquez et al. (2017) utilization of corn and sorghum for ethanol production result in by products that can be widely used as protein and energy sources for ruminants and non-ruminants, such as dry (DDG) and wet distillers' grain (WDG).
DDGS (distiller's dried grains with solubles) is known as protein, soluble vitamins, minerals, and energy sources (Fries-Craft and Bobeck, 2019). To determine its optimum inclusion levels, nutritional alternatives in non-ruminants (Konieczka et al., 2019) are necessary to evaluate since its nutritional composition and value can vary widely between corn plants, batches, and regions (Cremonez et al., 2015). DDGS presents high lipids, minerals, proteins and fibrous carbohydrates concentration. The fibre is an important nutritional factor in non-ruminant animals since they do not have the capacity to digest it.
High fibre content is in meals decreases the meal metabolizable energy increasing food passage rate and decreasing the usage of the nutrients (Whiting et al., 2018). In this context, the objective of the present research was to determine inclusion levels of corn DDGS in the diet on Cobb 500 broilers performance, carcass yield, and gastrointestinal tract biometry.
MATERIALS AND METHODS
The experimental work was carried out in the broiler growing shed of the Animal Science and Agronomy Experimental Farm, at Mato Grosso Federal University, Campus Cuiabá, Brazil. The research project was approved by the ethics committee on animal use (23108.227104/2017-13).
A completely randomized design was used with five treatments, four with DDGS inclusion levels and one control treatment, seven replications by treatment forming 35 experimental units and, each unit with 20 Cobb 500 broilers males under a completely randomized statistical design. Experimental diets were based on corn and soybean meal, formulated according to nutritional Cobb 500 Guideline recommendations (Cobb Manual, 2012). Diets were isonutritives taking the nutritional composition recommendations of Rostagno et al. (2017) and considering the bromatological DDGS analysis (Table 1). Amino-acid content was based on Leme et al. (2019).
Table 1 Bromatological analysis of corn DDGS
| Composition | % |
|---|---|
| Crude protein (CP) | 42.73 |
| Ethereal extract (EE) | 1.66 |
| Crude fibre (CF) | 18.37 |
| Mineral matter (MM) | 1.87 |
| Dry matter (DM) | 89.00 |
| Non-nitrogenous extract (NNE) | 47.73 |
| Calcium (Ca) | 0.13 |
| Phosphorus (P) | 0.53 |
The aviary was oriented east-west direction, equipped with external side curtain system with mechanical drive ratchets and fans. Besides, the misting system, which was used to control the temperature and internal humidity, without linings and internal curtain. Likewise, the roof was made of clay tiles. The heating system was composed of infrared 250 W lamps, installed individually in each experimental box. The lighting system was automatically turned on and off by an automatic thermostat.
The shed was divided into four lateral lines with 15 screened boxes of 2.5 m2 in each line, and with a density of 8 broilers/m2. The substrate used as the broiler litter was new rice husk. Water supply and feed from the 1st to the 7th day was conducted by pressure cup and feeder, respectively. Additionally, for the period of 8 to 42 days, feed and watering were performed via pendulum trough tubular feeders. Furthermore, the feeding and broiler litter upturn was done twice a day, every day.
The maximum and minimum temperatures and relative humidity were measured twice a day (08:00 and 16:00). The mean temperature and relative humidity throughout the experimental period were calculated by adding the maximum or minimum temperature and humidity divided by the experimental days number (Table 3).
The lighting programme was performed according to the recommendations of the Cobb Guideline (2012). Mortality percentage was recorded daily, as the feed weight on the day of broiler death in its experimental box for corrections. Mortality corrections were performed according to Sakomura and Rostagno (2007) recommendations.
The treatments were T1 (control diet) with 0% DDGS; T2: diet with 4% of DDGS; T3: diet with 8% DDGS; T4: diet with 12% DDGS; T5: diet with 16% of DDGS. All experimental treatments were applied from day 1 to day 42 of age (Table 2).
Table 2 Percentage composition of the experimental rations of broilers from 1 to 7, 8 to 35 e 36 to 42 days of age
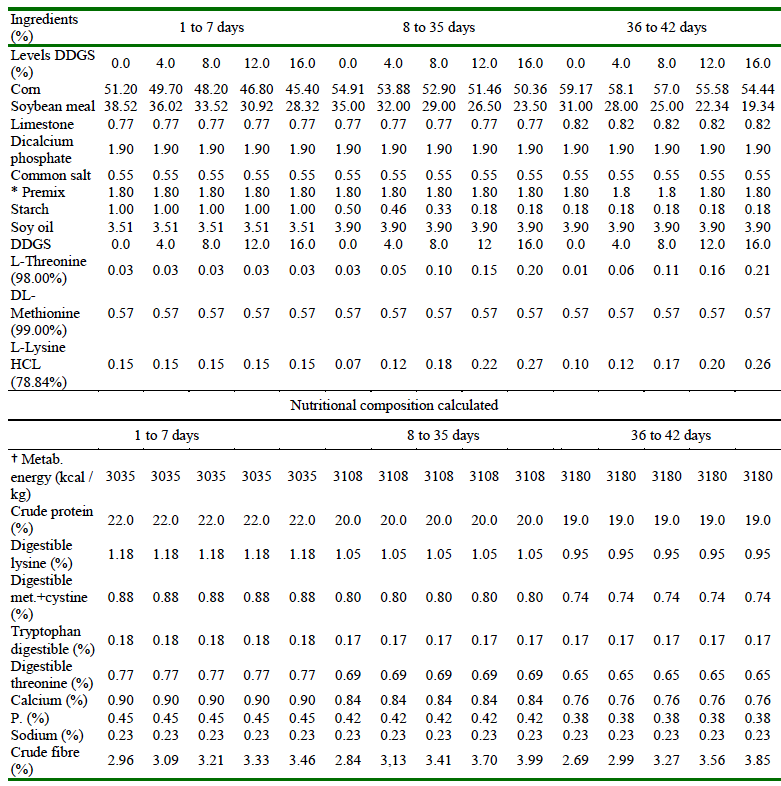
† EMAn: apparent metabolizable energy corrected for nitrogen (kcal / kg), values based on the European table of energy value for poultry feedstuffs (World's Poultry Science Association, 1989)
* Provides per kg of product: Calcium (max) 210 g, Calcium (min) 170 g, Phosphorus (min) 50 g, Methionine (min) 22 g, Vitamin A (min) 120000 IU, Vitamin D3 (min) 30000 IU, Vitamin E min) 400 IU, Thiamin (B1) (min) 35 mg, Riboflavin (B2) (min) 130 mg, Pyridoxine (B6) (min) 60 mg, Vitamin B12 (min) 300 mg, Vitamin K3 (Min) 1600 mg, Zinc (min) 1380 mg, Copper (min) 200 mg, Colina (min) 400 mg, Sodium (min) 26 g, Manganese (min) 160 mg, Iron (min) 630 mg, Iodine (min) 20 mg, Selenium (min) 6 mg, Avilamycin 200 mg,, Narasin + Navelbine 1000 mg + 1000 mg
Table 3 Average values of maximum (MaxT) and minimum (MinT) temperatures and relative air humidity (RelH) recorded during the evaluation period of broiler Cobb 500 chicks
| Period | Measure | MaxT (°C) | MinT (°C) | RelH (%) |
|---|---|---|---|---|
| Day 1 to 7 | Morning | 31.60 | 21.31 | 82.50 |
| Evening | 36.52 | 25.64 | 80.20 | |
| Day 8 to 35 | Morning | 29.70 | 22.33 | 83.50 |
| Evening | 35.65 | 26.67 | 81.62 | |
| Day36 to 42 | Morning | 29.64 | 20.40 | 79.45 |
| Evening | 34.55 | 21.32 | 78.82 |
Morning: 08:00; Evening: 16:00
Performance Evaluation
Birds were weighed at the arrival to the farm and on days 7, 35 and 42 of age always in the afternoon. Body weight gain/broiler/ day (WG), feed intake/broiler/day (FI) and feed conversion rate (FC) were determined. A 50 kg scale was used to determine the weights of the birds. All birds in a box were weighed together.
Feed consumption was calculated by the difference between offered ration in each phase and the residues weighted at the end of each phase using the above scale and divided by the number of broilers in the group. Feed conversion rate was calculated by the division of mean feed intake and mean body weight gain per each treatment group.
Carcass Yield
Seventy broilers (2 per each plot of the experimental unit) were weighed and identified. All birds were slaughtered at 42 days of age after a fasting period of 8 hours.
The broilers were slaughtered after desensitization by cervical displacement, hanged and blooded through a cut in the jugular, and then conducted the standard procedure slaughterhouse protocol.
The carcass was weighed as well as feathers, breast, thigh, upper thigh, wings, edible viscera (heart, liver, and gizzard) and non-edible viscera (proventriculus, duodenum, jejunum, ileum, cecum) and abdominal fat. The yield percentages of the different cuts, edible and inedible viscera, and abdominal fat were calculated by the ratio between the mean weights of each repetition and the mean carcass weight.
The identification of the gastrointestinal tract compartment was done as follows: proventriculus; gizzard; duodenum; jejunum; ileum and cecum (Valentim et al., 2020). The measurement of each compartment was made after emptying the intestinal content and the measurement was carried out using a 60 cm measuring tape (± 0.1 mm). To obtain relative length values, the segment of each segment was divided by the total length of the small intestine, and the results were multiplied by 100 (Valentim et al., 2020).
Statistical Analyses
The data were checked for the normality of the residues using the Shapiro-Wilk test and homogeneity of the variances using the Levene test. To estimate treatment effect on performance variables or DDGS inclusion levels (0, 4, 8, 12 and 16%), five regression models were adjusted for the observed WG, Fi and FC values. Three linear: 1st degree linear model: Y1ij = b0 + b1xi + eij (i), hyperbolic: Y1ij = b0 + b1xi-1 + eij (ii) and logarithmic: Y1ij = b0 + b1log10 (xi) + eij (iii) models; and two polynomials; 2nd degree linear model: Y1ij = b0 + b1xi + b2xi2 + eij (iv) and square root model: Y1ij = b0 + b1xi + b2xi0.5 + eij (v).
The level of significance for the statistical analyses was 95%. The analysis of variance; the estimation of predicted values for the treatments; the multiple comparison of means with Dunnett's test, comparing control to other treatments in case of p<0.05 for each; as well as the estimation of the regression coefficients for the proposed linear and polynomial models, were made with the software R (R Core Team, 2017).
RESULTS
The inclusion of five levels of DDGS did not influence the productive performance of broilers at phases 1 to 7 and 36 to 42 days of age (p>0.05; Table 4). This fact can be explained by the isonutritive characteristic of the experimental diets causing the broilers to maintain similar productivity.
Table 4 Average body weight gain (WG), feed intake (FI) and feed conversion rate (FC) of broilers fed with diets containing four DDGS inclusion levels
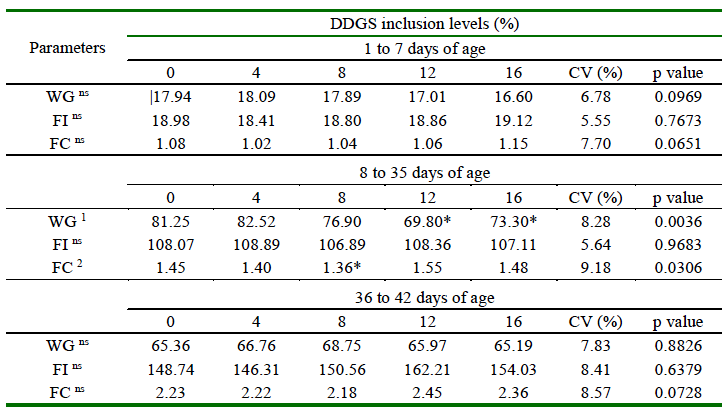
1 Quadratic effect (p<0.05)
CV: coefficient of variation. ns: not significant
Regression equation for WG: Ŷ = 86.824686 - 4.130953x + 0.211561x2; R2 = 72.5%; p-valor: 0.0012
Regression equation for FC: Ŷ = 1.484514 - 0.392467x + 0.020561x2; R2 = 41.2%; p-valor: 0.048
For broilers from 8 to 35 days of age, FC was not altered by the treatments, but the levels of DDGS showed a quadratic effect to WG and FC (p<0.05) in the regression analysis (Table 4). WG decreased at 12 and 16% DDGS inclusion levels when compared to control and based on the quadratic regression analysis, its maximum DDGS inclusion level was 9.8%. Possibly this could justify the production decrease, caused by the greater quantity of insoluble fibres present in the DDGS causing that nutrients be retained less time in the digestive tract impairing digestion, absorption and consequently affecting WG.
FC also differed by Dunnett's test (p<0.05), and the lower values were found at 8% of DDGS inclusion levels, therefore more efficient since WG was similar to control treatment. The quadratic effect estimated its maximum value at 9.5% of DDGS inclusion level showing that higher and lower values of DDGS inclusion level might impair broilers performance from 8 to 35 days of age.
The mean values of carcass and cuts of 42 days old broilers fed with diets containing five levels of DDGS are presented in Table 5. Quadratic effect was observed (p<0.05) on carcass weight and breast weight, with the maximum levels of use of 12.09 and 7.47% inclusion of DDGS respectively. The Dunnett test indicate lower weight values with 12 and 16% inclusion when compared to the control treatment.
Table 5 Carcass yield and cuts of broilers males at 42 days of age fed with diets containing levels of DDGS
| Corn DDGS levels (%) | CV (%) | p value | |||||
|---|---|---|---|---|---|---|---|
| 0 | 4 | 8 | 12 | 16 | |||
| Carcass weight (g)1 | 1825.00a | 1675.71a | 1757.86a | 1531.43b | 1527.14b | 7.49 | 0.0031 |
| Breast weight (g)1 | 253.57a | 242.86a | 247.14a | 230.57b | 218.71b | 6.90 | 0.013 |
| Thigh weight (g) | 243.57 | 220.71 | 222.86 | 211.43 | 212.14 | 10.09 | 0.686 |
| Weight drumstick (g) | 176.43 | 161.43 | 168.57 | 149.29 | 153.57 | 8.39 | 0.055 |
| Wing weight (g) | 82.844 | 82.113 | 80.100 | 79.319 | 79.626 | 3.48 | 0.258 |
| % Carcass | 75.257 | 73.224 | 72.038 | 71.343 | 71.546 | 4.95 | 0.761 |
| % Breast | 15.320 | 16.302 | 15.766 | 15.891 | 16.829 | 7.98 | 0.455 |
| % Thigh | 14.685 | 14.775 | 14.084 | 15.346 | 15.458 | 5.77 | 0.248 |
| % Weight | 10.640 | 10.820 | 10.695 | 10.845 | 11.220 | 6.94 | 0.578 |
| % Wing | 9.124 | 9.732 | 10.002 | 9.031 | 8.881 | 13.64 | 0.167 |
¹ Quadratic effect (p<0.05)
a,b Means with different superscript are significantly different at 5% probability by Dunnett test
Carcass weight: -112. 21x + 4 1654.00, 64 x²; R2 = 99.82%; p valor: 0.034
Breast: 542.57-64x + 4, 28 x²; R2 = 99.94%; p valor: 0.087
Organ weights of edible viscera and abdominal fat are shown in Table 6. There was a decreasing linear reduction (p<0.05) with respect to the levels of inclusion of DDGS in the diets and the contents of abdominal fat, especially at levels of inclusion of 12 and 16% in comparison with the control diet (p<0.05).
Table 6 Weight and relative weights of edible viscera in relation to the weight of the carcass in male broilers at 42 days of age fed with diets containing four levels of DDGS
| Levels of DDGS (%) | CV (%) | p value | |||||
|---|---|---|---|---|---|---|---|
| 0 | 4 | 8 | 12 | 16 | |||
| Weight (g) | 43.240 | 37.594 | 42.605 | 38.018 | 34.788 | 16.38 | 0.1613 |
| Liver weight (g) | 2.417 | 1.825 | 2.208 | 2.124 | 2.1243 | 15.33 | 0.5737 |
| Gizzard weight (g) | 9.811 | 11.401 | 13.831 | 13.338 | 12.1500 | 12.90 | 0.3977 |
| Abdominal fat (g)1 | 220.00a | 219.29a | 204.57a | 193.43a | 192.29b | 7.93 | 0.0130 |
| % Heart | 0.553 | 0.545 | 0.540 | 0.547 | 0.516 | 13.23 | 0.6371 |
| % Liver | 1.965 | 1.842 | 1.929 | 1.965 | 1.813 | 18.25 | 0.4098 |
| % Gizzard | 1.641 | 1.569 | 1.718 | 1.898 | 1.763 | 15.51 | 0.5179 |
| % Abdominal fat | 1.025 | 1.034 | 0.929 | 1.066 | 1.033 | 12.51 | 0.7046 |
1 Linear effect (p<0.05)
a,b Means with different superscript are significantly different at 5% probability by Dunnett test
Organ weights and sizes of non-edible viscera are shown in Table 7. No significant differences were found due according to weights and sizes of no-edible viscera based of the four levels of DDGS inclusion. The characteristics of isocaloric diets may explain the non-significant variables of the gastrointestinal tract (GIT), because even the DDGS having different values of amino acids and energy compared to corn and soybeans, no nutritional variation that could without prejudice to the requirements of the broilers in relation to income from the viscera, as happened amino acids supplementation according to each phase of production.
Table 7 Weight and relative weights of non-edible viscera in relation to the weight of the carcass in male broilers, and size and relative seize of duodenum, jejunum, ileum relation to the total size of the intestine in male broilers at 42 days of age fed with diets containing four levels of DDGS
| Levels of DDGS (%) | CV (%) | p value | |||||
|---|---|---|---|---|---|---|---|
| 0 | 4 | 8 | 12 | 16 | |||
| Proventriculus weight | 36.175 | 32.125 | 37.541 | 36.607 | 33.940 | 11.90 | 0.0864 |
| Spleen weight (g) | 22.611 | 21.082 | 20.590 | 20.505 | 19.820 | 13.99 | 0.9709 |
| Duodenal weight (g) | 18.724 | 15.954 | 17.281 | 17.041 | 18.960 | 10.56 | 0.2380 |
| Middle weight (g) | 19.618 | 18.324 | 20.707 | 19.487 | 18.070 | 15.10 | 0.3206 |
| Small intestine weight (g) | 15.461 | 15.510 | 17.540 | 14.834 | 15.344 | 19.02 | 0.3629 |
| Weight cecum (g) | 12.187 | 11.178 | 11.838 | 10.592 | 9.905 | 13.83 | 0.1296 |
| % proventriculus | 0.415 | 0.378 | 0.457 | 0.467 | 0.464 | 13.14 | 0.0697 |
| % Weight duodenum | 0.444 | 0.5631 | 0.638 | 0.692 | 0.493 | 20.18 | 0.1820 |
| % Weight jejunum | 0.854 | 0.773 | 1.020 | 1.141 | 0.982 | 15.08 | 0.5182 |
| % Weight ileum | 0.888 | 0.898 | 0.941 | 1.009 | 0.947 | 13.09 | 0.8269 |
| % Weight cecum | 0.701 | 0.762 | 0.811 | 0.765 | 0.811 | 14.35 | 0.9243 |
| Duodenum (cm) | 31.600 | 31.400 | 31.200 | 31.571 | 30.242 | 9.70 | 0.8457 |
| Jejunum (cm) | 71.142 | 73.100 | 74.942 | 74.071 | 71.157 | 11.44 | 0.8515 |
| Ileum (cm) | 78.857 | 79.842 | 79.428 | 79.700 | 75.028 | 10.28 | 0.6344 |
| Total GIT1 (cm) | 181.60 | 184.34 | 185.57 | 185.34 | 176.43 | 8.29 | 0.6342 |
| % (cm) duodenum | 17.419 | 17.210 | 16.841 | 17.035 | 17.128 | 9.75 | 0.9777 |
| % (cm) jejunum | 39.039 | 39.347 | 40.359 | 40.081 | 40.355 | 7.38 | 0.9098 |
| % (cm) ileum | 43.541 | 43.441 | 42.799 | 42.882 | 42.516 | 5.55 | 0.9050 |
1 Gastrointestinal tract
DISCUSSION
The results can be explained mainly by the fibre nature in the diet, since a greater amount of fibre increases the rate of passage in the digestive tract of the broiler and decreases the bolus retention increasing nitrogen and dry matter excretion as endogenous enzymatic action. These metabolic disruptions result in decreasing broiler performance (Mutucumarana et al., 2014; Schone et al., 2017). Such results can possibly be explained by a bad protein digestibility of DDGS, resulting in less muscle deposition.
Dinani et al. (2019) concluded that up to 6% level of corn DDGS can be used in broiler diets within 1 to 7 days of production with no significant changes in performance.
This means that the DDGS nutritional properties were not able to alter the performance of the broilers, even though they had less amino acid than the soybean meal, since the diets were supplemented with industrial amino acids. In contrast, the present research thus, up to 16% of corn DDGS can be used in the initial diet in broilers.
Konieczka et al. (2019) studying different DDGS inclusion levels of high protein corn, concluded that the treatment with 25% of this co-product obtained lower weigh gain and worse feed conversion when compared to control diet, in agreement with the present research. These authors justified this weight reduction because of the low amount and bioavailability of limiting amino acids for broilers, such as lysine, tryptophan and arginine. In addition to the variation of amino acids, the available energy is another factor to be observed in broiler nutrition (Hussain et al., 2019).
Thus, the same authors indicate to set the amino acids and energy quantities with DDGS inclusion levels greater than 10% in the diet, so that growth and feed conversion may not be negatively affected. The non-effect in the initial and final periods can be explained due to a precise industrial amino acid balance in the diets.
CONCLUSIONS
The recommended inclusion levels of DDGS for broilers are 16.0, 9.53 and 16.0%for1to7,8 to35and36to42 days of age, respectively.
There was a reduction on carcass weight and breast of male broilers slaughtered at 42 days with 12 and 16% DDGS.
The DDGS in diets can be considered an alternative ingredient in diets for broilers up to 12% inclusion.

