SciELO - Scientific Electronic Library Online

 
vol.34 número2Características textiles de la fibra de alpaca Huacaya, según zonas agroecológicas, sexo y edad en la Región Puno (Perú)Crecimiento y propiedades de la canal en ovinos de Pelo Criollo Colombiano (OPC) y F1 Dorper x OPC índice de autoresíndice de materiabúsqueda de artículos
Home Pagelista alfabética de revistas  

Servicios Personalizados

Revista

Articulo

Indicadores

  • No hay articulos citadosCitado por SciELO

Links relacionados

Compartir


Revista de Investigaciones Veterinarias del Perú

versión impresa ISSN 1609-9117

Rev. investig. vet. Perú vol.34 no.2 Lima mar./abr. 2023  Epub 28-Abr-2023

http://dx.doi.org/10.15381/rivep.v34i2.23668 

Artículos primarios

Variation of milk urea nitrogen according to milk yield and milk protein in Holstein cows in Boyacá, Colombia

Variación de la concentración de nitrógeno ureico en leche según la producción de leche y contenido proteico en vacas Holstein en Boyacá, Colombia

Luis Edgar Tarazona-Manrique1 
http://orcid.org/0000-0003-2819-0582

Roy José Andrade-Becerra1  * 

Julio César Vargas-Abella1 

1 Grupo de Investigación en Salud y Producción Animal del Trópico Alto Colombiano -GIPATRACOL, Laboratorio de Análisis de la Calidad de Leche y Control de Mastitis, Escuela de Medicina Veterinaria y Zootecnia, Universidad Pedagógica y Tecnológica de Colombia, Tunja, Boyacá, Colombia.

ABSTRACT

The aim of this study was to determine the variation of milk urea nitrogen (MUN) concentration according to milk yield and milk protein in Holstein cows in Boyacá, Colombia. Data previously collected (n=4901) over two years were used. Univariate analysis of variance was performed with the variables milk yield (l/day) and milk protein (%) as independent variables and the concentration of MUN as the dependent variable. In addition, a simple linear correlation analysis was performed between each variable. The results showed that MUN values are higher when milk yield is lower, but no statistical differences were found for MUN concentration according to milk protein content. Weak and negative correlation was found between milk yield and MUN concentration, but no significant correlation was found between milk protein and MUN concentration.

Key words: urea; milk yield; dairy cows; milk traits

RESUMEN

El objetivo del estudio fue determinar la variación de la concentración de nitrógeno ureico en leche (MUN) según los niveles de producción de leche por día y la proteína de la leche en vacas Holstein en Boyacá, Colombia. Se utilizaron datos recopilados (n=4901) durante dos años. Se realizó análisis de varianza univariante con las variables producción de leche (l/día) y proteína de leche (%) como variables independientes y la concentración de MUN como variable dependiente. Además, se realizó un análisis de correlación lineal simple entre cada variable. Los resultados mostraron que los valores de MUN son mayores cuando la producción de leche es menor, pero no se encontraron diferencias estadísticas para la concentración de MUN según el contenido de proteína de la leche. Se encontró una correlación débil y negativa entre la producción de leche y la concentración de MUN, pero no se encontró una correlación significativa entre la proteína de la leche y la concentración de MUN.

Palabras clave: urea; producción de leche; vacas lecheras; características de la leche

INTRODUCTION

Urea is a product of protein metabolic processes. In ruminants, its main source is the ammonium formed in the rumen, which is transformed into urea in the liver and protein body catabolism (Mucha & Stangberg, 2011; Jin et al., 2018; Tarazona-Manrique et al., 2021). Blood urea nitrogen (BUN) can cross the epithelial barriers of the mammary gland and exit through milk. The metabolite found in milk is called milk urea nitrogen (MUN) and its concentration is related to BUN (Ruska & Junkens, 2014).

MUN is strongly linked with external factors such as the climatic season, as well as aspects of feeding such as the percentage of protein, the energy/protein ratio and its digestibility, and factors related to the animal such as the ruminal microbiome, number of calvings, days in milk (DIM) and production level, among others (Doskaet al., 2012; Conti et al., 2014; Kananub et al., 2018; Tarazona-Manrique et al., 2021).

The monitoring of MUN concentration in milk has comparative advantages to serum samples because milk sampling is atraumatic for the animal, avoiding stressful situations that can affect its productive regimen and cause accidents both for the veterinarian and for the animal (Sánchez, 2016). In addition, this monitoring allows the identification of the relationship of its concentration with possible reproductive alterations, an increase in somatic cell counts, and even a negative environmental impact through an increased nitrogen excretion (Doska et al., 2012; El Shewy et al., 2010; Kgole et al., 2012; Spek et al., 2012).

Some studies in Colombia aimed at determining increasing levels of non-protein nitrogen and its influence on nitrogenous metabolites, including MUN (Galvis et al., 2011), fluctuations in MUN together with lactose during lactation (Henao et al., 2014), and the effect of DIM and seasons on variation of MUN in dairy cows of the Boyacá highlands (Tarazona-Manrique et al., 2021); however, no studies have been found determining if the concentration of MUN varies concerning milk production and protein concentration in milk in the productive context of Boyacá. Therefore, the aim of this study was to determine the variation and correlation between MUN content according to milk yield and total protein in milk of Holstein cows in the department of Boyacá, Colombia.

MATERIALS AND METHODS

Type of Study

A retrospective study was conducted using data obtained in a previous study between January 2018 and December 2019 in the municipality of Duitama-Boyacá. There, second and third parity Holstein cows from two farms (n=112) were selected. Cows were in healthy conditions, without respiratory, reproductive, and udder diseases (somatic cell count<200 000 cells/m). Feeding conditions, sampling, and processing can be found in Tarazona-Manrique et al. (2021).

Data Analysis

Data from 4901 milk samples, including MUN concentration (mg/dl), somatic cell count (cells/ml), milk yield (l/day), and physicochemical analysis of milk (percentage of fat, protein, and lactose) were stored in an MS Excel(r) sheet. For this study, only the MUN, milk yield, and milk protein percent data were considered for the statistical analysis.

Samples were analysed at the Laboratory of Milk Quality Analysis and Mastitis Control at the Universidad Pedagógica y Tecnológica de Colombia. MUN analysis was performed using the enzymatic spectrophotometric methodology using a Mindray BS120 kit using the Urea kit from LAB TEST at a wavelength of 450 nm. The physicochemical analysis of milk was performed at the same lab, using the Milkoscan Mars(r) (FOSS). In addition, somatic cell counting was performed with a Fossomatic(tm) 7-based flow cytometry.

The data was grouped according to levels of milk yield as Group 1 (<10 l/day), Group 2 (≥10 and <15 l/day), and Group 3 (≥15 l/day) and according to protein percent as Group 1 (>2.3 and <3.0%), Group 2 (≥3.0 and <3.5%) and Group 3 (≥3.51 and <4.3%), without considering the year of sampling or farm. Univariate analysis of variance was performed using the comparison of the means Fisher's least significant difference (LSD) procedure, with a confidence level of 95% (p<0.05). The Statgraphics Centurion(r) software for Windows 10 was used. The independent variables were milk yield and protein percent and the dependent variables for both cases were the MUN concentration. In addition, a simple linear correlation analysis was performed between each variable, positioning the MUN variable on the "y" axis, and protein percent and daily milk yield on the "x" axis.

RESULTS

MUN concentration according to levels of milk yield significantly varied between groups, but not between and milk protein groups (Table 1).

Table 1 Average milk urea nitrogen (MUN, mg/dl) according to milk yield (l/day) and milk protein content (%) in Holstein cows (Boyacá, Colombia) 

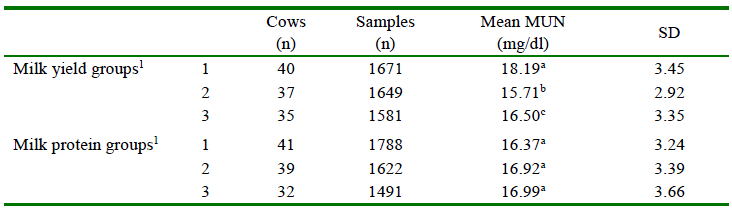
a,b,c Different superscripts indicate significative differences (p<0.05)

1 Group 1: <10 l/d, Group 2: ≥10-<15 l/d; Group 3: ≥15 l/d

2 Group 1: >2.3-<3.0%, Group 2: ≥3.0-<3.5%, Group 3: ≥3.5-<4.3%

SD: Standard deviation of the mean

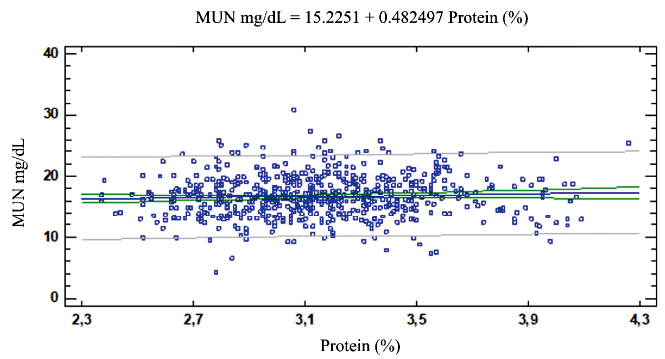
The results of the simple linear correlation analysis for each variable are displayed in figures 1 and 2. The correlation coefficient between the variables MUN and milk yield per day showed a weak and negative correlation (-0.125; p<0.05). However, the correlation coefficient between MUN and milk protein percent (0.048) was not statistically significant.

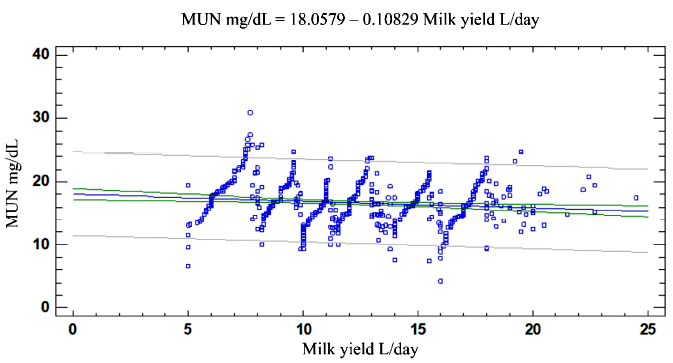
Figure 1 Simple correlation analysis for variables milk urea nitrogen (MUN, mg/dl) and daily milk yield in Holstein cows in Boyacá, Colombia 

Figure 2 Simple correlation analysis for variables milk urea nitrogen (MUN, mg/dl) and milk protein percent in Holstein cows in Boyacá, Colombia 

DISCUSSION

This is the first study in the context of the Boyacá highlands evaluating the variation of MUN in relation to milk yield and milk protein. In this study, significant differences were found between levels of milk yield and MUN concentration, where MUN concentration is reduced with the increase in milk yield; however, the correlation analysis failed to prove this relationship. On the other hand, Henao et al. (2014) in Antioquia, Colombia determined that milk yield was not related to MUN concentration. The reasons for these changes in MUN concentrations were unclear. Feeding was not probably an issue if considering the feeding quality and management were quite similar and the two farms were not more than 3 km apart.

Montoya-Zuluaga et al. (2017) working in Antioquia found that as milk protein content increased the concentration of MUN decrease; however, in the present study there were no statistical differences between MUN concentration due to protein content and the correlation coefficient was also not significant. These differences might be related to the type of feeding, although these authors did not indicate the type of diet used.

Regarding the concentrations of MUN and milk protein in milk, several research groups (Godden et al., 2001; Arunvipas et al., 2003; Stoop et al., 2007; Hossein & Ardalan, 2011; Mucha & Strandberg, 2011; Doska et al., 2012) determined a weak and positive correlation between the two variables, but without statistical power. On the other hand, in regards to the correlation between MUN and milk yield, various studies show a positive correlation (Godden et al., 2001; Meyer et al., 2006; Hossein &Ardalan, 2011; Doska et al., 2012; Nozad et al., 2012; Roveglia et al., 2019) associating these results to protein-rich diets in high-producing cows (Sousa et al., 2006), while other studies found no relationship between these two parameters (Gustafsson & Carlsson, 1993; Eicher et al., 1999), and even negative association (Trevaskis & Fulkerson, 1999; Stoop et al., 2007), as revealed in this study.

CONCLUSIONS

  • Milk urea nitrogen (MUN) concentration is reduced with the increase in milk yield, but without differences due to levels of milk protein in Holstein cows of the Boyacá highlands.

  • Weak and negative correlation was found between milk yield and MUN concentration, but a non-significant correlation between milk protein percentage and MUN concentration.

REFERENCES

1. Arunvipas P, Dohoo I, Vanleeuwen J, Keefe G. 2003. The effect of non-nutritional factors on milk urea nitrogen levels in dairy cows in Prince Edward Island, Canada. Prev Vet Med 59: 83-93. doi: 10.1016/s0167-5877(03)00061-8. [ Links ]

2. Conti L, Jesus E, Pereira A, Arcari M, Junior K, Rennó F, Santos M. 2014. Nitrogen balance and milk composition of dairy cows fed urea and soybean meal and two protein levels using sugarcane-based diets. Braz J Vet Res Anim Sci 51: 242. doi: 10.11606/issn.1678-4456.v51i3p242-251. [ Links ]

3. Doska M, Ferreira D, Horst J, Valloto A, Rossi P, Almeida R. 2012. Sources of variation in milk urea nitrogen in Paraná dairy cows. Rev Bras Zootecn 41: 692-697. doi: 10.1590/S1516-35982012000300032. [ Links ]

4. Eicher R, Bouchard E, Bigras-Poulin M. 1999. Factors affecting milk urea nitrogen and protein concentrations in Quebec dairy cows. Prev Vet Med 39: 53-63. doi: 10.1016/s0167-5877(98)00139-1. [ Links ]

5. El Shewy T, Kholif S, Morsy, T. 2010. Determination of milk urea nitrogen for the Egyptian cattle fed the summer and winter diets. J Amer Sci 6: 382-384. [ Links ]

6. Galvis R, Correa H, Barrientos S, Muñoz Y. 2011. Efecto de niveles crecientes de nitrógeno no proteico dietario en vacas lactantes sobre las concentraciones de metabolitos nitrogenados en orina, sangre y leche. Rev Fac Nal Agr Medellín 64: 6191-6198. [ Links ]

7. Godden S, Lissemore K, Kelton D, Leslie K, Walton J, Lumsden J. 2001. Factors associated with milk urea concentrations in Ontario dairy cows. J Dairy Sci 84: 107-114. doi: 10.3168/jds.S0022-0302(01)74458-X. [ Links ]

8. Gustafsson AH, Carlsson J. 1993. Effects of silage quality, protein evaluation systems, and milk urea content on milk yield and reproduction in dairy cows. Livest Prod Sci 37: 91-105. doi: 10.1016/0301-6226(93)90066-Q. [ Links ]

9. Henao A, Múnera O, Herrera A, Agudelo J, Cerón M. 2014. Lactose and milk urea nitrogen: fluctuations during lactation in Holstein cows. Rev Bras Zootecn 43: 479-484. doi: 10.1590/S1516-35982014000900004. [ Links ]

10. Hossein N, Ardalan M. 2011. Estimation of genetic parameters for milk urea nitrogen and its relationship with milk constituents in Iranian Holsteins. Livest Sci 135: 274-281. doi: 10.1016/j.livsci.2010.07.020. [ Links ]

11. Jin D, Zhao S, Zheng N, Bu D, Beckers Y, Wang J. 2018. Urea nitrogen induces changes in rumen microbial and host metabolic profiles in dairy cows. Livest Sci 210: 104-110. doi: 10.1016/j.livsci.2018.02.011. [ Links ]

12. Kananub S, Vanleeuwen J, Arunvipas P. 2018. Association between milk urea nitrogen and first service conception in smallholder dairy farms under heat and humidity stress. Vet World 11: 1604-1608. doi: 10.14202/vetworld.2018.1604-1608. [ Links ]

13. Kgole M, Visser C, Banga, C. 2012. Environmental factors influencing milk urea nitrogen in South African Holstein cattle. SAfr JAnim Sci 42: 459-463. doi: 10.4314/sajas.v42i5.3. [ Links ]

14. Meyer P, Machado P, Coldebella A, Cassoli L, Coelho K, Rodrigues P. 2006. Fatores não-nutricionais e concentração de nitrogênio uréico no leite de vacas da raça Holandesa. Rev Bras Zootecn 35: 1114-1121. doi: 10.1590/s1516-35982006000400024. [ Links ]

15. Montoya-Zuluaga J, Múnera-Bedoya O, Cerón-Muñoz M. 2017: Factores relacionados con nitrógeno ureico en leche de vacas lecheras. Liv Res Rural Develop 29(10). [Internet]. Disponible en: http://www.lrrd.org/lrrd29/10/cero29197.html. [ Links ]

16. Mucha S, Strandberg E. 2011. Genetic analysis of milk urea nitrogen and relationships with yield and fertilityacross lactation. J Dairy Sci 94: 5665-5672. doi: 10.3168/jds.2010-3916. [ Links ]

17. Nozad S, Ramin A, Moghadam G, Asri-Rezaei S, Babapour A, Ramin S. 2012. Relationship between blood urea, protein, creatinine, triglycerides and macro-mineral concentrations with the quality and quantity of milk in dairy Holstein cows. Vet Res Forum 3: 55-59. [ Links ]

18. Roveglia C, Niero G, Penasa M, Finocchiaro R, Marusi M, Lopez-Villalobos N, Cassandro M. 2019. Phenotypic analysis of milk composition, milk urea nitrogen and somatic cell score of Italian Jersey cattle breed. It J Anim Sci 18: 405-409. doi: 10.1080/1828051x.2018.1531684. [ Links ]

19. Ruska D, Junkens D. 2014. Crude protein and non-protein nitrogen content in dairy cow milk. Proc Latv Univ Agr 32: 36-40. doi: 10.2478/plua-2014-0011. [ Links ]

20. Sánchez J. 2016. Nitrógeno ureico en leche: importancia, determinación y relación con otros componentes lácteos. Nutr Anim Trop 10: 20-37. doi: 10.15517/nat.v10i2.26111. [ Links ]

21. Sousa C, Valvasori E, Peixoto K, Fontolan V. 2006 Concentrações de nitrogênio na dieta, no sangue e no leite de vacas lactantes no período pós-parto. Rev Bras Zootecn 35: 258-263. doi: 10.1590/S1516-35982006000100033. [ Links ]

22. Spek J, Dijkstra J, Van Duinkerken G, Bannink A. 2013. A review of factors influencing milk urea concentration and its relationship with urinary urea excretion in lactating dairy cattle. J Agr Sci 151: 407-423. doi: 10.1017/S0021859612000561. [ Links ]

23. Stoop W, Bovenhuis H, Van Arendonk J. 2007. Genetic parameters for milk urea nitrogen inrelation to milkproduction traits. J Dairy Sci 90: 1981-1986. doi: 10.3168/jds.2006-434. [ Links ]

24. Tarazona-Manrique LE, Andrade-Becerra RJ, Archila-Barrera O. 2021. Variation of milk ureic nitrogen according to season and days in milk. Rev MVZ Córdoba 26: e2012. doi: 10.21897/rmvz.2012. [ Links ]

25. Trevaskis LM, Fulkerson WJ. 1999. The relationship between various animal and management factors and milk urea, and its association with reproductive performance of dairy cows grazing pasture. Livest Prod Sci 57: 255-265. doi: 10.1016/S0301-6226(98)00174-2. [ Links ]

Estudio financiado por la Universidad Pedagógica y Tecnológica a través del proyecto de investigación 3200.

Received: September 21, 2022; Accepted: March 28, 2023

Creative Commons License This is an open-access article distributed under the terms of the Creative Commons Attribution License