


 Español (pdf)
 Articulo en XML
 Referencias del artículo
 Enviar articulo por email
 Citado por SciELO
  Similares en
SciELO
Similares en
SciELO 
 Permalink
1. Introduction
Over the years, marketers and advertisers have been using qualitative approaches (i.e., interviews, focus groups) and quantitative methods (i.e., questionnaires) to study consumers’ behaviour (i.e., purchase behaviour). In the last decade, business and marketing research had an increasing interest in using neuroscientific methods such as functional magnetic resonance imaging (fMRI) to explore what is in consumers’ minds and predict consumers’ purchase decisions toward marketing practices (Alsharif et al., 2021b; Cherubino et al., 2019). In recent years, the interest in using neuroscientific methods led the researcher to a new field known as “neuromarketing” (Stanton et al., 2017). Smidts (2002) is the first researcher who has coined the term “neuromarketing” in 2002, and he defined it as the application of neuroscience tools in the business field (Alsharif et al., 2021a; Cherubino et al., 2019; Sánchez-Fernández et al., 2021). Venkatraman et al. (2015) defined it as the commercial application of consumer neuroscience. Therefore, marketing and business research have blossomed and expanded in recent years by using several methods such as neuroimaging and physiological tools to pinpoint the consumers’ behaviours (i.e., purchase decisions) and the neural correlates of emotional processes and cognitive processes toward marketing stimuli (e.g., advertising, brands) (Alsharif et al., 2021e). Therefore, the combination of traditional marketing and neuromarketing methods can be provided with a piece of valuable information about consumers’ behaviour (i.e., conscious and unconscious reactions) (Sebastian, 2014).
Admittedly, methods and tools are highly significant in neuromarketing research. Therefore, tools used in neuromarketing research have been divided into two clusters: (i) neurophysiological tools such as functional magnetic resonance imaging (fMRI), electroencephalography (EEG), magnetoencephalography (MEG), positron emission tomography (PET), and transcranial magnetic stimulation (TMS); and (ii) Physiological tools such as galvanic skin response (GSR), eye-tracking (ET), implicit association test (IAT), electromyography (EMG), and electrocardiogram (ECG) (Isabella et al., 2015). Neuroimaging/neurophysiological tools such as EEG and fMRI are the most favourable/ popular tools among researchers (Alsharif et al., 2021b; Alsharif et al., 2020b; Harris et al., 2018).
Hence, in an effort to dig deeper into the neuromarketing domain. Based on the aforementioned literature, this study aims to provide comprehensive information about global trends of neuromarketing research in the last decade, such as the most productive authors, countries, academic institutions, journals, the number of articles and citations to be considered in marketing studies, besides, the citation trends and co-citation network between references. This study differs from other review papers relevant to neuromarketing in terms of the discussion of the global trends of neuromarketing research. To this end, this review paper attempts to incorporate as many trends as possible, wherein this study tries to investigate deeply the global trends to accomplish an accurate, concrete, and concise conclusion. The main contributions of the current bibliometric study are summarised below:
Present a descriptive analysis of the annual and cumulative publication, besides the journal outputs in the last five years, which is facilitating for new researchers in neuromarketing and give them an overview of global research trends in neuromarketing.
Provide comprehensive information about the recent global academic trends in the neuromarketing/consumer neuroscience domain, such as the most prolific countries, academic institutions, authors, journals, and the most cited articles to be considered for further studies.
Provide new references and directions to new researchers in the neuromarketing field.
The organisation of the recent paper, as follows: Section 2 provides the materials and methods that have been used in this paper. Section 3 presents the descriptive and bibliometrics analysis of the selected documents. Section 4 discusses the findings of the recent paper. Section 5 presents the conclusions, limitations, and future trends in neuromarketing.
2. Materials and methods
The researchers used a bibliometric analysis to simplify the global trends in neuromarketing according to the outputs of publications such as the most/top productive (e.g., countries, academic institutions, authors, journals), the number of publications and citations to evaluate the blossoming in the neuromarketing and consumer neuroscience field in the last five years (Alsharif et al., 2021e). Moreover, this paper has been structured based on the Preferred Reporting Items for Systematic Reviews and Meta-Analyses (PRISMA) framework of Moher et al. (2015) to extract the relevant document in neuromarketing and consumer neuroscience for this study to fill the gap in the literature. The current study is designed to extract documents from the Scopus database to answer the research questions. Because Scopus database is the largest database of abstract and citation, which covers a broad range of themes, as well it is covering more themes that might not available in the Web of Science (WOS) (Alsharif et al., 2020a; Khudzari et al., 2018).
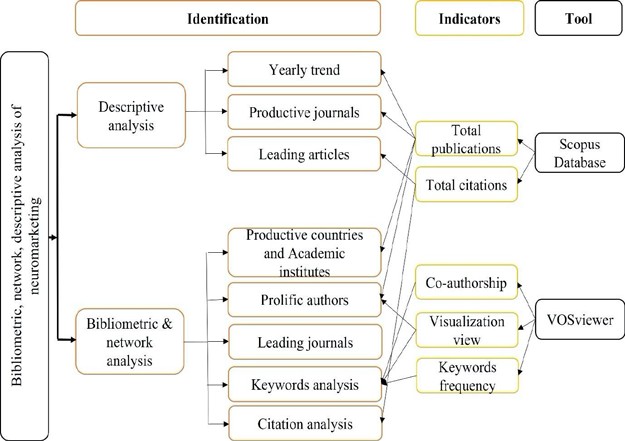
Therefore, instructions of Block & Fisch (2020) have been followed to present an impactful bibliometric analysis and assessing the structure of a specific area by identifying the most productive countries, academic institutions, journals, and authors with a brief description of each section. VOSviewer software has been used to map the literature of this study as it is a powerful/impactful tool to create a visualisation view/map according to the area of interest. This VOSviewer has been widely used in bibliometric research in various domains, for example, in neuromarketing (Alsharif et al., 2021d; Alsharif et al., 2021e; Alsharif et al., 2021f; Sánchez-Fernández et al., 2021), service quality in healthcare (Ali et al., 2021a), mobile healthcare (Ali et al., 2021c), services and service quality (Ali et al., 2021b),maven and mavenism (Abbas et al., 2020a), electronic word of mouth (EWOM) (Abbas et al., 2020b). Figure 1 shows the structure, indicators, and tools that have been used in this study. These processes will give us a deep insight into developing in the neuromarketing field. Additionally, it would provide us with a comprehensive understanding of the most productive (e.g., academics institutions, authors) to be considered for further neuromarketing research. Therefore, the findings provide a guide for scholars who are interested in neuromarketing and consumer neuroscience field.
2.1 Search criteria
Data collection was carried out in July 2021 from the Scopus database. Many various studies have been conducted by using the Scopus database. Researchers and institutions widely use the Scopus database to know the current status of a specific field, and it provides researchers with the chance to import a bibliography database such as affiliations, references, publishers, citations, and so forth. This search has been limited by using the following query applied to the title, abstract, and keywords (“neuromarketing” OR “consumer neuroscience”). The total number of publications was 641 documents from 2004-2021. It has extracted 119 documents (97 articles, 12 conference papers, and 10 review articles) from the Scopus database between 2015-2020. Authors focused on the period from 2015 to 2020 because it has been noticed that the number of publications in neuromarketing has been largely increased in that period. The authors have been focused on the publications in the English language because English language is widely used among researchers and exploring as many documents as possible, and to better understand the current global research trend in neuromarketing such as number of publications, citations, countries/academic institutions.
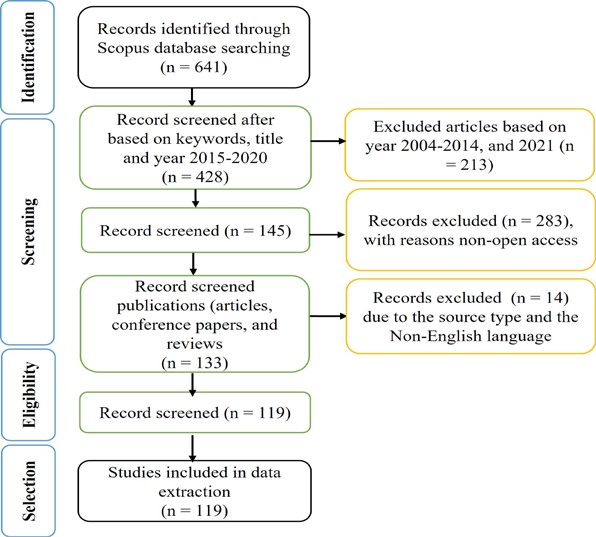
As shown in Figure 2, we followed PRISMA framework which includes four stages: (i) identification as recording identified through database searching, (ii) screening the record publications, (iii) eligibility means assessment the eligible publications for this review, and (iv) selecting and including studies, as follow:
Documents (i.e., articles, conference papers, and reviews) published in neuromarketing or consumer neuroscience in the last five years were included.
Documents that used neuromarketing tools were included.
Only documents in the English language were included.
Documents such as book chapters, erratum, editorials, notes were excluded.
3. Results
3.1 Descriptive analysis
A descriptive analysis of 119 documents has been analysed; these papers were published in the neuromarketing/consumer neuroscience domain and used neuromarketing tools to know the global trend in the neuromarketing domain terms of annual and cumulative publications, countries/ academic institutions, and journals.
Growth of the publication
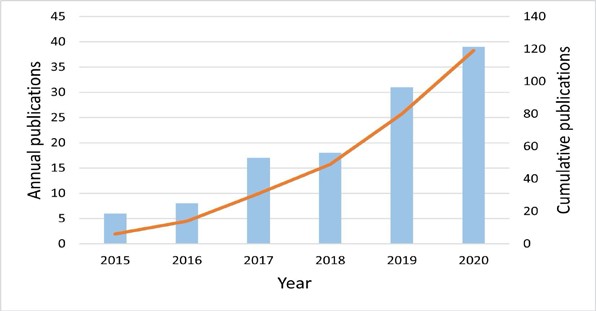
A total of 119 documents in neuromarketing/consumer neuroscience have been published in an academic journal. The first article in neuromarketing/consumer neuroscience was published in 2004, which was investigated in branding and memory-based brand choice (McClure et al., 2004). It has seen a remarkable increase in publications number from 2015-2020, but the most remarkable growth was noticed in 2020 with more than 39 documents; it has published more than 50% of total documents just in the last two years, as depicted in Figure 3. Figure 3 shows the increasing number of publications from 2015 to 2020. For example, in 2015, it published six documents, while this number of publications has been increased in 2017 two times. Interestingly, the number of publications in 2020 has increased almost six times as in 2015, with approximately 40 documents. In addition, it is expected that the number of publications will increase year by year due to the fact that the neuromarketing domain has become a hot topic in the business field in the last five years.
Source: Own illustration.
Figure 3 The annual and cumulative publications in neuromarketing from 2015-2020
Journal outputs
The findings revealed that the most ten journals belong to seven publishers and six countries that published forty-nine documents, as tabulated in Table 1. For example, Frontiers Media Sa and MDPI publishers are the main players in the neuromarketing/consumer neuroscience domain, with twenty-nine publications representing almost 24% of total documents. The most productive journals belong to Frontiers Media Sa publisher. The rest of the journals were published five documents or below. Furthermore, the most productive journal was the Frontiers in Psychology, with 11 documents that represent almost 9 % of the total documents. Followed by Frontiers in Neuroscience (almost 9%), which published the most second cited document with 46 citations by Ramsoy et al. (2018). Journal of Comunicar published the most cited document with 58 citations by Cuesta-Cambra et al. (2017). According to Cite Score in 2020, three journals have CiteScore higher than 5. Interestingly, Comunicar has the highest Cite Score (7.3) despite being the fourth most productive journal in neuromarketing. The second highest Cite Score belongs to Frontiers in Neuroscience (5.4). That means the number of publications does not necessarily reflect the number of citations.
Table 1 The most Productive journal in neuromarketing and advertising (with min. 3 documents)
| Source/Journal | TP | TC 2020 | Cite Score 2020 | Reference of the most cited document | Time cited | Publisher | Country |
|---|---|---|---|---|---|---|---|
| Frontiers in Psychology | 11 | 28 | 3.5 | Guixeres et al. (2017) | 25 | Frontiers Media Sa | Switzerland |
| Frontiers in Neuroscience | 9 | 46 | 5.4 | Ramsoy et al. (2018) | 21 | Frontiers Media Sa | Switzerland |
| Cogent Psychology | 5 | 41 | 1.4 | Bosshard et al. (2016) | 20 | Taylor & Francis AS | England |
| Comunicar | 5 | 58 | 7.3 | Cuesta-Cambra et al. (2017) | 17 | Grupo Comunicar | Spain |
| Procedia Computer Science | 4 | 6 | 3.0 | Avinash et al. (2018) | 6 | Elsevier | Netherlands |
| Behavioural Science | 3 | 11 | 3.4 | Harris et al. (2019) | 9 | MDPI | Switzerland |
| Frontiers in Human Neuroscience | 3 | 25 | Breiter et al. (2015) | 22 | Frontiers Media Sa | Switzerland | |
| Neuroscience Research Notes | 3 | 1 | 0.8 | Iloka & Onyeke (2020) | 1 | Neurotak Publishing | Malaysia |
| PloS ONE | 3 | 11 | 5.3 | Minguillon et al. (2017) | 7 | Public Library Science | USA |
| Sustainability | 3 | 5 | 3.9 | Constantinescu et al. (2019) | 4 | MDPI | Switzerland |
TP; total publication, TC; total citations
3.2 Bibliometric analysis
Productive countries and institutions
A total of 119 documents have been extracted from the Scopus database. Table 2 shows that four countries (i.e., Spain, UK, Malaysia, USA, Germany, and Italy) are the key players in the neuromarketing domain, which have published more than 60% of the total documents since2015. This led to infer that these countries play a vital role in the blossoming of studies in neuromarketing. Additionally, Spain is the most productive country in the list with 21 documents (approximately 18% of total documents), followed by the UK as the second-productive country with 15 documents (13%). Although Malaysia ranked in the third position in the list with 11 publications (9%), its institute (Universiti Malaysia Sabah) has published the second-highest cited articles with 36 citations. The rest of the countries contributed with less than ten documents each. Moreover, according to the most prolific academic institutions, Universidad Complutense de Madrid has published seven documents with 35 citations, followed by the University of Oxford, Zhejiang University of Technology, Vilniaus Gedimino Technikos Universitetas that were published four documents each. Interestingly, although Sapienza Università di Roma and Universiti Malaysia Sabah ranked in the fifth and sixth position, respectively, with three documents each, they have published the highest, and the second-highest cited documents with 48 and 36 citations. The other institutions have published less than two documents. The remaining academic institutions published less than four documents each.
Table 2 The most productive countries and academic institutions (minimum contributions six documents)
| Country | TP | TC | H- index | The most prolific academic institutions | TPi | TCi |
|---|---|---|---|---|---|---|
| Spain | 21 | 104 | 7 | Universidad Complutense de Madrid | 7 | 35 |
| UK | 15 | 96 | 6 | University of Oxford | 4 | 27 |
| Malaysia | 11 | 61 | 5 | Universiti Malaysia Sabah | 3 | 36 |
| USA | 9 | 77 | 5 | Singularity University | 2 | 10 |
| Germany | 8 | 36 | 4 | Ludwig-Maximilians-Universität München | 2 | 21 |
| Italy | 8 | 25 | 4 | Sapienza Università di Roma | 3 | 48 |
| China | 7 | 30 | 4 | Zhejiang University of Technology | 4 | 18 |
| Lithuania | 7 | 9 | 2 | Vilniaus Gedimino Technikos Universitetas | 4 | 2 |
| Netherlands | 7 | 20 | 4 | Universiteit van Amsterdam | 2 | 17 |
| Japan | 6 | 12 | 2 | International University Health and Welfare | 1 | 1 |
TP; total publication, TC; total citations, TPi; total publications by institution, TCi; total citation for institution
Leading authors
The top prolific authors who have published at least three documents in neuromarketing are affiliated to nine countries, as tabulated in Table 3. These authors have published a total of 34 documents, which indicates a high collaboration among them. Ma, Q. from China is the most prolific author with four documents and 11 citations. The rest of the authors have published three documents each. Interestingly, despite the fact that Teo, J. from Universiti Malaysia Sabah (Malaysia) is in the 9th position in the list, he has published three documents with the highest cited documents with 36 citations. Ramsoy, T.Z. from Neurons Inc (Denmark) has also published three documents with the second-highest cited documents with 31 citations. Finally, Kaklauskas, V. from Vilniaus Gedimino Technikos Universitetas (Lithuania) has published the least cited documents with two citations.
Table 3 The most productive authors in neuromarketing domain (minimum contributions three documents)
| Author's name | TP | TC 2020 | Affiliation | Country |
|---|---|---|---|---|
| Ma, Q. | 4 | 11 | Zhejiang University of Technology | China |
| Berčík, J. | 3 | 9 | Slovak University of Agriculture | Slovakia |
| Grigaliunaite, V. | 3 | 7 | Vytautas Magnus University | Lithuania |
| Kaklauskas, A. | 3 | 2 | Vilniaus Gedimino Technikos Universitetas | Lithuania |
| Mañas-Viniegra, L. | 3 | 5 | Universidad Complutense de Madrid | Spain |
| Pileliene, Lina | 3 | 7 | Vytautas Magnus University | Lithuania |
| Ramsøy, T.Z. | 3 | 31 | Neurons Inc | Denmark |
| Schneider, T. | 3 | 11 | University of St. Gallen | Switzerland |
| Teo, J. | 3 | 36 | Universiti Malaysia Sabah | Malaysia |
| Tur-Viñes, V. | 3 | 5 | Universitat d’Alacant | Spain |
| Woolgar, S. | 3 | 11 | Linköpings Universitet | Sweden |
Leading journals
The ten most productive journals in neuromarketing have been identified, which have published at least three documents (Table 4). Frontiers in Psychology has been ranked as the most prolific journal among others with 11 documents (approximately 9% of total documents), while the other journals have published less than 10 documents each. To identify the productivity and impact of journals in neuromarketing, we have followed the number of publications for each author as an indicator of productivity and the average citation per item (ACi) as an indicator of journal impact. ACi has been calculated based on a number of citations and publications from the Scopus database, as tabulated in Table 4. Although Communicar journal has only published five documents in neuromarketing, it has the highest ACi in the list with 11.6 citations. Followed by Cogent Psychology with 8.2 citations. These findings illustrate that a large number of publications does not necessarily reflect a large number of citations.
Table 4 The most Productive journal in neuromarketing and advertising (with min. 3 documents)
| Source/Journal | TP | TC 2020 | ACi |
|---|---|---|---|
| Frontiers in Psychology | 11 | 28 | 2.6 |
| Frontiers in Neuroscience | 9 | 46 | 5.1 |
| Cogent Psychology | 5 | 41 | 8.2 |
| Comunicar | 5 | 58 | 11.6 |
| Procedia Computer Science | 4 | 6 | 1.5 |
| Behavioral Science | 3 | 11 | 3.7 |
| Frontiers in Human Neuroscience | 3 | 25 | 6.3 |
| Neuroscience Research Notes | 3 | 1 | 0.3 |
| PloS ONE | 3 | 11 | 3.7 |
| Sustainability | 3 | 5 | 1.7 |
ACi; average citation per item
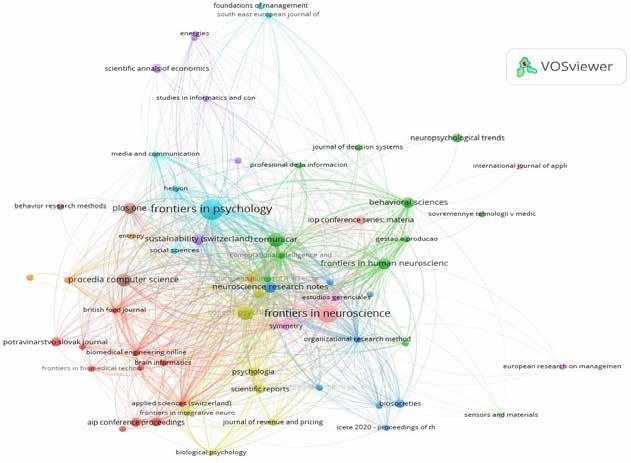
Figure 4 illustrates the map of all journals, which have published more than one document in neuromarketing or consumer neuroscience, wherein it has found 119 documents that have been published by 69 journals.
Keywords analysis
The keywords occurrences are expressed in a numerical method in bibliometric analysis (Wang, M. & Chai, 2018) to investigate keywords, which provide a coherent interpretation of the articles’ content (Alsharif et al., 2020a; Alsharif et al., 2021c; Comerio & Strozzi, 2019), meanwhile, the correlation between a couple of keywords is also expressed in a numerical value, which refers to link strength between these two keywords; a higher numerical value means a stronger link (Ravikumar et al., 2015). The link strength between two keywords represents the number of appearances of both these keywords in the same article. The total number of links indicates the aggregate number of appearances together in the same document. In VOSviewer, we set five as the minimum occurrences of author keywords, which means keywords will appear on the bibliometric map at least five times between these two keywords that occur together in the same document. In this study, author keywords co-occurrence analysis has been carried out, which involved 14 keywords from 119 articles in 69 sources with minimum number five of keyword occurrences.
Using the Following URL to Open this Map in VOSviewer URL: https://bit.ly/3tlQLgZ
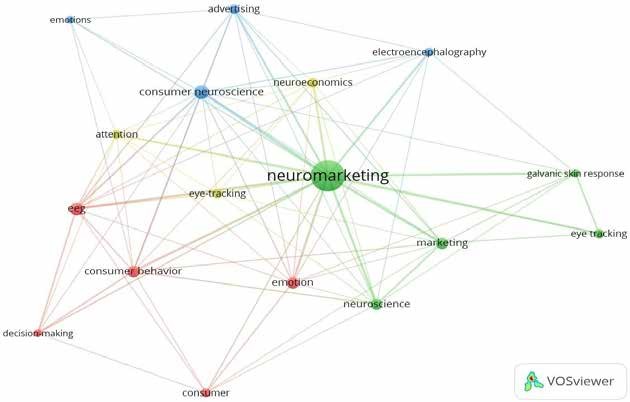
Co-occurrence keywords analysis is essential to provide general ideas/claims about the articles’ content (Comerio & Strozzi, 2019). Additionally, it is an effective technique to address the research directions and evaluate the hot themes in a specific topic (e.g., neuromarketing) by exploring the recent academic documents in neuromarketing trends (Alsharif et al., 2021e). As we can see from the map of the keywords co-occurrences (Figure 5), neuromarketing focused on consumer behaviour such as emotion (15 occurrences, 25 TLS), attention (6 occurrences, 16 TLS), decision-making (5 occurrences, 12 TLS); marketing stimuli such as advertising (7 occurrences, 18 total link strength (TLS)); and tools such as EEG (18 occurrences, 43 TLS), ET (14 occurrences, 24 TLS), GSR (5 occurrences, 15 TLS). For example, emotion (15 occurrences, 25 TLS ) means emotion occurrence 15 times and the TLS for this aggregate appearance is 25 links with a neuromarketing theme. Finally, we can notice that neuromarketing is using neuroscience tools such as EEG to study the consumers’ behaviour (e.g., emotion) toward marketing stimuli (e.g., advertising).
Additionally, we were expected that there is a strong correlation between neuromarketing with neuroimaging tools (e.g., EEG, ERP, GSR, ET, and fMRI), the brain processes (e.g., attention, emotion), and marketing stimuli (e.g., advertising, brands). Furthermore, it has been noticed that “EEG” is highly connected with neuromarketing. Table 5 presents a summary of the most frequent keywords with a minimum of 5 occurrences, wherein the highest keyword occurrence is neuromarketing.
Source: Own illustration.
Using the Following URL to Open this Map in VOSviewer URL: https://bit.ly/2X3rpIo
Figure 5 Map of authors’ keywords co-occurrence (with min. 5 occurrence)
Table 5 Top keywords by the minimum 5 occurrences
| Keyword | Occurrences/ Frequency | Total Link Strength |
|---|---|---|
| Neuromarketing | 75 | 100 |
| EEG | 18 | 43 |
| Consumer neuroscience | 15 | 36 |
| Emotion | 15 | 25 |
| ET | 14 | 24 |
| Consumer behaviour | 10 | 26 |
| Marketing | 10 | 26 |
| Neuroscience | 9 | 23 |
| Advertising | 7 | 18 |
| Neuroeconomics | 7 | 17 |
| Attention | 6 | 16 |
| Consumer | 6 | 9 |
| GSR | 5 | 15 |
| Decision making | 5 | 12 |
Citation analysis
We have used citations analysis as an indicator of articles’ impact in neuromarketing. Citation analysis is important to identify the most impactful articles in a particular subject by determining the number of citations to these documents from others (Kumar et al., 2019). We have reviewed and analysed the citations of 119 documents. Table 6 shows the most-cited articles in the neuromarketing domain with more than 15 citations. The largest number of publications was in 2017 with five papers and 88 total citations, while the lower number of publications was in 2019 with a paper and 16 total citations. We also found five articles with more than 20 citations. For example, the most-cited article is “ Aesthetic preference recognition of 3D shapes using EEG”, with 27 citations, which has been written by Chew et al. (2016), published in Cognitive Neurodynamics. Article title “ Consumer neuroscience-based metrics predict recall, liking and viewing rates in online advertising “ is the second-highest citations article (25 citations) at the end of 2020, which was written by Guixeres et al. (2017), published in Frontiers in Psychology. The third most-cited article in the list is “Redefining neuromarketing as an integrated science of influence”, with 22 citations, which was published by Breiter et al. (2015) in the Frontiers in Human Neuroscience. Documents “Frontal brain asymmetry and willingness to pay” and “Established liked versus disliked brands: Brain activity, implicit associations and explicit responses” have 21 and 20 total citations, respectively. Finally, the rest of the documents have less than 20 citations.
Table 6 The top articles on Scopus database by citation score with minimum 15 citations.
| Document Title | TC 2020 | Authors/Year | Journal | Type |
|---|---|---|---|---|
| Aesthetic preference recognition of 3D shapes using EEG | 27 | Chew et al. (2016) | Cognitive Neurodynamics | Article |
| Consumer neuroscience-based metrics predict recall, liking and viewing rates in online advertising | 25 | Guixeres et al. (2017) | Frontiers in Psychology | Article |
| Redefining neuromarketing as an integrated science of influence | 22 | Breiter et al. (2015) | Frontiers in Human Neuroscience | Article |
| Frontal brain asymmetry and willingness to pay | 21 | Ramsoy et al. (2018) | Frontiers in Neuroscience | Article |
| Established liked versus disliked brands: Brain activity, implicit associations and explicit responses | 20 | Bosshard et al. (2016) | Cogent Psychology | Article |
| Welcome to the jungle! The neuromarketing literature through the eyes of a newcomer | 18 | Lee et al. (2018) | European Journal of Marketing | Article |
| EEG Spectral Dynamics of Video Commercials: Impact of the Narrative on the Branding Product Preference | 18 | Wang, R. W. et al. (2016) | Scientific Reports | Article |
| The cognitive processing of an educational app with electroencephalogram and “eye tracking” | 17 | Cuesta-Cambra et al. (2017) | Comunicar | Article |
| Electroencephalographic, heart rate, and galvanic skin response assessment for an advertising perception study: Application to antismoking public service announcements | 16 | Cartocci et al. (2017) | Journal of Visualized Experiments | Article |
| Neuroscience-inspired design: From academic neuromarketing to commercially relevant research | 16 | Spence (2019) | Organizational Research Methods | Article |
| Neural signals of selective attention are modulated by subjective preferences and buying decisions in a virtual shopping task | 15 | Goto et al. (2017) | Biological Psychology | Article |
| Evaluation of emotional responses to television advertising through neuromarketing | 15 | Baraybar-Fernández et al. (2017) | Comunicar | Article |
| Eye tracker technology in elderly people: How integrated television content is paid attention to and processed | 15 | Ananos (2015) | Comunicar | Article |
Co-citation analysis
Co-citation also helps to identify the structure of the literature on a specific topic (Block & Fisch, 2020). In addition, it helps researchers to determine the content and topic domain by evaluating the most-cited reference together. It is an indicator of the appearance of two authors’ names in one document. We have used the VOSviewer software to measure the correlation between a couple of authors by using the link strength between them; wherein the total number refers to the link strength between these both authors (Van Eck & Waltman, 2013). Table 7 shows the number of link strengths between a couple of authors, wherein a higher number means a higher correlation between both authors. Additionally, we also found that the number of link strengths between Lee et al. (2018) and Spence (2019) is 10 links, as the strongest co-citation correlation between a couple of authors. The link strength between Breiter et al. (2015) and Spence (2019) was the second-strongest co-citation between a couple of authors with 9 links. Followed by the link between Ramsoy et al. (2018) and Spence (2019) with 8 links. These findings confirm our discussion in the body of literature in neuromarketing wherein neuromarketing focus on the consumer’s behaviours toward marketing stimuli.
Table 7 The top document pairs with more than two link strength
| Document title | Author 1 | Author 2 | Link Strength between Authors 1, 2 |
|---|---|---|---|
| Welcome to the jungle! The neuromarketing literature through the eyes of a newcomer | Lee et al. (2018) | Spence (2019) | 10 |
| Redefining neuromarketing as an integrated science of influence | Breiter et al. (2015) | Spence (2019) | 9 |
| Frontal brain asymmetry and willingness to pay | Ramsoy et al. (2018) | Spence (2019) | 8 |
| Electroencephalographic, heart rate, and galvanic skin response assessment for an advertising perception study: Application to antismoking public service announcements | Cartocci et al. (2017) | Guixeres et al. (2017) | 5 |
| The cognitive processing of an educational app with electroencephalogram and “eye tracking” | Cuesta-Cambra et al. (2017) | Spence (2019) | 4 |
| Established liked versus disliked brands: Brain activity, implicit associations and explicit responses | Bosshard et al. (2016) | Goto et al. (2017) | 4 |
| Evaluation of emotional responses to television advertising through neuromarketing | Baraybar-Fernández et al. (2017) | Spence (2019) | 3 |
| Consumer neuroscience-based metrics predict recall, liking and viewing rates in online advertising | Guixeres et al. (2017) | Ramsoy et al. (2018) | 3 |
| Neural signals of selective attention are modulated by subjective preferences and buying decisions in a virtual shopping task | Goto et al. (2017) | Spence (2019) | 3 |
| Neuroscience-inspired design: From academic neuromarketing to commercially relevant research | Spence (2019) | Wang, R. W. et al. (2016) | 2 |
Co-citation network
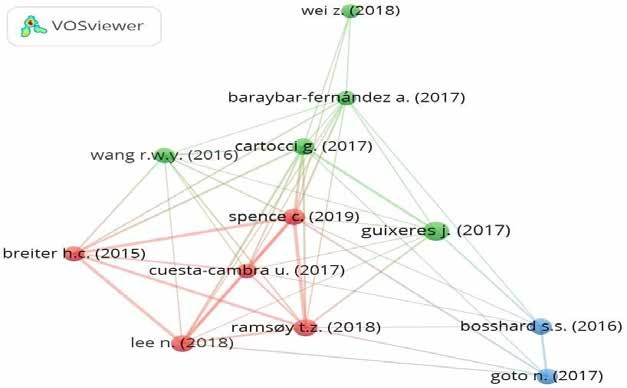
VOSviewer software has been used for the analysis of the co-citation network. It has identified three clusters: thereby, studying, exploring, and understanding the structure and nature of neuromarketing. We found more than 20 times citation occurred in thirteen documents. We followed the instructions recommended by Baker et al. (2020) to visualise the co-citation network map of the top thirteen documents by using VOSviewer software. The findings revealed three clusters with high correlations between them (Figure 6). The red cluster is the largest cluster with the highest citations (132), which is leading by Ramsoy et al. (2018). The green cluster with 127 total citations is the second-highest citation cluster that was dominated by Guixeres et al. (2017). Followed by the blue cluster has 51 citations that were leading by Bosshard et al. (2016). Although these clusters/groups address various aspects of neuromarketing, they are highly interconnected and complementary.
4. Discussion
In the last decade, most studies concentrated on studying consumer behaviour toward marketing stimuli such as but not limited to advertising. Neuromarketing uses neuroscientific tools such as fMRI to record, study, and analyze the unconscious reactions of consumers toward marketing stimuli. We followed the PRISMA framework to extract the relevant documents, which related to neuromarketing or consumer neuroscience. Additionally, we used bibliometric analysis to know the global trends in the neuromarketing field, such as the most productive journal, countries, academic institutions, authors, and the number of documents and citations. The finding revealed that the productive country is Spain, with 21 documents and 114 total citations. Followed by the UK and Malaysia with 15 and 11 documents, respectively. Interestingly, although Italy is in the 6th level in the list, its institute Sapienza Università di Roma has published the most-cited documents with 48 citations. Additionally, the most prolific academic institution is Universidad Complutense de Madrid, with 7 documents (35 citations).
The most productive author is Ma, Q. with 4 documents and 11 total citations; the rest authors have published three documents each. Interestingly, although Teo, J. is in 9th level in the list, he has published the highest-cited documents with 36 citations. Interestingly, Swiss journals dominated the publication in neuromarketing with 29 documents and with 115 total citations. Frontiers in Psycho-logy is the most productive journal with 11 documents and 3.5 CiteScore. Article title “Aesthetic preference recognition of 3D shapes using EEG ” is the most cited article with 27 citations, which published by Chew et al. (2016), followed by “Consumer neuroscience-based metrics predict recall, liking and viewing rates in online advertising” with the second-highest citation (25 citations) that was published by Guixeres et al. (2017). The highest link between the two references was between Lee et al. (2018) and Spence (2019), with 10 links. Therefore, we encourage scholars and researchers to inspect the neuromarketing subject and its techniques from emerging countries.
5. Conclusions
Marketing studies tried to understand consumers’ behaviour by using several methods such as qualitative and quantitative techniques. But at the beginning of the 21st century, marketing research techniques have expanded by the use of new methods/techniques such as EEG to better understand consumers’ behaviour, emotional and cognitive processes toward marketing stimuli. Therefore, key players in neuromarketing have been increasing; additionally, the growth of publications has remarkably increased from six documents in 2015 to more than 115 total documents in 2020. The recent paper provides comprehensive information about global trends of neuromarketing domain such as the leading countries, institutions, authors, and journals-additionally, the number of documents and citations of selected documents for this study.
This study attempted to minimise drawbacks in the methodology, but there are still limitations that provide opportunities for academic studies in the future. For example, this study concentrates on publications that have been published in the English language in the neuromarketing domain, such as technical and reviewed papers and overlooked chapter books, and so forth Because English language is widely used among researchers and exploring as many documents as possible. Therefore, this study is not free of biases. For future works, we encourage scholars from emerging countries to contribute publications in the neuromarketing domain. Researchers and practitioners need to design and use the appropriate tool for their study for sure to get high-accuracy outcomes. We believe that our study will provide a comprehensive overview of global trends in the neuromarketing domain.

