


 Inglés (pdf)
 Articulo en XML
 Referencias del artículo
 Enviar articulo por email
 Citado por SciELO
  Similares en
SciELO
Similares en
SciELO 
 Permalink
1. Introduction
Co-creation is the process of creative interaction that takes place within interactive system environments (facilitated by interactive platforms) and involves agenda commitments and organization structuring (Prahalad and Ramaswarny, 2004). This creation is carried out in the form of a series of interactions between different agents. Organization members both allow for and restrict interactions, while interactive platforms and the agents that use them build heterogeneous relationships with artifacts, processes, interfaces, and people (Ramaswamy and Ozca, 2018).
For Carcelén and Díaz-Soloaga (2022), this definition could be more nuanced by prioritizing the relevance of people before artifacts, processes, and interfaces. From their point of view, co-creation can be defined as an interaction process that establishes an open and permanent dialogue with consumers, one that can make improvements and changes to business activity through interactive exchange dynamics.
Facilitated to a great extent by digital environments, social networks constitute the main platform for co-creation. Consumers interact with one another and with companies (Kennedy and Guzmán, 2016; Tajvidi et al., 2018a; Sarkar and Banerjee, 2019). According to Fernández Gómez and Gordillo-Rodríguez (2020), consumers have an innate need to interact with others, an aspect that ICTs have favored and amplified, and part of this interaction occurs as a consequence of consumption or identification with a brand, so this experience becomes a central element generating “brand communities”.
eWOM (electronic Word of Mouth) on social sharing networks and this has a direct impact on brand perceived value, resulting in the creation of personal connections that should be studied in greater depth. In addition, it is increasingly common for purchasing decisions to be influenced by other consumers’ opinions (Rosario and Read, 2016; Zare et al., 2019).
1.1. Value co-creation
Described by Prahalad and Ramaswamy, 2002 as a collaboration between multiple stakeholders, value co-creation continues to attract the attention of academics and practitioners, though the theoretical fundamentals of the concept are still developed. The first decade of the new century has widely extended digital connectivity to all types of users, and the second has turned them into digital consumers, incorporating social networks as one of the main purchasing channels. For this reason, co-creation has been linked to an active role of consumers in the construction of brands (Essamri et al. 2019).
Vargo and Lush (2008) introduced a new perspective on co-creation based on “service dominant logic” (SDL) where value is a benefit that those involved in the interaction process obtain by providing a service to others while obtaining some service from them as well. Merz et al. (2018:80) highlighted that co-creation always involves many actors that mutually negotiate value determined by the beneficiary through perceived use value. However, there are also a number of constraints to co-creation in each player of the process (the firm, each individual, the technology, the social environment) and this is recognized by Priharsari et al. (2020).
Ranjan and Reed (2016) pointed out three elements for co-creation (1) dialogue (2) participation (3) interaction and identified two main conceptual dimensions present in most applied researchers: co-production and (2) value-in-use (ViU) core conceptual dimensions of value co-creation. Frow et al (2015) recognized the relevance of the two main approaches, adding nine frameworks that they believe scholars use to study and understand the co-creative process. Starting with (1) overall innovation and user involvement in new products and services, (2) co-production, i.e. customer involvement and customer base engagement (previously identified by Ranjan and Reed, 2016), (3) customer participation where the so-called prosumer plays an active role as co-producer of goods and services (4) engagement with the customer base and new customer value (also pointed out by Prahalad and Ramaswamy, 2002), as an evolution of the client from a passive to an active player, in which the transformation of social networks has played a key role. Followed by (5) co-creation relating to value-in-use that involves collaborative “value-in-use” activities and (6) co-creation actors involved, including new stakeholders in the co-creation process. Next would be the (7) value chain efficiency, claiming that co-creation activities can improve value-chain efficiency. Those researchers also uncover other activities such as co-conception, co-design, co-production, co-promotion, co-pricing, co-distributing, co-consumption, co-maintenance, co-disposal, and co-outsourcing. There is also a focus on (8) new economies and service systems that they define as a dynamic process that contributes to the wellbeing of an ecosystem. And finally, there is the understanding of co-creation as a way to (9) design approaches and research questions.
Practitioners have experienced that consumer interacting with brands, not only create content but also build brand identity while expressing their own identity through active support of a brand’s offerings (Black and Veloutsou, 2017). Brands, individuals, and brand communities influence each other’s identities. Precisely, Roberts (2004) -cited in Fernández Gómez (2021:89)- points out that, in the context of the creation of Lovemarks, brands must involve and integrate consumers in the development of their brand personality and brand management process.
In a more updated state of the art on value co-creation Saha et al. (2020:981) found three big topics in which the concept is developing through applied studies: (1) value co-creation in the context of customer service, (2) value co-creation in the context of enhancing brand value and (3) value co- creation for marketing of services through the adoption of SDL.
This research is positioned in the second perspective and focuses on the relevance of brand value perceived by consumers and their attitudes towards co-creation in digital environments.
1.2. Perceived brand value
There are two main meanings of the term brand value: the first is the financial value, which is one of the most important intangible aspects for companies, representing between 30% and 60% of their listed value on the stock market.
Brand equity is the second meaning of brand value and refers to how users perceive and interpret the differences that make a given brand unique (Keller, 1993a; 2020b). For David Aaker (1991), who created the model for this dimension, a brand’s equity can normally be studied by inquiring into what consumers are willing to pay for a certain product for the simple reason that it comes from a particular brand and not another. The so-called “premium price” system helps understand this value; it consists of subtracting what a customer would be willing to pay as a premium for a product from what they would pay for an equal, off-brand product.
Perceived brand value is commonly used as a synonym of brand equity and is more widely used among practitioners and academics.
Without a doubt, perceived value contains a subjective aspect that responds to consumers’ impressions and feelings, which are individual and differ among them. We take as a starting point that brand perceived value corresponds to brands’ attempts to transmit their identity through all of the communication actions they carry out. Thanks to the image that the brand transfers, consumers develop a series of brand associations, which help them understand a brand’s personality. They then decide whether they are interested in engaging with it through face-to-face and/or digital contact points. The possibility of exchanging opinions, suggestions, and evaluations of brands in their own and external spaces opens an exciting interaction channel with consumers that can become an incomparable source of value creation.
At the end of the 1990s, the Young & Rubicam advertising agency implemented the Brand Asset Valuator model (Figure 1), which can be completed with consumer questionnaires, to better understand brands’ perceived value. The model assesses four main pillars: (1) differentiation, understood as that which uniquely characterizes a brand and distinguishes it from the competition,
relevance refers to a brand’s ability to adapt its products to consumers’ needs and aspirations, (3) esteem refers to the meaning that consumers grant to a brand and, finally, (4) knowledge refers to consumers’ depth of knowledge of a specific brand. These four pillars in turn constitute a brand’s vitality and structure.
For its part, the consulting firm Brandz identifies the components of brand equity with its Brand Metrics DNA (Figure 2). In this model, three dimensions make up perceived brand equity: (1) brand associations (awareness, quality, brand loyalty and image, relevance and value proposition, and other measures), (2) business assets (intellectual property, business processes, distribution reach, and other measures) and, finally, (3) market fundamentals (legal and regulatory aspects, political and environmental, pricing, brand benchmarking, and other measures).
In a 2010 study, Ha, Janda and Muthaly analyzed brand equity by evaluating (1) the influence of brand associations, (2) perceived quality, (3) satisfaction and (4) brand loyalty; they proposed four models focused on these four factors. The results show that the model that best fits reality relies on the effects of perceived quality and its indirect impact on a brand’s value through satisfaction.
Perceived value, moreover, appears as an essential element when defining the concept of brand equity (Boksberger and Melsen, 2011); according to these authors, its evaluation depends on taking into account (1) service quality, (2) pricing, (3) the benefits obtained with purchase, (4) the sacrifices consumers make to obtain the product or service, (5) customer satisfaction and, ultimately, (6) customers’ behavioral intentions.
Several studies have pointed out that a higher perceived value improved satisfaction and the benefits consumers expect to obtain (Tiwari, 2010; Flores and Vasquez-Parraga, 2015). Those studies also hold that satisfied consumers are open to being active and co-create content in the digital environment.
1.3. Perceived value and co-creation
The relationship between perceived brand value and co-creation on the part of consumers and other public stakeholders needs to be closely studied since they cease to be passive agents in the process of purchasing products and services and instead take a leading role in building value for brands (Boksberger and Melsen, 2011; Sarkar and Banerjee, 2019; Washburn et al. 2000; Tajvidi, et al, 2021b; Tran et al. 2021). Since co-creation implies behavior, rather than a private perception (Cossío-Silva et al., 2016) on the part of the consumer, more indicators demonstrate that there is a direct relationship between this activity and perceived brand value. On the other hand, Vieira (2013) argues that it is precisely the other way around and that it is perceived value that could have positive effects on eWOM. Fernández Gómez and Gordillo-Rodríguez (2020) point out that brand value is constantly created by the consumer, the company and the culture as the context surrounding the whole process.
Sánchez-Fernández and Iniesta-Bonillo (2007) carried out a meta-analysis of “perceived value,” concluding that this phenomenon contains a relationship between a subject (consumer, user) and an object (product). The value created for the consumer is of a comparative, personal and situational nature (Holbrook, 1994a, 1999b) and involves a cognitive and affective process that must be evaluated through multidimensional scales that ensure the effectiveness of the measurement.
For their part, Boksberger and Melsen (2011) identify the relevance of the “sacrifice” that consumers are willing to make to obtain a product, renouncing other expenses, saving over time, and assessing the benefits that this effort will bring in the future. Perceived value in this instance can be summarized in a formula whose numerator is benefits and denominator is sacrifices.
Tajvidi et al. (2021) established that the mediating function of interactivity in the creation of value for brands, differentiating two relational perspectives: (1) that of consumers in relation to others and (2) that of consumers in relation to retailers. Each capitalizes on a specific piece of interactive activity in the digital environment and, in both cases, the increased value that consumers attribute to brands appears when they interact with them in a bidirectional way through social networks and other digital communication channels.
It is at this point where the relationship between perceived brand value and the co-creation process converges. Our purpose is to identify the impact of perceived value on the different types of consumer co-creators of digital content.
2. Methods
Objectives
The main objective of this study is to describe the different types of co-creation users among the Spanish adult population. It was carried out through the observation of their eWOM behavior and the perceived value of their favorite brands, as well as their main socio-demographic characteristics.
The specific objectives are as follows:
To analyze the attitudes of the Spanish population aged 18 and over toward the brand co- creation process through eWOM,
Identify segments of the population based on previous attitudes, the value perceived in relation to their favorite brands and their basic socio-demographic characteristics (sex, age, monthly income level and educational level),
Determine which of the above groups have favorable, indifferent, or unfavorable attitudes towards the brand co-creation process through eWOM.
Methodology
An analytical cross-sectional descriptive research design has been used. Its study population is the set of Spanish individuals aged 18 and over, taking into account the structure of the population of Spain according to gender and age (INE Base, 2020). The sample size is 1,521 individuals with a guiding error in the assumption of applying a simple random sampling of ± 2.5% for a confidence level of 95.5% (P = Q = 50%).
Based on socio-demographic and economic features, the sample’s profile was obtained: 49.5% were men and 50.5% were women. Regarding the age variable the sample was divided into six age intervals distributed in accordance with the Spanish population census: 12.2% between 18 and 24 years old, 15.2% between 25 and 34, 22.4% between 35 and 44, 20.2% between 45 and
54, 17.3% between 55 and 64%, and 13% over 65 years old.
The distribution of the sample according to income level (“If the average is €1,000 per month, your income level is…”) was as follows: 6,6% well above average, 41% above average, 21,9% average, 9,8% below average, 5,6% far below average and 15,1% prefer not to answer. And by individual educational level: 14,7% Third level (Doctorate or Master’s degree), 21% Bachelor’s degree 2nd Cycle (University, Higher education, Faculties, Higher education technical schools, etc.), 16% Third level 1st Cycle (equivalent to technical engineer, 3 years, technical engineers, architecture, etc.), 37.1% Second level 2nd Cycle (FP, Higher Bachelor, BUP, COU, PREU, 1st and 2nd Baccalaureate), 7.3% Second level 1st Cycle (school graduate or EGB 2nd stage, 1st and 2nd ESO - 1st cycle up to 14 years), 3.1% First level (school certificate, EGB 1st stage, 10 years more or less) and 0.8% No studies (unfinished primary studies),
Information collection was carried out through ad hoc an online questionnaire during November 2020. The data obtained was analyzed with the statistical package SPSS version 25.0 (IBM Corp., 2017) and with the Coheris Analytics SPAD 9.1 program.
The different analysis variables included in the questionnaire are detailed below. The codes used for their identification are indicated in parentheses in Table 1 and in Graph 2, which are presented in the results section:
1. Socio-demographic variables: sex, age, average monthly income level and education level.
2. Individuals’ attitudes towards the brand co-creation process through eWOM (α by Cronbach = 0.873), based on the scales and work developed by Ranjan & Read (2016), Tommasetti et al. (2017) and Loureiro et al. (2017), and grouped into three blocks. In all cases, agreement, or disagreement with each was measured, where DS=Disagree; IN=Indifferent; AC=Agree.
- Attitudes related to the level of individual involvement in the co-creation process through eWOM:
“I am willing to recommend and share my shopping experience with my friends through ratings/reviews” (A1)
“I am willing to recommend a product from a brand that is worth buying to my friends” (A2)
“When a product does not satisfy me, I usually leave a negative review” (V6)
“I don’t usually create content for a brand, but I like to see what other consumers say about their experience with the brand” (V12)
“I have participated in the creation of a new product” (V8)
“I have participated in the creation of specific content for a brand” (V9)
- Attitudes related to the interaction between the company or brand and the user through eWOM:
“I like that the brand’s website pays attention to my comments and responds to me when necessary” (V3)
“I like to interact with my favorite brands and give them my opinion about what they are offering to the market” (V5)
“If brands ask me for an opinion, I am happy to give it to them (I like that they take me into account to improve their offer)” (V7)
“Large companies involve consumers more” (V11)
“Sometimes brands ask consumers for their opinion, but then they don’t take it into account” (V13)
- Attitudes related to the relationship between eWOM and how it impacts on the brand purchasing process:
“When buying a brand, I take into account my friends’ shopping experiences shared on social networks” (V4)
“I have found new brands thanks to other users’ interactions” (V10)
“I make my purchasing decisions taking into account other consumers’ opinions” (V14)
3. Perceived value of respondents’ favorite brands based on agreement or disagreement (where DS=Disagree; IN=Indifferent; AC=Agree) with the following items (α by Cronbach = 0.895) based on the scales of Gurviez & Korchia (2003), Lam & Shankar (2014) and Amegbe & Osakwe (2018):
“I believe that my favorite brands are a better purchase than other similar brands” (VP1)
“My favorite brands are sincere with their customers” (VP2)
“My favorite brands are honest with their customers” (VP3)
“My favorite brands are interested in their customers” (VP4)
“I think my favorite brands always seek to improve how they respond to customer needs” (VP5)
“I tend to defend and praise my favorite brands” (VP6)
“I am satisfied with the relationship I have with my favorite brands” (VP7)
“My relationship with my favorite brands is very close to being ideal” (VP8)
Regarding the research methodology, univariable descriptive techniques were applied, as was the multivariate technique called multiple correspondence analyses (MCA) to co-creation attitudes. In order to identify clusters, a cluster analysis of the factorial coordinates obtained in the MCA was then carried out, followed by a mixed analysis, which resulted in a high number of initial clusters (K-means, Euclidean distance), and hierarchical analysis (Ward’s method, Euclidean distance). A break in the partition hierarchy was made when inter-cluster variability significantly decreased as a new partition was formed. The clusters obtained were described using attitudes towards co- creation, as well as assessments of brand perception with the highest representation with respect to the total set when the hypothesis of a random distribution of respondents to the clusters is rejected (approximation of hypergeometric distribution to the normal distribution). The level of significance was set at p <0.05.
3. Results
3.1. General attitudes towards the co-creation process and perceived brand value
Based on previous work by Carcelén and Diaz-Soloaga (2022), and as shown in Tables 1, 2 and 3, a high percentage of respondents show a favorable attitude towards the co-creation processes when they are linked to eWOM: 66% are willing to recommend a worthwhile brand (A2), and 52% to recommend and share their shopping experience (A1). This percentage decreases slightly when related to leaving a negative review if the product failed to meet their expectations (A6) (41% agree with this statement compared to 24.9% who responded the opposite and 34.2% who were indifferent).
Of note is the fact that a large part of the population accepts recommendations through eWOM when co-creation requires greater individual involvement (A8 and A9) the opposite effect occurs, that is, the percentage of people unwilling to participate in this creative effort increases (only 17.9% of those surveyed state that they have participated in the process of creating a new product for a company and 24.9% in a process of creating specific content for a brand). In addition, almost half of those surveyed declare they prefer to see other consumers’ opinions about a brand and their experiences than to leave their own review (A12).
Regarding the variables related to the eWOM interaction process created between a company and its target public (A3, A5, A7, A11 and A13), it should be noted that almost 60% of respondents like to be considered and to be listened to by brands and they also want companies to respond to them when they need it. Almost 60% are happy to interact with a brand and give their opinion; however, only 28% say they like interacting with a brand and giving their opinion when asked for it (anonymous, 2022).
Finally, as seen in the previous work of anonymous (2022), when analyzing the association between eWOM and the process involved in the decision to purchase from a brand, 40% of those surveyed indicate that they make their purchase decisions based on other consumers’ opinions (A14). This percentage increases to 50% when the opinion is found on friends’ and acquaintances’ social networks (A4). In addition, thanks to other users’ interactions with certain brands, new products reach new consumers (almost 50% of those surveyed came across new brands based on other users’ comments A10).
Table 1 Attitudes towards implication in the co-creation process through eWOM
| Attitudes | Disagree | Indifferent | Agree |
|---|---|---|---|
| A1. I am willing to recommend and share my shopping experience with my friends through ratings/reviews | 16.2% | 31.7% | 52.1% |
| A2. I am willing to recommend a product from a brand that is worth buying to my friends | 10.4% | 23.4% | 66.2% |
| A6. When a product does not satisfy me, I usually leave a negative review | 24.9% | 34.2% | 41.0% |
| A8. I have participated in the creation of a new product | 53.4% | 28.7% | 17.9% |
| A9. I have participated in the creation of specific content for a brand | 43.3% | 319% | 24.9% |
| A12. I don´t usually create content for a brand, but I like to see what other consumers say about their experience with the brand | 19.5% | 34.1% | 46.4% |
Source: Authors
Table 2 Attitudes towards the interaction between the company and the user through eWOM
| Attitudes | Disagree | Indifferent | Agree |
|---|---|---|---|
| A3. I like that the brand´s website pays attention to my comments and responds to me when necessary | 11.6% | 30.3% | 58.1% |
| A5. I like to interact with my favorite brands and give them my opinion about what they are offering to the market | 29.3% | 42.7% | 28.1% |
| A7. If brands ask me for an opinion, I am happy to give it to them | 12.0% | 30.0% | 58.0% |
| A11. Large companies involve consumers more | 22.0% | 45.0% | 33.0% |
| A13. Sometimes brands ask consumers for their opinion, but then they don´t take it into account | 12.8% | 48.8% | 38.5% |
Source: Authors
Table 3 Attitudes towards the relationship between eWOM and how it impacts the purchasing process
| Attitudes | Disagree | Indifferent | Agree |
|---|---|---|---|
| A4. When buying a brand, I take into account my friends´ shopping experiences shared on social networks | 18.8% | 31.0% | 50.2% |
| A10. I have found new brands thanks to other users´ interactions | 20.2% | 31.6% | 48.1% |
| A14. I make my purchasing decisions taking into account other consumers´ opinions | 26.4% | 32.9% | 40.6% |
Source: Authors
Regarding perceived brand value, approximately half of the sample is satisfied with the current relationship they have with their favorite brands (48.1%) and considers them to be a better purchasing option compared to other similar brands (49%). In addition, 37.8% of the respondents think that their favorite brands try to improve and satisfy their needs and 33% tend to defend and praise them. Only a quarter of the sample agrees with the idea that their favorite brands are sincere, honest, and interested in their consumers. As a result, only 20.8% consider their relationship with their favorite brands to be close to ideal.
Table 4 Attitudes towards perceived brand value
| Attitudes | Disagree | Indifferent | Agree |
|---|---|---|---|
| VP1. I believe that my favorite brands are a better purchase than other similar brands | 12.0% | 39.0% | 49.0% |
| VP2. My favorite brands are sincere with their customers | 25.2% | 52.7% | 22.2% |
| VP3. My favorite brands are honest with their customers | 21.8% | 54.3% | 23.9% |
| VP4. My favorite brands are interested in their customers | 24.9% | 49.4% | 25.6% |
| VP5. I think my favorite brands always seek to improve how they respond to customer needs | 16.4% | 45.8% | 37.8% |
| VP6. I tend to defend and praise my favorite brands | 26.0% | 40.9% | 33.1% |
| VP7. I am satisfied with the relationship I have with my favorite brands | 10.4% | 41.5% | 48.1% |
| VP8. My relationship with my favorite brands is very close to being ideal | 27.8% | 51.3% | 20.8% |
Source: Authors
3.2. Typology of consumers regarding co-creation through eWOM and the perceived value of favorite brands.
To classify respondents based on the attitudes they expressed towards co-creation, multivariate statistical techniques with multiple correspondence analysis and cluster analysis were used.
Once the multivariate analysis was completed, three segments were identified that account for 49.6% of total variance (the size of each group can be seen in Table 5).
Table 5 Cluster size
| Cluster | Number of cases | Percentage |
|---|---|---|
| Cluster 1 | 339 | 22,3% |
| Cluster 2 | 343 | 22,6% |
| Cluster 3 | 839 | 55,2% |
| Total | 1521 | 100% |
Source: Authors
Graphs 1 and 2 represent respondents in the first two factorial axes, divided into three clusters, as well as their attitudes towards co-creation and perceived brand value, together with individual socio- demographic and economic features.
Group 1: “The anti-cocreators”
As the smallest group, the anti-cocreators include 22.3% of the total sample analyzed (339 individuals). This segment has a higher proportion of individuals with the most unfavorable attitude towards the co-creation process in general. They indicate that they disagree with this process the most and display a negative predisposition towards participation in co-creation processes with brands (from the most basic level through recommendations to the most complex through collaboration in the creation of specific content). They also negatively view interaction with companies through dialogue and state that e-WOM has a negligible influence on their purchasing process (see Table 6). This segment brings together between 70% and 85% of the total respondents who state that they disagree most with the aforementioned attitudes.
In addition, this group also indicates that they most disagree with attitudes related to perceived brand value, stating that they do not consider their favorite brands to be the most sincere, honest, or the best purchasing option so their satisfaction level is not ideal.
Regarding this segment’s socio-demographic profile, respondents were more likely to be male (58% vs 49% female) and to be older than 65 (20% vs 13%).
Cluster 2: “Indifferent/passive towards co-creation”
This group is made up of 22.6% of the total sample and constitutes the second most numerous cluster in terms of size (343 individuals). This group has an indifferent attitude towards the co- creation process itself (bringing together between 50 and 60% of individuals). Furthermore, it is a passive segment, that is, they are aware of how to interact with brands, but are not interested, preferring to stay more on the sidelines and let other consumers participate. This segment also mostly manifests indifference towards perceived brand value, and they do not definitively speak to whether their preferred brands live up to the characteristics of honesty, sincerity, and responsiveness to their needs.
Regarding the socio-demographic profile of the respondents, this segment is mostly made up of young people, that is, between 18 and 24 years old (16.6% vs 12.2%) and has a low or basic educational level (10% vs 7%).
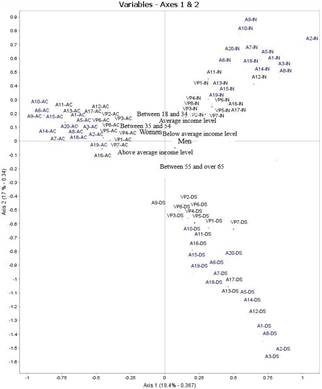
Source: Authors
AC: Agree, IN: Indifferent, DS: Disagree
Graph 1 Representation of co-creation attitudes (“A”), perceived brand value (“PBV”) and respondents’ socio-demographic features on the first two factorial MCA axes
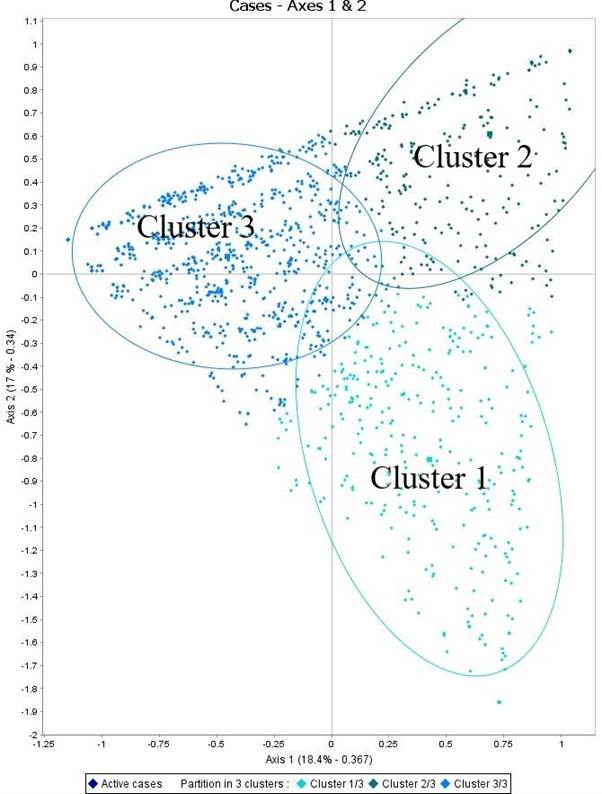
Cluster 3: “Active co-creators”
This group makes up 55.2% of the total sample and is the largest in terms of size (839 individuals). It represents those who are most in agreement with the co-creation process. In addition, it brings together between 75% and 95% of the individuals who show a very favorable disposition towards co-creation in terms of participation, interaction, and influence on the purchase process.
The individuals therein participate most actively in brands’ recommendation processes, contributing with their own experience (positive or negative) for other consumers. They also promote and positively evaluate dialogue generated with brands online. In addition, they agree that e-WOM influences them when making purchasing decisions. This group is especially sensitive to the co- creation process since they co-create the most, participating in the creation of content for brands’ marketing and communication campaigns.
Regarding perceived brand value, this segment brings together between 70 and 75% of people who indicate that they agree most with the idea that their favorite brands are sincere, respond to their needs, are the best purchase option and their level of satisfaction with them is high.
Finally, individuals in this segment are more likely to be female (53% vs. 50%), with a high-income profile (44% vs. 41%), a high level of education (15% vs. 12%) and an average age between 35 and 44 (25% vs. 22%).
Table 6 Characterization of the clusters obtained in terms of attitudes towards brand co-creation through eWOM.
| Attitudes | CLUSTER 1 n:339; 22,3% | CLUSTER 2 n: 343; 22,6% | CLUSTER 3 n: 839; 55,2% | Total n:1521; 100% | |
|---|---|---|---|---|---|
| Attitude1 | Agree | Ns | Ns | 81%* | 52% |
| Indifferent | Ns | 80%* | Ns | 31% | |
| Disagree | 60%* | Ns | Ns | 16% | |
| Attitude2 | Agree | Ns | Ns | 92%* | 66% |
| Indifferent | Ns | 70%* | Ns | 23% | |
| Disagree | 39%* | Ns | Ns | 10% | |
| Attitude3 | Agree | Ns | Ns | 86%* | 58% |
| Indifferent | Ns | 77%* | Ns | 30% | |
| Disagree | 44%* | Ns | Ns | 11% | |
| Attitude4 | Agree | Ns | Ns | 75%* | 50% |
| Indifferent | Ns | 78%* | Ns | 31% | |
| Disagree | 58%* | Ns | Ns | 18% | |
| Attitude5 | Agree | Ns | Ns | 46%* | 28% |
| Indifferent | Ns | 83%* | Ns | 42% | |
| Disagree | 75%* | Ns | Ns | 29% | |
| Attitude6 | Agree | Ns | Ns | 62%* | 41% |
| Indifferent | Ns | 78%* | Ns | 34% | |
| Disagree | 67%* | Ns | Ns | 24% | |
| Attitude7 | Agree | Ns | Ns | 85%* | 57% |
| Indifferent | Ns | 74%* | Ns | 30% | |
| Disagree | 40%* | Ns | Ns | 11% | |
| Attitude8 | Agree | Ns | Ns | 28%* | 17% |
| Indifferent | Ns | 74%* | Ns | 28% | |
| Disagree | 86%* | Ns | Ns | 53% | |
| Attitude9 | Agree | Ns | Ns | 41%* | 24% |
| Indifferent | Ns | 77%* | Ns | 31% | |
| Disagree | 87%* | Ns | Ns | 43% | |
| Attitude10 | Agree | Ns | Ns | 75%* | 48% |
| Indifferent | Ns | 77%* | Ns | 31% | |
| Disagree | 65%* | Ns | Ns | 20% | |
| Attitude11 | Agree | Ns | Ns | 49%* | 33% |
| Indifferent | Ns | 78%* | Ns | 45% | |
| Disagree | 47%* | Ns | Ns | 22% | |
| Attitude12 | Agree | Ns | Ns | 66%* | 46% |
| Indifferent | Ns | 70%* | Ns | 34% | |
| Disagree | 50%* | Ns | Ns | 19% | |
| Attitude13 | Agree | Ns | Ns | 52%* | 38% |
| Indifferent | Ns | 83%* | Ns | 48% | |
| Disagree | 29%* | Ns | Ns | 12% | |
| Attitude14 | Agree | Ns | Ns | 62%* | 40% |
| Indifferent | Ns | 73%* | Ns | 32% | |
| Disagree | 64%* | Ns | Ns | 26% | |
Source: Authors
Percentages of highest representation by cluster and of the total in each category (agree, indifferent, disagree) Ns: not significant. * p<0.001
Table 7 Characterization of the clusters obtained on the basis of the perceived value of favorite brands
| Values of brands | CLUSTER 1 n:339; 22,3% | CLUSTER 2 n: 343; 22,6% | CLUSTER 3 n: 839; 55,2% | Total n:1521; 100% | |
|---|---|---|---|---|---|
| Perceived value1 | Agree | Ns | Ns | 62%* | 49% |
| Indifferent | Ns | 64%* | Ns | 39% | |
| Disagree | 24%* | Ns | Ns | 11% | |
| Perceived value2 | Agree | Ns | Ns | 30%* | 22% |
| Indifferent | Ns | 70%* | Ns | 52% | |
| Disagree | 42%* | Ns | Ns | 25% | |
| Perceived value3 | Agree | Ns | Ns | Ns | 25% |
| Indifferent | Ns | 71%* | Ns | 54% | |
| Disagree | 40%* | Ns | Ns | 21% | |
| Perceived value4 | Agree | Ns | Ns | 34%* | 25% |
| Indifferent | Ns | 69%* | Ns | 49% | |
| Disagree | 45%* | ns | Ns | 24% | |
| Perceived value5 | Agree | Ns | Ns | 50%* | 37% |
| Indifferent | Ns | 70%* | Ns | 45% | |
| Disagree | 31%* | ns | Ns | 16% | |
| Perceived value6 | Agree | Ns | ns | 45%* | 33% |
| Indifferent | Ns | 63%* | Ns | 40% | |
| Disagree | 46%* | ns | ns | 26% | |
| Perceived value7 | Agree | Ns | ns | 62%* | 48% |
| Indifferent | Ns | 64% | ns | 41% | |
| Disagree | 23%* | ns | ns | 10% | |
| Perceived value8 | Agree | Ns | ns | ns | 22% |
| Indifferent | Ns | 70%* | ns | 51% | |
| Disagree | 48%* | ns | ns | 27% | |
Source: Authors
Percentages of highest representation by cluster and of the total in each category (agree, indifferent, disagree) Ns: not significant. * p<0.001
4. Discussion
The first conclusion that emerges from this study is that behavior related to the co-creation process is widely extended and accepted among users. This study furthermore demonstrates that the very process of co-creation improves users’ perceptions of brands when they regularly engage in it. This in turn leads us to highlight the relevance of co-creation for the construction of Brand Equity, that is, the subjective value that consumers attach to brands. This first conclusion reinforces studies like that of Tajvidi, et al. (2021b), which are relevant for the professional fields of marketing and communication but have not yet been fully cemented in the literature.
At the same time, upon analyzing the results, we differentiated three types of behaviors and attitudes towards the co-creation process that consumers develop as well as the attribution of perceived value to brands with which they interact. The “active co-creators” cluster, which represents most of the sample, highlights consumers’ interest in active participation. It could be said that many users have an explicit desire to interact and get involved in creation processes that, in addition to generating value for the brands that launch them, positively influence customers’ experience and intention to purchase. On the other hand, the study identified other consumer segments, those who identify as “anti-co-creators” and those who are “indifferent” towards this process, these users are not attracted by this marketing and communication strategy so their participation and interaction levels are very low, as is their possible influence it may have when making a purchasing decision.
From this perspective, identifying the profiles of the most active users and those inclined to interact through the co-creation of content (by posting text, photos or videos in which brands are mentioned or through an open dialogue with brands or brand users) should become a primary task of those responsible for marketing, since involving consumers in this process also increases brand value.
The present study, far from producing a firm and immovable marketing principle, begins rather with the intuition shared among those who work in this sector, namely that the more dynamic a user’s behavior is in relation to brands, the better perception they have of them. In other words, brands build strength and credibility when they generate conversation and co-create content with users.
With users who are indifferent or openly opposed to co-creation what is required is a respectful and patient attitude, since such a disposition does not exclude them from perceiving enhanced value outside of interaction with users and brands themselves.
For this reason, we recommend that brands establish collaborative ties with those users who are most willing to establish such a relationship. They should take advantage of the interest they already have by starting a conversation, either with other users or directly with the brand. The result of this dialogue, in addition to bringing new and different content, will result in increased perceived value for the brand.
It must be considered that this study is focused on digital co-creation. In this environment young audiences tend to be more active which can condition the results obtained. In addition, brand co-creation can also take place in the offline environment, something that has not been observed in this study.
A future research line derived from this study would be to investigate the obstacles and motivations of individuals identified as “anti-co-creators” and “indifferent”, to promote a more proactive behavior towards co-creation process with brands. Another trail to follow would be focus on the “active co- creators” to determine which specific business channels and strategies in the digital environment could maximize their co-creation attitude and behavior with brands.

