


Servicios Personalizados
Revista

Articulo
 Inglés (pdf)
 Articulo en XML
 Referencias del artículo
 Enviar articulo por email
Indicadores
-
 Citado por SciELO
Links relacionados
-
 Similares en
SciELO
Similares en
SciELO  uBio
uBio
Compartir

 Permalink
Ecología Aplicada
versión impresa ISSN 1726-2216
Ecol. apl. v.10 n.2 Lima ago./dic. 2011
ARTÍCULOS ORIGINALES
Relationships between nutrient enrichment and the phytoplankton community at an andean oligotrophic lake: a multivariate assessment
Relaciones entre el enriquecimiento de nutrientes y la comunidad de fitoplancton en un lago oligotrófico andino: una mirada multivariante
Francisco E. Fontúrbel1 and Gabriel J. Castaño-Villa2
1 Departamento de Ciencias Ecológicas, Facultad de Ciencias, Universidad de Chile, Las Palmeras 3425 Ñuñoa 7800024, Santiago, Chile.
Email: fonturbel@gmail.com. Corresponding author, phone 2-9787438, fax 2-2727363.2 Tropical Ecosystems Research Group, Universidad de Caldas, Manizales, Colombia.
Abstract
Phytoplankton is one of the groups most sensitive to eutrophic conditions, and its disturbance has a potential negative bottom-up effect on lentic ecosystems. In this research we used a multivariate statistics approach (Canonical Correspondence Analysis with a Monte Carlo permutational test) to assess the relationships between nutrient enrichment and the phytoplankton community diversity. Four locations with different levels of eutrophication were sampled at the Bolivian sector of Lake Titikaka. Phytoplankton richness ranged from eight to 16 genera, varying significantly among sites, and its diversity was significantly correlated to nitrogen, phosphorus, and pH (Monte Carlo test, p < 0.05). Phosphorus was determined to be the limiting nutrient in the ecosystem. Community structure assessment showed a non-aggregated distribution of genera among study sites, with few abundant genera, and a BDG analysis pointed to a log-series distribution, suggesting a non–fully random niche partition. The methodological approach used here allowed a rapid assessment of the nutrient enrichment effect considering phytoplankton and nutrients as a whole, which is a more powerful approach than studying single-nutrient or single group relationships with univariate procedures.
Key words: Diversity, eutrophication, Titikaka Lake, water pollution.
Resumen
El fitoplancton es uno de los componentes más sensibles a las condiciones eutróficas, y su perturbación puede tener potenciales efectos negativos de tipo bottom-up en los ecosistemas lénticos. En este trabajo se empleó una aproximación estadística multivariante (Análisis de Correspondencia Canónica, con una prueba por permutaciones de Monte Carlo) para examinar las relaciones entre el enriquecimiento de nutrientes y la diversidad de la comunidad de fitoplancton. Se muestrearon cuatro localidades con distinto grado de eutrofización en el sector boliviano del lago Titikaka. La diversidad de fitoplancton encontrada varió entre ocho y 16 géneros, cambiando significativamente entre los sitios de muestreo, estando la diversidad del fitoplancton significativamente correlacionada con el nitrógeno, el fósforo y el pH (prueba de Monte Carlo, p < 0,05). El fósforo fue identificado como el nutriente limitante en el ecosistema. La evaluación de la estructura de la comunidad mostró una distribución no agregada, y el análisis BDG resultó en una distribución de serie logarítmica, sugiriendo la partición no aleatoria del nicho. La aproximación metodológica empleada aquí permitió una evaluación rápida del efecto del enriquecimiento de nutrientes, considerando al fitoplancton y los nutrientes como un todo, siendo esta aproximación más poderosa que estudiar relaciones individuales mediante técnicas univariadas.
Palabras clave: Contaminación hídrica, diversidad, eutrofización, lago Titikaka.
Introduction.
Freshwater ecosystems eutrophication due to water pollution is a worldwide problem, related to the increasing human population and its wastes (Dolbeth et al., 2003; Kim et al., 2001). Human-related disturbances to natural ecosystems are linked to several productive activities and how they are carried out, progressively reducing water quality of lakes, lagoons, and estuaries (Bertness et al., 2002; Tilman, 1999). Human wastes reach freshwater bodies, increasing the organic nutrient loads, and creating a nutrient surplus in the ecosystem that will cause an eutrophic process (Hessen et al., 2006) when the disturbance intensity exceeds the resilience capacity (Carpenter & Cottingham, 1997).
Eutrophication usually involves an alpha diversity reduction (Agatz et al., 1999; Western, 2001), where few tolerant species are benefited by the nutrient enrichment. Whereas, many others are negatively affected, reducing theirs abundance or disappearing. Phytoplankton is one of the most sensitive components of oligotrophic lakes (Hessen et al., 2006; Muylaert et al., 2002; Weithoff et al., 2000). It represents the primary production level, and it has the potential to bloom could causing a subsequent bacterioplankton bloom and resulting in turbidity and anoxic conditions (Dominik & Höfle, 2002; Höfle et al., 1999; Howarth et al., 2000). Such situation might killing most limnophytes, fishes, amphibians, and aquatic insects (Weisner et al., 1997).
Titikaka Lake is an oligotrophic tectonic relict from larger ancient lakes. It is located at a mean altitude of 3810 m, with an extension of 8562 km2, corresponding to ca. 903 km3 of water (Fontúrbel, 2008; Smith et al., 2005). This lake provides habitat for many fish and amphibian endemic species, on which about 30 towns in Bolivia and Peru depend as sustenance. Despite its worldwide importance as a Ramsar wetland, about a decade and a half ago human disturbance at the Titikakas shores has considerably increased due to the rapid population growth, as well as cattle raising, agriculture fields, fish farms, and massive tourism activities. Such activities caused the appearance of localized (isolated) eutrophic processes at low depth places, which have swiftly expanded (Fontúrbel, 2008).
Having a proper understanding of how the phytoplankton community changes in eutrophic conditions (i.e., nutrient enrichment) is a fundamental matter to manage eutrophic water bodies, as well as preventing harmful algal blooms and bottom-up negative effects. For this reason, the scope of this study was to determine (1) the relationship between the phytoplankton community diversity related to nutrient enrichment, and (2) how the phytoplankton communities are structured on sites with different eutrophication levels.
Materials and methods.
Study area.
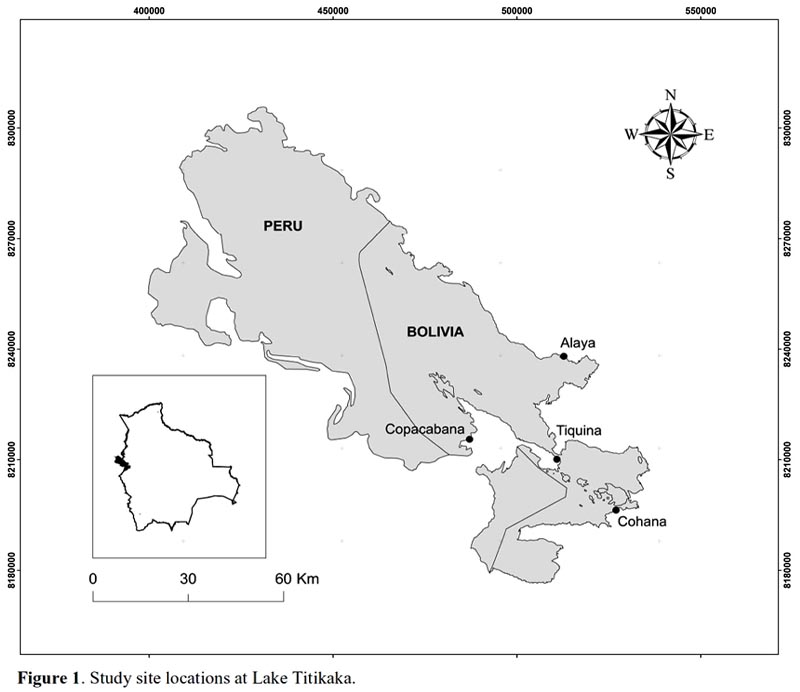
Fieldwork was conducted at the Bolivian sector of the Titikaka Lake (Fig. 1). Four study sites were non– randomly selected according two criteria: (1) the presence of localized eutrophication phenomena, and (2) a specific productive activity directly linked to nutrient enrichment. The sites selected were (1) Cohana Bay (16º2215"S, 68º3936"W), highly impacted by intensive cattle raising; (2) Copacabana Bay (16º0950"S, 69º0529W), impacted by sewage from touristic facilities; (3) Tiquina (16º1322"S, 68º5004"W), impacted by trout aquaculture; and (4) Alaya (15º5613"S, 68º4853W), impacted by cereal agriculture. According to a previous study (Fontúrbel, 2005), the sites are ordered Cohana > Alaya > Tiquina > Copabana, ranging from the most to the less polluted site.
Sampling.
Fieldwork was conducted between 2003 and 2004, during the summer season. At each study site, we made three replicates of each sample. Phytoplankton samples were collected and fixed in situ with an iodine solution, and concentrated in laboratory through a 25µ mesh, reducing each liter of raw sample to 10ml of concentrated sample. Concentrated samples were preserved in 90% ethanol, and identified up to genera level using an inverted microscope and a phytoplankton illustrated guide (Cadima et al., 2006). Samples for physicochemical analyses were taken using 1L hermetic Kautex flasks, which were kept at 4ºC until delivered to the lab. Water pH was determined by method EPA 150.1, total nitrogen by EPA 351.1, and soluble phosphorus by EPA 365.2. We determined N:P ratios by a molar N/P relation. Physicochemical analyses were conducted at the Laboratorio de Calidad ambiental, and the phytoplankton determination was conducted at the Unidad de Limnología laboratory, both at the Universidad Mayor de San Andrés.
Data analysis.
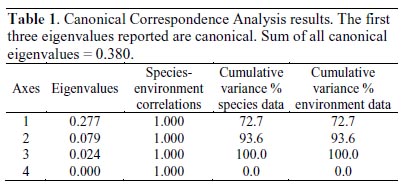
Differences in genera abundance among study sites were assessed through the Kendalls concordance coefficient (W), which is the normalization of the Friedman ANOVA statistics, calculated for multiple dependent samples (blocking diversity data by sampling site). Kendalls W values of 0 represents no agreements, whereas W = 1 represents full agreement. The relationship among the environmental variables and phytoplankton diversity was examined using a Canonical Correspondence Analysis (CCA), performed using CANOCO 4.53 (ter Braak & Simlauer, 2004). Environmental variables for CCA were total nitrogen, soluble phosphorus, and pH; diversity dataset was restricted to Nostocaceae, Oscillatoriaceae, Diatomaceae, Naviculaceae, Closteriaceae, and Zygnemataceae families. Environmental data on CCA was used for a direct gradient analysis. A symmetric Hills scaling method was used, with rare species downweighting. For testing the differences of the observed community composition from random, we used Monte Carlo permutation tests under the full model (i.e., including all variables) with 9,999 unrestricted permutations in order to determine the significance of the correlation observed.
For studying the phytoplankton community structure, abundance data was analyzed using two tests: (1) A whole community distribution test that uses a Chi-squared test to measure patchiness in the whole community, which can be randomly distributed respect to each other, aggregated together, or aggregated in different samples (Lambshead & Hodda, 1994) was performed to determine if the phytoplankton community is structured as a whole or in patches. (2) A BDG analysis (Hayek & Buzas, 2006) was performed to assess the dominance and diversity relationships. The BDG analysis is an extension of the traditional SHE analysis that examines the relationship between the species richness, the diversity, and the evenness in the sampled community, in order to determine if the community data resembles to a log-normal, a logseries, or a MacArthurs broken stick distributions (Hayek & Buzas, 1997). Both analyses were conducted using BioDiversity Professional v. 2 (McAleece et al., 1997).
Results.
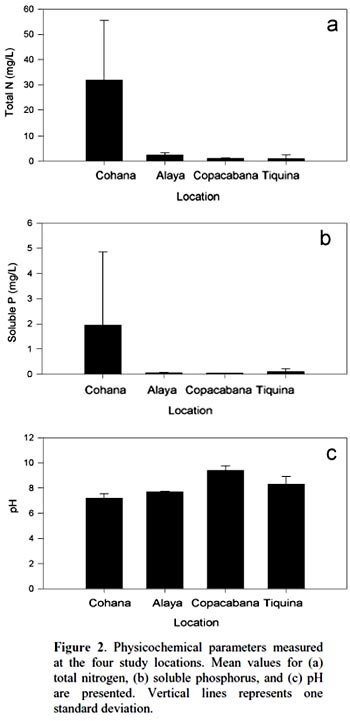
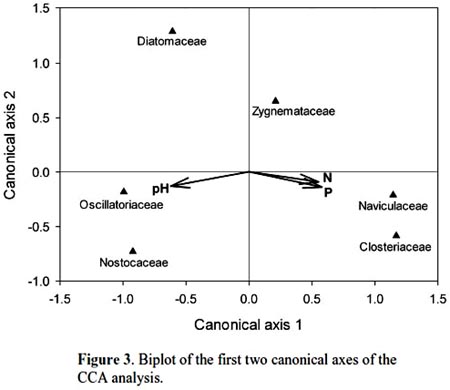
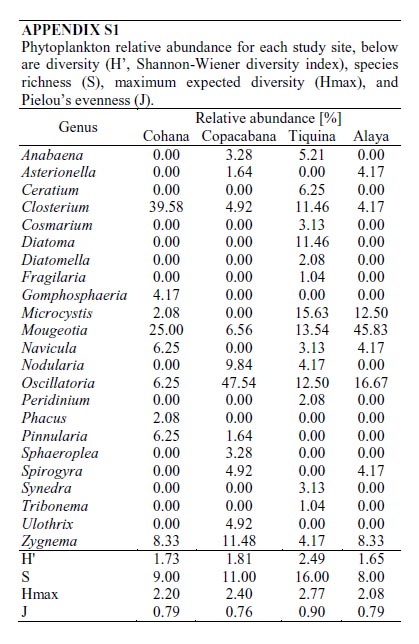
Cohana Bay showed the highest nitrogen and phosphorus contents, whereas Tiquina and Copacabana showed the lowest concentrations; Alaya and Cohana Bay showed acid pH values compared to Copacabana and Tiquina (Fig. 2). N:P ratios ranged from 130:1 in Copacabana Bay, 124:1 in Cohana Bay, 110:1 in Tiquina, to 79:1 in Alaya, showing clearly that phosphorus is the limiting nutrient in all cases. Phytoplankton diversity varied considerable along the study sites (Appendix S1), being lower at the most nutrient-enriched sites. Genera richness ranged from eight to 16, being lower at the most eutrophicated sites (i.e., Cohana Bay and Alaya). Genera abundances showed a significant variation among sites (Kendalls concordance coefficient W = 0.19; calculated from Friedman ANOVA χ2 = 13.09, df = 3, p = 0.004;). Additionally, phytoplankton diversity among sites showed a significant correlation with environmental variables (total nitrogen, soluble phosphorus, and pH) included in the CCA model (Monte Carlo test, F-ratio = 4.52, p = 0.045; Fig. 3 and Table 1). The first canonical axis explained 72.3% of the total variance, and it was highly correlated with the environmental variables (Nitrogen r = 0.87, Phosphorus r = 0.88, pH r = -0.97).
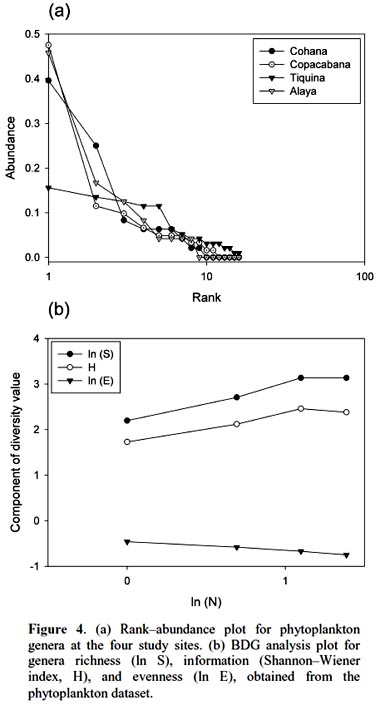
Rank abundance plot showed a clumped distribution (Fig. 4a), with few abundant genera at Copacabana and Alaya, followed by Cohana Bay, and a more even distribution at Tiquina. Species distribution test, at whole community level, gave a non-aggregated genera distribution (χ2 = 3.68, df = 92, p = 0.99). It showed a relatively even structure at the phytoplankton community composition among study sites. Phytoplankton community fitted better to a log– series distribution, according to the BDG analysis (Fig. 4b), which suggests a non-fully random niche partition.
Discussion.
Previous studies have found individual correlations between major algal groups and individual nutrients (e.g., Hessen et al., 2006). However, when looking at the problem from a multivariate perspective, we have found a significant correlation between phytoplankton diversity and nutrient enrichment. Traditional univariate methods may overlook the whole community response because testing single-nutrient effects over single abundant well-known taxa (e.g., diatoms) may leave unrevealed the real effects of nutrient interactions over phytoplankton diversity. Moreover, using a multivariate approach will allow the detection of the occurrence of multifactor relationships, which could be masked in univariate methods, as we found here for N, P, and pH, variables that were highly correlated to phytoplankton diversity. In undisturbed oligotrophic Andean lakes, no significant environmental effects were detected over phytoplankton diversity (Márquez-García et al., 2009), contrarily to our findings on disturbed sites. Our results showed that phytoplankton had responded significantly to nutrient enrichment, as has been detected in a long-term study in Europe (Salmaso, 2010). The strong negative correlations between N, P, and pH and phytoplankton diversity (refer to Figure 1 for environmental variables variation among sites, and to Appendix S1 for diversity and richness values) confirmed this situation: nutrient enrichment and water acidification reduce phytoplankton diversity. Oscillatoriacea, and Nostocaceae responded positively to pH increasing (i.e., alkalization) and negatively to nutrient enrichment. Whereas, Naviculaceae, Closteriaceae, and in less degree Zygnemataceae showed the inverse trend, proliferating in acid and nutrient-enriched waters. Diatoms appeared to respond negatively both to water acidification and nutrient enrichment, being the most sensitive group to water eutrophication (see Fig. 3).
Nutrient enrichment at the Titikaka Lake had significant effects on phytoplankton richness, which became impoverished as the content of nitrogen and phosphorus increased, as it is evident examining the evidence presented here for Cohana Bay, the most polluted town in the Bolivian jurisdiction of the Titikaka lake. This situation could result in an uneven niche partition, as was shown in our data through the BDG analysis. Few genera has dominated the community to the detriment of the remaining ones, coinciding with Salmaso (2010) findings, resulting in a lower evenness. As has been reported before, phosphorus was the limiting nutrient in the eutrophic ecosystem (Triana & Laperche, 1999) with N:P ratios up to 130:1. Consequently this situation may get worse if residual water discharges (with conspicuous concentrations of phosphate detergents) increase, potentially causing algal blooms. Algal blooms depend on particularities of each study site. Since Lake Titikaka is not a homogeneous environment, having site-specific characteristics related to their economic activities that influence the magnitude of nutrient enrichment (e.g., touristic lodges will contribute more phosphorus than nitrogen, contrary to what happens with cattle rising). Contrary to our findings, Dorador et al. (2003) have reported nitrogen as the limiting nutrient on undisturbed lakes, at the Chilean Altiplano.
Phytoplankton turnover has a bottom-up effect on many other species of the higher trophic levels (Weisner et al., 1997). On one hand, the initial increase in primary producers also causes an increase on herbivore zooplankton (Hemmi & Jormalainen, 2002), causing a greater prey availability for zooplanktivore species and so on. Cyanobacteria increase also may cause a harmful algal bloom that may be risky for the local population because of the production of cyanotoxins (Silva, 1999). On the other hand, the rise of primary production initially causes an increase in dissolved oxygen concentrations due to greater photosynthesis rates. Abundant organic matter and oxygen availability causes a subsequent bacterioplankton bloom (Dominik & Höfle, 2002) that consumes important amounts of oxygen, causing anoxic conditions. Additionally, phytoplankton proliferation also may increase water turbidity and its characteristic green color (due to the chlorophyll content). Such phenomenon could have deleterious consequences on fish, amphibians, aquatic insects, and particularly on limnophytes (i.e., submerged macrophytes) because of the reduction of the euphotic zone (e.g., Kim et al., 2001; Worm & Lotze, 2006). Since limnophytes are considered keystone species on oligotrophic lakes, their loss or replacement with opportunistic species may cause the unbalance of biogeochemical cycles (Barrón et al., 2003), affecting other species that rely on them for food, nesting sites, or reproductive substratum.
Anoxic condition and limnophyte reduction may alter the "healthy" functioning of the ecosystem (De Leo & Levin, 1997), due to diversity reduction and the loss of some ecosystem functions (Hector et al., 2001; Schwartz et al., 2000). Eutrophic processes, and mainly alterations to the phytoplankton community, may cause an ecosystem general stress syndrome (Western, 2001) over the mid– and long–term. So, nutrient enrichment is an important conservation threat for wetlands, which is rarely considered in the management and restoration plans. Titikaka Lake is not the exception: eutrophication is a rapidly growing problem. If no actions (such as installing treatment plants, phytopurification systems based on native species, and controlling the pollution sources) will be taken to control eutrophication, isolated eutrophic spots might expand to the entire lake, representing a major conservation problem. Studying the phytoplankton community as a whole, and relating its diversity with environmental variables (especially the main nutrients) could be an inexpensive assessment method, which could be easily applied in countries with limited resources since computers powerful enough to perform those analyses are now easily available.
Acknowledgments.
C.I. Molina, C. Ibañez, and C. Rosales helped with phytoplankton identification. Staff at Laboratorio de Calidad Ambiental (Universidad Mayor de San Andrés) performed the physicochemical analyses.
Comments of R. Ramos, J.P. Oyanedel, and two anonymous reviewers improved an early version. FEF and GJCV were supported by a doctoral fellowship of the Chilean Comisión Nacional de Investigación Científica y Tecnológica (CONICYT).
Literature cited.
Agatz M., Asmus R.M. & Deventer B. 1999. Structural changes in the benthic diatom community along a eutrophication gradient on a tidal flat. Helgoland Marine Research. 53: 92-101.
Barrón C., Marbà N., Duarte C.M., Pedersen M.F., Lindblat C., Kersting K., Moy F. & Bokn T. 2003. High organic carbon export precludes eutrophication responses in experimental rocky shore communities. Ecosystems. 6: 144-153.
Bertness M., Ewanchuck P. & Silliman B.R. 2002. Anthropogenic modification of New England salt marsh landscapes. Proceedings of the National Academy of Sciences. 99: 1395-1398.
Cadima F.M., Fernández T.E. & López Z.L. 2006. Algas de Bolivia con énfasis en el fitoplancton: Importancia, ecología, aplicaciones y distribución de géneros. Centro de Ecología Difusión Simón I. Patiño, Santa Cruz.
Carpenter S. & Cottingham K. 1997. Resilience and Restoration of Lakes. Conservation Ecology. 1: [online, art. 2].
De Leo G. & Levin S. 1997. The multifaceted aspects of ecosystem integrity. Conservation ecology. 1: [online, art. 3].
Dolbeth M., Pardal M.A., Lilleblo A.I., Azeiteiro U. & Marques J.C. 2003. Short-and long-term effects of eutrophication on the secondary production of an intertidal macrobenthic community. Marine Biology. 143: 1229-1238.
Dominik K. & Höfle M. 2002. Changes in bacterioplankton community structure and activity with depth in a eutrophic lake as revealed by 5S rRNA analysis. Applied and Environmental Microbiology. 68: 36063613.
Dorador C., Pardo R. & Vila I. 2003. Variaciones temporales de parámetros físicos, químicos y biológicos de un lago de altura: el caso del lago Chungará. Revista Chilena de Historia Natural. 76: 15-22.
Fontúrbel F.E. 2005. Indicadores fisicoquímicos y biológicos del proceso de eutrofización del lago Ttikaka (Bolivia). Ecología Aplicada. 4: 135-141.
---------- 2008. Contaminación ambiental y cultural en el lago Titikaka: Estado actual y perspectivas. Fundación emegece -Publicaciones Integrales, La Paz.
Hayek L.A.C. & Buzas M.A. 1997. Surveying Natural Populations. Columbia University Press, New York.
---------- 2006. The Martydom of St. Lucie: Decimation of a meiofauna. Bulletin of Marine Science. 79: 341-352.
Hector A., Joshi J., Lawler S.P., Spehn E.M. & Wilby A. 2001. Conservation implications of the link between biodiversity and ecosystem functioning. Oecologia. 129: 624-628.
Hemmi A. & Jormalainen V. 2002. Nutrient enhancement increases performance of a marine herbivore via quality of its food alga. Ecology. 83: 1052-1064.
Hessen D.O., Faafeng B.A., Brettum P. & Andersen T. 2006. Nutrient enrichment and planktonic biomass ratios in lakes. Ecosystems. 9: 516-527.
Höfle M., Haas H. & Dominik K. 1999. Seasonal dynamics of bacterioplankton community structure in a eutrophic lake as determined by 5S rRNA analysis. Applied and Environmental Microbiology. 65: 3164-3174.
Howarth R., Swaney D.P., Butler T.J. & Marino R. 2000. Climatic control on eutrophication of the Hudson River Estuary. Ecosystems. 3: 210-215.
Kim B., Park J.H., Hwang G., Jun M.S. & Choi K. 2001. Eutrophication in reservoirs of South Korea. Limnology. 2: 223-229.
Lambshead P.J.D. & Hodda M. 1994. The impact of disturbance on measurements of variability in marine nematode populations. Vie et Milieu. 44: 21-27.
Márquez-García M., Vila I., Hinojosa L.F., Méndez M.A., Carvajal J.L. & Sabando M.C. 2009. Distribution and seasonal fluctuations in the aquatic biodiversity of the southern Altiplano. Limnologica. 39: 314-318.
McAleece N., Lambshead P.J.D., Paterson G.L.J. & Gage J.D. 1997. Biodiversity Pro: Free Statistics Software for Ecology. National Biological Information Infrastructure Metadata http://www.sams.ac.uk/research/software.
Muylaert K., Gucht K.V.d., Vloemans N., Meester L.D., Gillis M. & Vyverman W. 2002. Relationship betwwen bacterial community composition and bottom-up versus top-down variables in four eutrophic shallow lakes. Applied and Environmental Microbiology. 68: 47404750.
Salmaso N. 2010. Long-term phytoplankton community changes in a deep subalpine lake: responses to nutrient availability and climatic fluctuations. Freshwater Biology. 55: 825-846.
Schwartz M.W., Brighman C.A., Hoecksema J.D., Lyons K.G., Mills M.H. & van-Mentgen P. 2000. Linking biodiversity to ecosystem function: implications for conservation ecology. Oecologia. 122: 297-305.
Silva L.H.S. 1999. Fitoplâncton de um reservatório eutrófico (lago Monte alegre), Ribeirão Preto, São Paulo, Brasil. Revista Brasileira de Biologia. 59: 281-303.
Smith J.A., Seltzer G.O., Farber D.L., Rodbell D.T. & Finkel R.C. 2005. Early local last glacial maximum in the tropical Andes. Science. 308: 678-681.
ter Braak C.J.F. & Simlauer P. 2004. Canoco for Windows version 4.53. Plant Research International, Wageningen, The Netherlands.
Tilman D. 1999. Global environmental impacts of agricultural expansion: the need for sustainable and efficient practices. Proceedings of the National Academy of Sciences. 96: 5995-6000.
Triana S. & Laperche V. 1999. Contaminant bioavailability in soils, sediments, and aquatic environments. Proceedings of the National Academy of Sciences. 96: 3365-3371.
Weisner S.E.B., Strand J.A. & Sandsten H. 1997. Mechanisms regulating abundance of submerged vegetation in shallow eutrophic lakes. Oecologia. 109: 592-599.
Weithoff G., Lorke A. & Walz N. 2000. Effects of watercolumn mixing on bacteria, phytoplankton, and rotifers under different levels of herbivory in a shallow eutrophic lake. Oecologia. 125: 91-100.
Western D. 2001. Human-modified ecosystems and future Worm B. & Lotze H.K. 2006. Effects of eutrophication, evolution. Proceedings of the National Academy of grazing, and algal blooms on rocky shores. Limnology Sciences. 98: 5458-5465. and Oceanography. 5: 569-579.
APPENDIX S1
Phytoplankton relative abundance for each study site, below are diversity (H, Shannon-Wiener diversity index), species richness (S), maximum expected diversity (Hmax), and Pielous evenness (J).
Presentado: 19/01/2011
Aceptado: 27/09/2011
