


Services on Demand
Journal

Article
 English (pdf)
 Article in xml format
 Article references
 Send this article by e-mail
Indicators
-
 Cited by SciELO
Related links
-
 Similars in
SciELO
Similars in
SciELO  uBio
uBio
Share

 Permalink
Ecología Aplicada
Print version ISSN 1726-2216
Ecol. apl. vol.18 no.2 Lima July/Dec 2019
http://dx.doi.org/10.21704/rea.v18i2.1335
DOI: http://dx.doi.org/10.21704/rea.v18i2.1335
ARTICULO ORIGINAL
EX SITU CONSERVATION PRIORITIES FOR THE PERUVIAN WILD TOMATO SPECIES (Solanum L. SECT. Lycopersicum (MILL.) WETTST.)
PRIORIDADES PARA LA CONSERVACIÓN EX SITU DE LAS ESPECIES SILVESTRES DE TOMATE DEL PERÚ (Solanum L. SECT. Lycopersicum (MILL.) WETTST.)
Dioliza Vilchez1,2, Diego A. Sotomayor1,3 y Cinthya Zorrilla1,4
1 Subdirección de Recursos Genéticos / Instituto Nacional de Innovación Agraria. Av. La Molina 1981 / Lima / PERU.
2 diolizavilchez@gmail.com.
3 Departamento de Ingeniería Ambiental, Universidad Nacional Agraria La Molina, Av. La Molina s/n, Lima, PERU. diego.sotomayor@gmail.com.
4 Departamento de Fitotecnia, Facultad de Agronomía, Universidad Nacional Agraria La Molina.cinzocis@gmail.com.
Abstract
Tomato (Solanum lycopersicum) is a crop of global importance that has center of origin in Peru, with 11 species of wild relatives (CWR) occurring in the country. These CWR contain genetic material that could be used to improve currently cultivated species, and that is usually stored ex situ in germplasm banks. Hence, assessing the representativeness of germplasm banks is important to strengthen genetic improvement of tomatoes as well as their resilience to globally changing conditions. Here, we used gap analysis methodology on the 11 species of tomato CWR occurring in Peru. This methodology consists in seven steps that consider representativeness in terms of herbaria/germplasm banks, geography and environments within the country, in order to establish conservation priorities. We also assessed conservation priorities for the Instituto Nacional de Innovación Agraria (INIA), which is the main ex situ conservation Institution in Peru. Nationally, we found one species with high priority for conservation: Solanum huaylasense, and for INIA we found six species with high conservation priority: S. huaylasense, S. neorickii, S. chmielewskii, S. corneliomulleri, S. arcanum and S. chilense. We also found that the gap analysis methodology allowed for a proper prioritization of species and be readily applied to other species. We conclude by recommending strategies to improve the genetic coverage of the tomato germplasm held at INIA, as well as by discussing priorities for in situ conservation of tomato CWRs.
Key words: Gap analysis, agrobiodiversity, conservation priorities, crop wild relatives, Solanum.
Resumen
El tomate (Solanum lycopersicum) es un cultivo de importancia mundial que tiene un centro de origen en el Perú, con 11 especies de parientes silvestres (CWR) presentes en el país. Estos CWR contienen material genético que podría usarse para mejorar especies actualmente cultivadas, y que generalmente se almacenan ex situ en bancos de germoplasma. Por lo tanto, la evaluación de la representatividad de los bancos de germoplasma es importante para fortalecer la mejora genética de los tomates, así como su resistencia a las condiciones mundiales cambiantes. Aquí, utilizamos la metodología de análisis de vacíos en las 11 especies de CWR de tomate presentes Perú. Esta metodología consiste en siete pasos que consideran la representatividad en términos de bancos de herbarios / germoplasma, geografía y ambiental dentro del país, a fin de establecer prioridades de conservación ex situ. También evaluamos las prioridades de conservación ex situ para el Instituto Nacional de Innovación Agraria (INIA), que es la principal institución de conservación ex situ en el Perú. A nivel nacional, encontramos una especie con alta prioridad para conservación: Solanum huaylasense, y para INIA encontramos seis especies con alta prioridad de conservación: S. huaylasense, S. neorickii, S. chmielewskii, S. corneliomulleri, S. arcanum y S. chilense. También encontramos que la metodología de análisis de vacíos permitió una priorización adecuada de las especies y se puede aplicar fácilmente a otras especies. Concluimos recomendando estrategias para mejorar la cobertura genética del germoplasma de tomate en el INIA, así como discutiendo las prioridades para la conservación in situ de los CWRs del tomate.
Palabras clave: análisis de vacíos, agrobiodiversidad, prioridades de conservación, parientes silvestres de cultivos, Solanum.
Introduction
Crop wild relatives (CWR) are wild plant species that share a relatively recent common ancestry with cultivated plants. CWR typically possess wider genetic diversity in comparison with their cultivated counterparts due to their constant interaction with the environment. That genetic diversity is lost during the domestication process (Castañeda-Alvarez et al., 2015a). However, those genes found in CWRs might be introgressed into the crop by genetic improvers, given the ease of transfer of genes between closely related species (Harlan & de Wet, 1971; Singh, 2001; Castañeda-Alvarez et al., 2015a). CWR have provided crops with traits such as pest and disease resistance, tolerance to abiotic stresses, increased yield, male sterility, and quality, increasing the value and sustainability in as many as 15 crops, many of them of worldwide importance, such as maize, potatoes, or rice. In the past 20 years, there has been a steady increase in the rate of release of cultivars containing genes from CWR, and their contribution should only increase as the development of molecular technologies makes identification and utilization of diverse germplasm more efficient (Dempewolf et al., 2017, Singh, 2001; Hajjar & Hodgkin, 2007; Prescott-Allen & Prescott- Allen, 1986; Tanksley & McCouch, 1997). Plant breeders obtain CWR material from genebanks, hence having a representative sample of such material is of critical importance, especially at origin centers, where their diversity is the highest. Tomate is one of the ten crops with the most breeding uses of CWR documented (Dempewolf et al., 2017). However, major gaps in the genetic diversity of important crop genepools such as tomato remain to be filled in ex situ germplasm collections (FAO, 1997; Maxted & Kell, 2009; Khoury et al., 2010).
A few methodologies have been described to determine gaps in germplasm collections. One of those methodologies is called "gap analysis", and consists in the determination of a priority score per species with a corresponding mapped distribution of gaps (Ramírez- Villegas et al., 2010). Gap analysis combines sampling, geographic and ecological/environmental representativeness scores to determine the extent of conservation of the wild relatives in ex situ conservation institutions. This methodology has been used widely to date (Castañeda-Alvarez et al., 2015a, b; Ramírez-Villegas et al., 2010; Khoury et al., 2010), and is efficient for prioritizing CWR taxa considering wide variation in the potential diversity encompassed in each taxon’s distribution and the lack of molecular diversity data. Based on that methodology, three types of scores are calculated: (1) sampling representativeness, (2) geographic representativeness, and (3) environmental representativeness. The sampling representativeness score allows to determine the total number of germplasm accessions estimated as sufficient to represent a taxon, relative to the known extent of the taxon utilizing all gene bank and reference (herbaria) data regardless of whether geographical coordinates are available. Geographic and environmental scores are used as proxies for genetic diversity and potential functional adaptation to diverse environments, respectively, based on the assumption that the genetic composition of plant species varies across its geographic range and is associated with adaptation to different ecological conditions (Debouck, 2009). This implies that a more representative collection of germplasm is more likely to capture a greater diversity of alleles adapted to different conditions locally. Together these three indices represent a powerful tool to assess gaps in germplasm collections, and also inform the strategies to fill those gaps as they can directly projected into maps.
Peru is considered a center of origin of tomato species, given that it has 84% of the species considered as tomatoes (Tanksley & McCouch, 1997). Within Solanum Section Lycopersicum, 13 species have been reported around the world, with 11 of those occurring in Peru, and three of them endemic (S. corneliomulleri, huaylasense y S. arcanum) (Peralta et al., 2008). Additionally, tomato has a great richness in terms of varieties, having diversity in shape, size, color, taste, texture and hardship, among other commercially important characters. Tomato has also been used as a model organism for genetic, physiological, cellular, and biochemical studies (Cocaliadis, 2012). However, the conservation of these species is incipient in Peru, as well as their use in genetic improvement. Moreover, the country imports genetically improved varieties. In Peru, the Instituto Nacional de Innovación Agraria (INIA) is responsible for research in genetic resources, and hence any conservation effort should start from its collections. Currently, INIA has a wild tomato germplasm bank with 156 accessions from seven species, but further collections are needed in the center of origin of such species. Here, we aim to (1) analyze the collection gaps for Peru on wild tomato species, (2) analyze the collection gaps for INIA’s tomato CWR collection, and (3) test the gap analysis methodology. We hypothesize that by combining the known information on the distribution of these species, we will be able to identify new collecting sites, along with their priority. This in turn will allow strengthening ex situ and in situ conservation efforts for CWR. We conclude our analysis by identifying potential areas for wild tomato in situ conservation.
Material and methods
This article follows and adapts the methodology proposed by Ramírez-Villegas et al. (2010). Our methodology is composed by a seven-step gap analysis process which is designed to evaluate conservation deficiencies considering the (1) taxonomic, (2) geographic and (3) environmental levels. The aim of this method is to define the extent to which current genebank holdings of Peruvian tomatoes at both national and international institutions represent the total genetic diversity within tomato CWRs. We also use this method with INIA’s tomato CWR germplasm collection. The method averages three scores in order to produce a Table 1 presenting the high, medium and low priority species for collecting. Using this priorization and species distribution models, we can identify potential collecting areas for high priority species, as well as overlapping high priority regions for the collection of multiple taxa identified and/or high priority sites for in situ conservation. The method was conducted as follows:
Determination of target taxa, delineation of target area and harvesting of occurrence data
This stage of the method involves three steps:
a. Identification of the target cultivated species, which in this case is Solanum lycopersicum, along with its wild relatives that occur within Peru. We used Peralta et al. (2008) taxonomy in order to determine the taxa to study.
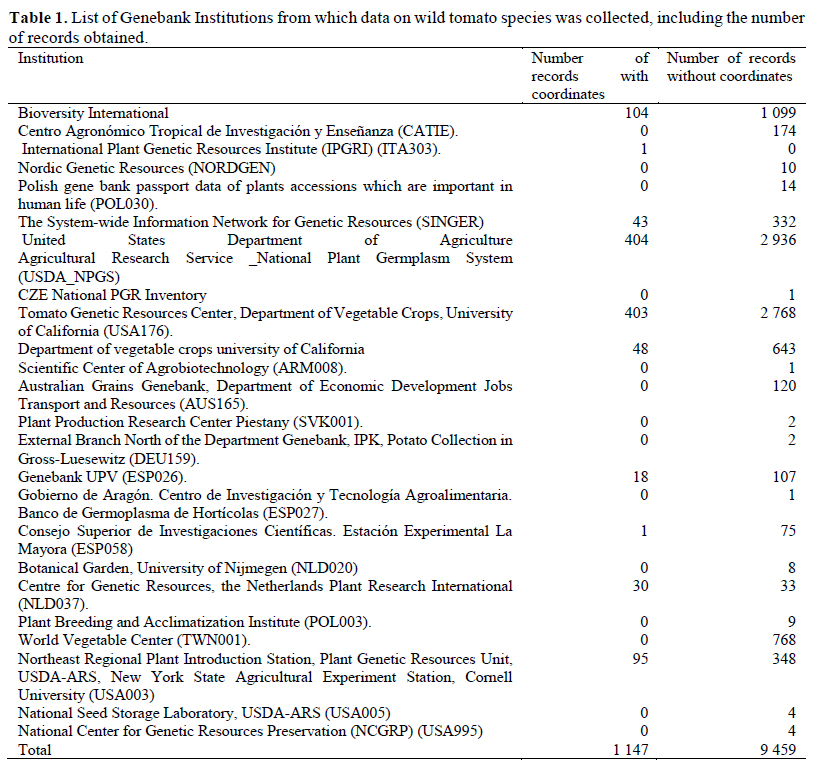
b. Creation of a database containing as many records as possible both of genebank accessions and herbarium specimens of both national and international databases, along with (when available) their respective passport data, specifically the names of the places of collection and coordinates (i.e. latitude and longitude). Data was collected from the Global Biodiversity Information Facility (GBIF), from GENESYS (GENESYS, 2018), from Solanaceae Source, and from INIA’s database on March 2018.
c. Cross-check, verification, and correction of geographic references (coordinates) through thorough review of data and use of verification tools, Google Earth, and high detail physical maps of localities, and strict selection only of verified geo-referenced samples for distribution modeling, as the quality of location data strongly affects the performance of niche modeling techniques (Graham et al., 2008). The final dataset is available at Sotomayor et al. (2019).
Determination of sampling deficiencies at the taxon level
A first estimate of collection priority is calculated for each taxon using the "Sampling Representativeness Score" (SRS, Equation 1), which compares total germplasm accessions to herbarium records.
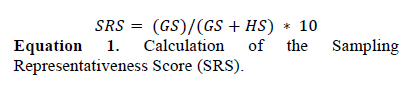
Equation 1. Calculation of the Sampling
GS: number of germplasm samples; HS: herbarium samples.
SRS is calculated as the number of germplasm samples (GS) divided by the total number of samples, i.e. the sum of germplasm plus herbarium samples (HS), regardless of whether samples contain geographical location coordinates. This score (SRS) allows for a general estimation of adequacy of germplasm holdings of each taxon based upon all available data at different genebanks and herbariums. In the case that a taxon has no genebank samples, it is listed as a ‘‘high priority species’’ for collecting by setting the FPS (see step 7 below) to 0. Mapping of herbarium samples and genebank accessions was performed using Q-GIS (version 3.2.2) (QGIS Development Team 2018) in order to provide a general geographic assessment of the available data. We calculated two types of SRS, one using all data for the country, and a second one only using germplasm data from INIA’s bank.
Create potential distribution models for taxa
Potential distributions of taxa are calculated using the maximum entropy (Maxent) model (Phillips et al., 2006), with a set of bioclimatic variables and species presence data as inputs. This set included 19 bioclimatic variables (BioClim) that were extracted from the website of WorldClim (WorldClim, 2005), (Hijmans et al., 2005), as well as the elevation associated with each geographic coordinate. BioClim includes temperature, rainfall and other variables calculated from their periodicity or range. We used Maxent due to its precision and confidence when predicting species distributions, even with low number of species records, as it has been elsewhere in the literature (Phillips et al., 2006; Hernandez et al., 2006; Loiselle et al., 2008; Costa et al., 2010; Phillips & Dudik, 2008; Dormann, 2006; Elith et al., 2006; Hijmans & Graham, 2006). Default features were used in Maxent, in which complexity of the models (represented by the number of terms and the type of interactions between environmental variables) depend upon the number of input data points (Phillips et al., 2006; Hernandez et al., 2006; Loiselle et al., 2008; Costa et al., 2010; Phillips & Dudik, 2008). Background points for model training equal 10 000 random points over the distributional range of the genepool (each species) in order to avoid overfitting (VanDerWal et al., 2009; Phillips, 2008). Ten runs were conducted per species in order to determine their potential distribution. We used an arbitrary threshold that would us to capture the top 90% of the predictions of the average model, in order to map the potential distribution coverage (PDC). Finally, we mapped the PDC for each taxa together with their respective collection coordinates in order to display the distribution of each species and to visually determine their correspondence.
Geographic coverage assessment
The adequacy of geographic coverage of accessions per species was calculated from the respective thresholded Maxent model (PDC) in comparison with the geographic coverage of the reported distribution of each species (GCS). This geographic coverage was estimated using a 10 km buffer around each geo- referenced point of the reported distribution of each species, after removing duplicates. These values were used to calculate the Geographic Representativeness Score (GRS, Equation 2).
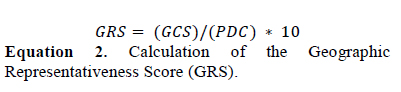
Equation 2. Calculation of the Geographic
GCS= geographic coverage of the reported distribution of each species;
PDC= potential distribution coverage of the taxon under analysis.
GRS is thus the geographic coverage of the reported distribution of collections (GCS) divided by the potential distribution coverage of the taxon under analysis (PDC). A higher the GRS, means a higher the representativeness of collections compared to the potential distribution of the taxon.
Environmental coverage assessment
The adequacy of environmental coverage of genebank accessions is calculated as an ‘Environmental Representativeness Score’ (ERS, Equation 3), assessed by comparing the germplasm samples in relation to the full environmental range of the modeled taxon distribution. The same set of climatic layers used for developing the potential distribution coverage (the MaxEnt models) are used to perform a principal components analysis, after standardization. The first two principal components (which accounted for more than 70% of the variability in each species) were reclassified into twenty equal classes.

Equation 3. Calculation of the Environmental Representativeness Score (ERS), the adequacy of environmental coverage of genebank accessions. EC: environmental coverage of germplasm collections; PED: potential environmental coverage of the taxon under analysis; w: weight of the principal component.
For these two principal components (i = 2), ERS is calculated as the environmental coverage (i.e. number of different classes) of germplasm collections (EC) divided by the potential environmental coverage of the taxon under analysis (PED), times the weight (W) of the principal component (weights of the two components are rescaled so that the sum of their weights is 1).
Numeric assessment to determine the priority of collecting for ex situ conservation for each taxa
All representativeness scores (SRS, GRS, and ERS) were averaged with equal weight to obtain a final score of prioritization of species (Khoury et al., 2019; Castañeda-Alvarez et al., 2015b; Ramírez-Villegas et al.; 2010). The "Final Priority Score (FPS)", is then used to classify taxa according to the following ranges (Ramírez-Villegas et al., 2010): (1) as high priority species if the FPS is between 0 and 3, (2) as medium priority species if the FPS is between 3.01 and 5, (3) as low priority species if the FPS is between 5.01 and 7.5, and (4) as well conserved species (no need for further collection) if the FPS is between 7.51 and 10. This assessment was conducted both for the entire country scores, as well as for INIA’s scores.
Prioritization of geographic areas for collecting germplasm
The potential collection zones for each high priority species were identified separately in order to determine "collection gaps". This is done by contrasting potential distributions with collection sites and by combining those collection gaps for the priorization. These gaps represent zones where further collection missions should be conducted in order to expand the genetic base of germplasm collections and represents the final result of this methodology. We also produced a combined map of all potential distributions of the species analyzed, in order to identify areas of high priority for collection of multiple tomato CWR, as well as areas for the priorization of in situ conservation actions of these species.
Results
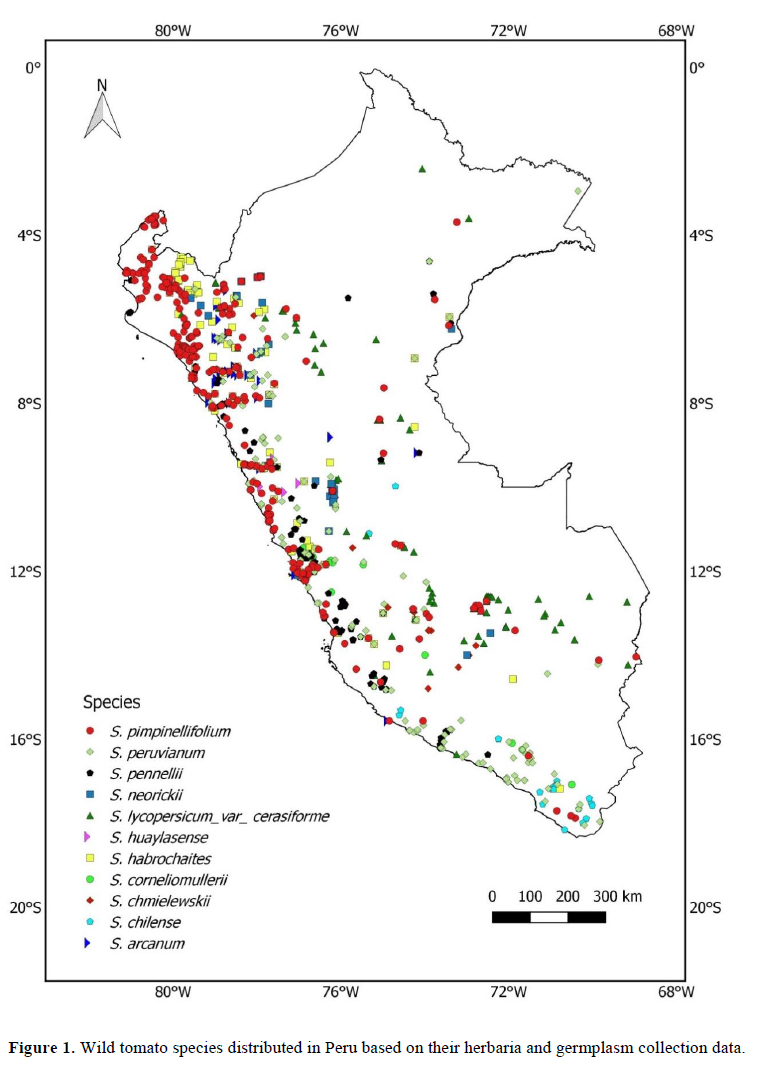
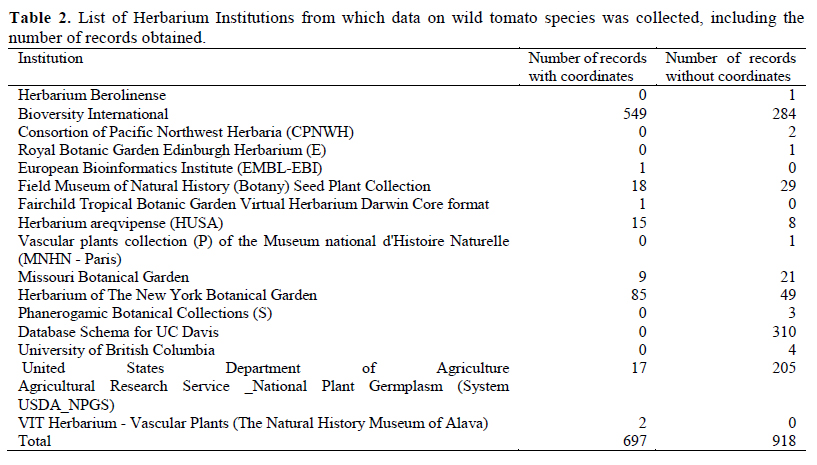
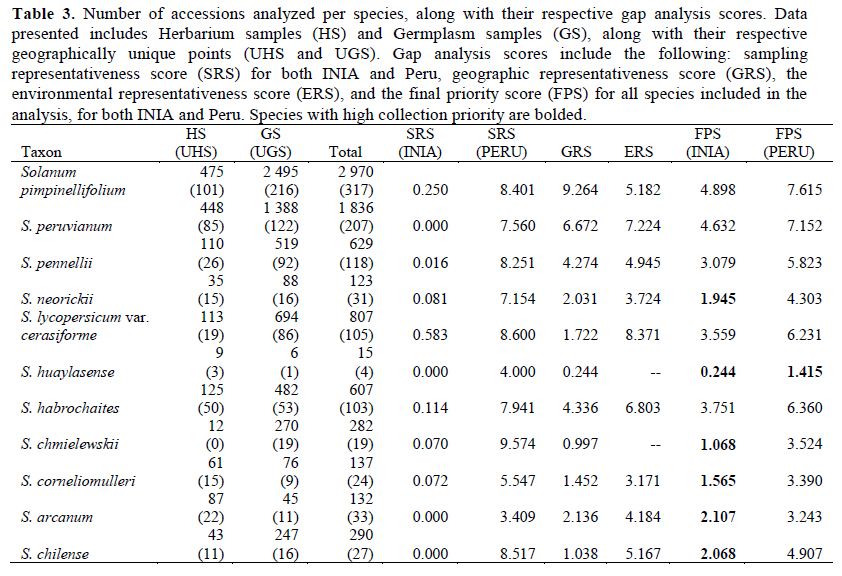
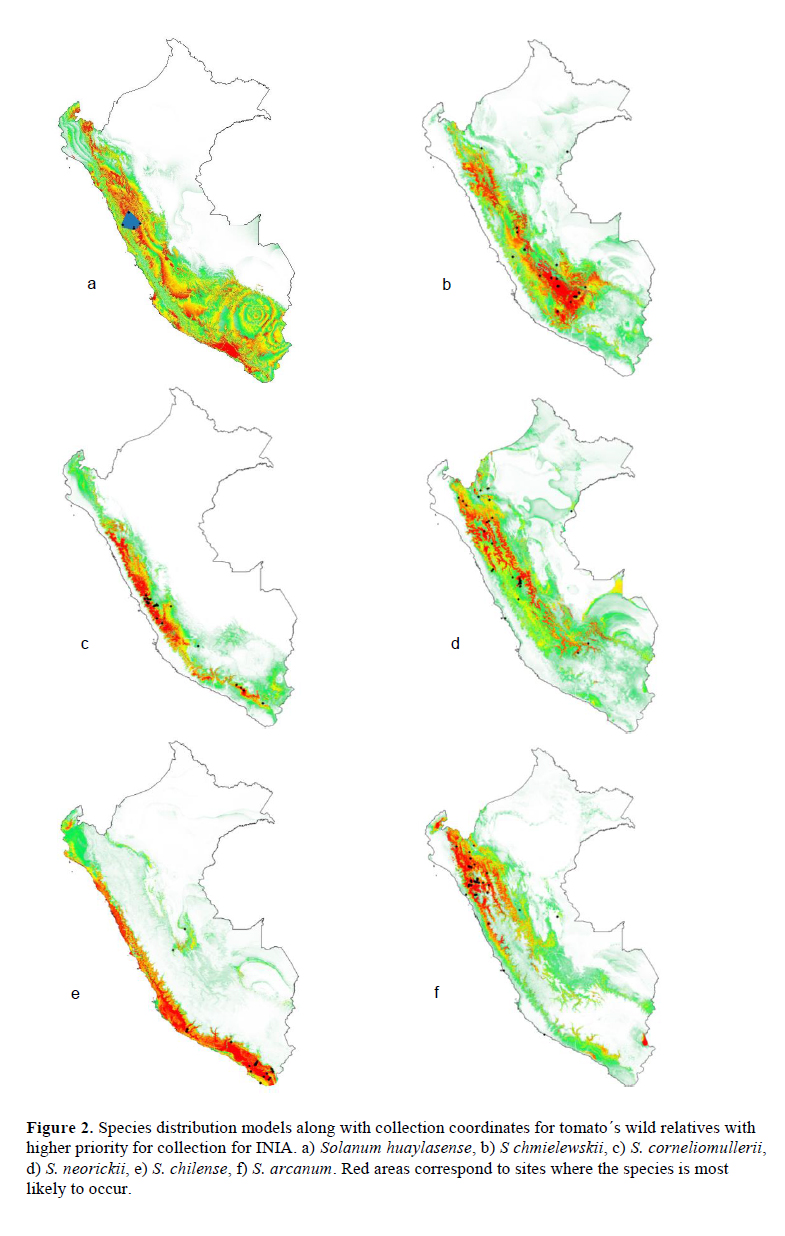
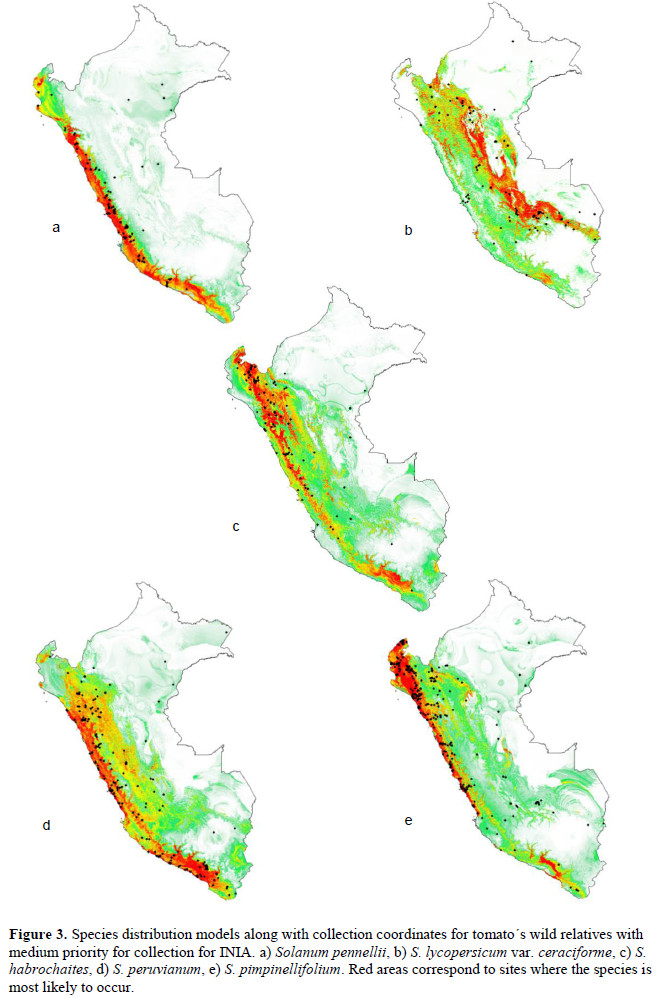
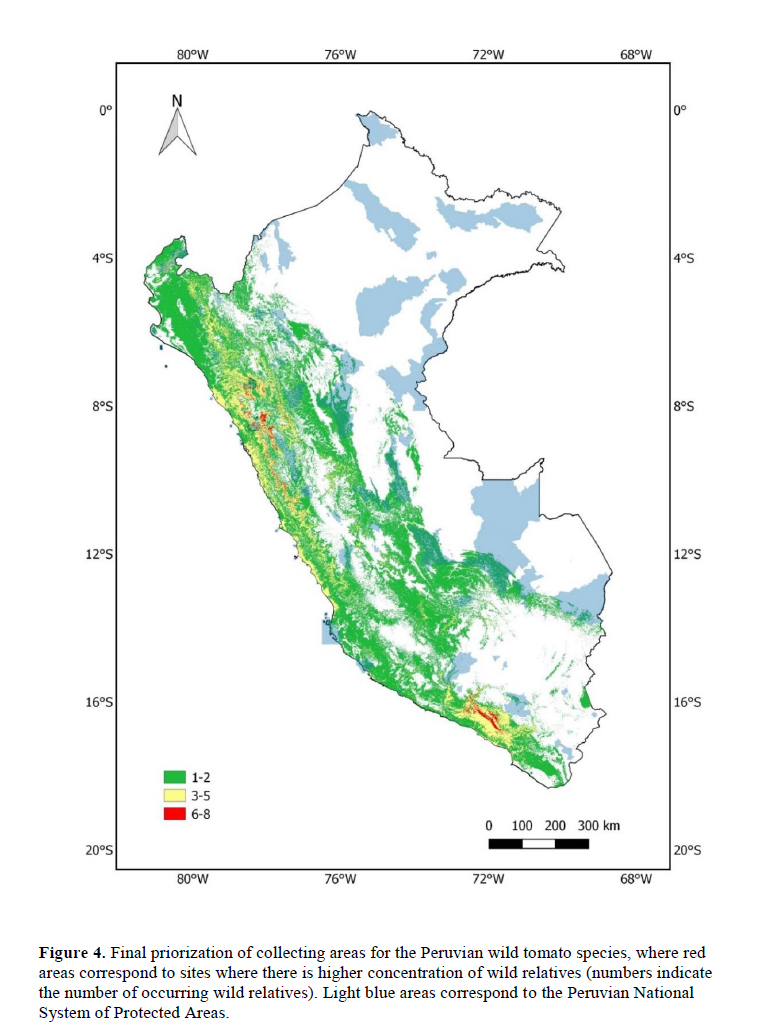
We analyzed 11 species of wild relatives that are distributed in Peru (Figure 1). Generally, there were more collections in germplasm banks (Table 1) than in herbaria (Table 2), although, in both cases, the majority of records did not have geographic coordinates. The gap analysis methodology allowed us to successfully assess the ex situ conservation priorities for all 11 species (Table 3). One species was listed as high conservation priority, S. huaylasense (Figure 2a), at the national level; while for INIA, six species were listed as high priority for collection (Figure 2): S. huaylasense, S. chmielewskii, S. corneliomullerii, S. neorickii, S. chilense, and S. arcanum. S. huaylasense only had 3 records from herbaria and one from germplasm banks, so it was listed with the highest priority of all species analyzed. At the national level, five other species were listed as medium priority for collection: S. neorickii, S. chmielewskii, S. corneliomulleri, S. arcanum, and S. chilense; four species as low priority for collection: S. pennellii, S. lycopersicum var. cerasiforme, S. habrochaites and S. peruvianum; and one species as well conserved: S. pimpinellifolium. For INIA, five species were listed as medium priority (Figure 3): S. pimpinellifolium, S. peruvianum, S. penellii, S. lycopersicum var. cerasiforme, and S. habrochaites. All three endemic species to Peru (S. corneliomulleri, S. huaylasense, S. arcanum) were listed as high priority for INIA collection, while only S. huaylasense was listed as high priority at the national level, and the other two endemics as medium priority. Two main areas had a major concentration of tomato CWRs, one in the north towards La Libertad Region, and one in the south towards Arequipa Region (Figure 4).
Discussion
Here we aimed to conduct a gap analysis of the Peruvian crop wild relatives (CWR) of the tomato and to test the aforementioned methodology. We successfully assessed the conservation priorities for all 11 CWR species from Peru and found contrasting priorities among species both at the national level, as well as for INIA’s collection. Firstly, at the national level, we found that one of three endemic species to Peru (S. huaylasense) had a high conservation priority, while the other two endemics (S. arcanum and S. corneliomulleri) had medium conservation priority, along with three other species. These results contrasted with those found at INIA, where all three endemics plus three other species had high conservation priorities; and the other five species analyzed had medium conservation priorities. In both assessments, only one species, S. pimpinellifolium at the national level, had no urgency of collection and hence is well represented in current germplasm banks. This last species corresponds to a species that widely distributed in the country. Secondly, we conducted an adapted version of gap analysis (Ramírez-Villegas et al., 2010) in which we were able to estimate three different scores in order to construct a final priority score. Overall, this gap analysis on tomato CWRs represents an important outcome for the conservation of CWR at a center of origin and could serve as a starting point for other gap analyses for species that have their center of origin in Peru. This also represents the first analysis of ex situ conservation priorities for this crop, and its recommendations should be taken into consideration for future efforts on capturing the genetic diversity of tomato’s CWRs.
The second aim of this article was to test the gap analysis methodology (Maxted et al., 2008; Ramírez- Villegas et al., 2010), and if needed to adapt it to the available data. We were able to follow the steps of calculating taxonomic gaps in the collections and running species distributions models to estimate geographic and environmental gaps. However, we were not able to conduct an analysis on rarity due to the lack of good representativeness among widely collected species along the environmental axes (Ramírez- Villegas et al., 2010). To replace that criterion, we can propose the addition of a consideration on endemicity, with the purpose of assigning extra priority to species that endemics, or highly restricted endemics. This criterion is important, especially in a country that is also a center of origin and that has many endemic species. Overall, this adapted methodology was useful and effective in determining gaps for priorization of ex situ conservation collection, both at the national and INIA’s level. More analysis is needed to deal with environmental/ecological representativeness using multivariate statistics, as well as to analyze rarity. These refinements can be implemented in a crop that has more accessions, or on a gap analysis for entire distributions of CWR. This study represents a well- documented study case, and hopefully can be used by other practioners to conduct gap analyses on the CWR of other crops.
Our gap analysis allowed us to determine conservation priorities for the Peruvian CWR of the tomato. Given these results, the next step is to incorporate these results in the design of a strategy to enrich the current tomato genebank at INIA. This strategy should focus on: (1) collection missions for species with high and medium conservation priority, by evaluating the maps generated with Maxent in contrast with current collections to estimate collection gaps, and then, to super-impose collection gaps between species; (2) collection missions to complete specific gaps for species with low priority also by comparing Maxent models and geographic coordinates of current collections, and if possible relate these gaps to the collection gaps of the high/medium priority species; and (3) assessment of the genetic diversity of species that do not have any priority for collection, in order to determine the degree of duplication among samples. Together, these lines of action will allow for the conservation of a comprehensive sample of tomato´s genepool in Peru and can also serve to implement strategies in other species with enough data for gap analysis.
One of the products of gap analyses are maps highlighting sites were the species under study are more likely to occur (Castañeda-Alvarez et al., 2015a, b; Ramírez-Villegas et al., 2010). These maps guide future collection efforts but can also be used to prioritize sites for in situ conservation of such species, especially after recognizing sites where multiple CWRs occur. These maps of species distributions can be used as inputs for systematic conservation planning (Margules & Pressey, 2000) in order to identify sites where in situ conservation of these species can be achieved. As an example of this process, in Figure 4 we combined the distributions of tomato CWR species with the Peruvian National System of Protected Areas and found that the tomato CWR hotspot towards the northern part of the country (La Libertad Region) coincides with two protected areas Calipuy and Sunchubamba. A recommendation arising from this study could be to actively track the tomato CWR species in those protected areas. Alternatively, a national protected area (e.g. an agricultural biodiversity zone) could be created to conserve tomato CWRs in the southern hotspot. Hence, gap analyses can also be used to delineate in situ conservation strategies, as they have been used for a global analysis to identify sites at the global scale for CWR in situ conservation (Vincent et al., 2019).
Conclusions
Gap analysis has proved to be an effective and useful methodology for the determination of ex situ conservation priorities. We successfully assessed the conservation priorities for all 11 CWR species from Peru and found that one of three endemic species to Peru (S. huaylasense) had a high ex situ conservation priority, while the other two endemics (S. arcanum and S. corneliomulleri) had medium ex situ conservation priority. Additionally, this methodology can also guide the priorization of sites for in situ conservation, as we identified two hotspots of tomato CWRs diversity. Next steps to optimize this methodology could be to interact with experts in tomato within the country or abroad in order to validate the priorities found here. Further refinements could also be in the direction of improving Maxent models for very restricted endemic species (e.g. S. huaylasense) that yielded models over- predicting their distribution. Alternatively, other methodologies can be developed to deal with such species. Genetic representativeness of current germplasm collections can also be another line of action to complement gap analysis and determine the representativeness of a collection. Overall, this gap analysis methodology represents an opportunity to develop further analyses on other species and in countries that are centers of origin of widely cultivated species.
Acknowledgements
Funding was provided by the Project "Discovering the potential for genetic improvement of tomato quality in the wild tomato germplasm of Peru", funded by the Peruvian National Program of Agricultural Innovation, Project #103.
Literature cited
Castañeda-Álvarez N.P., Khoury C.K., Achicanoy H.A., Bernau V., Dempewolf H., Eastwood R.J. & et al. 2015a. Global conservation priorities for crop wild relatives. Nature Plants,16022. DOI: 10.1038/NPLANTS.2016.22Links ]org/10.1038/NPLANTS.2016.22" target="_blank">.
Castañeda-Álvarez N.P., de Haan S., Juárez H., Khoury C.K., Achicanoy H.A. & Sosa C.C. 2015b. Ex Situ Conservation Priorities for the Wild Relatives of Potato (Solanum L. Section Petota). PLoS ONE, 10(4): e0122599. DOI: 10.1371/journal.pone.0122599Links ]org/10.1371/journal.pone.0122599" target="_blank">.
Cocaliadis M. 2012. Desarrollo y utilización de marcadores moleculares para el genotipado de la colección de líneas de introgresión de Solanum lycopersicoides en el fondo genético del tomate cultivado . Tesis Master en Mejora Genética Vegetal. Universidad Politécnica de Valencia. Valencia, España. URLs:http://hdl.handle.net/10251/27382; https://riunet.upv.es/bitstream/handle/10251/27382/Tesis_de_Master_Flor_Cocaliadis.pdf?sequence=1Links ]upv.es/bitstream/handle/10251/27382/Tesis_de_Master_Flor_Cocaliadis.pdf?sequence=1" target="_blank">.
Costa G.C., Nogueira C., Machado R.B. & Colli G.R. 2010. Sampling bias and the use of ecological niche modeling in conservation planning: a field evaluation in a biodiversity hotspot. Biodiversity Conservation, 19: 883–899. [ Links ]
Debouck D.G. 2009. Cahiers de Phaséologie – Synonymie. International Center for Tropical Agriculture, CIAT. URI: https://hdl.handle.net/10568/83129Links ]handle.net/10568/83129" target="_blank">.
Dempewolf H., Baute G., Anderson J., Kilian B., Smith C., & Guarino L. 2017. Past and future use of wild relatives in crop breeding. Crop Science, 57: 1070-1082. [ Links ]
Dormann C.F. 2006. Promising the future? Global change projections of species distributions. Basic Applied Ecology, 8: 387–397. [ Links ]
Elith J., Graham C.H., Anderson R.P., Dudik M. & Ferrier S. 2006. Novel methods improve prediction of species’ distributions from occurrence data. Ecography, 29(2):129–151. DOI: https://doi.org/10.1111/j.2006.0906-7590.04596.x.
FAO (Food and Agriculture Organization of the United Nations). 1997. State of the World’s Plant Genetic Resources for Food and Agriculture. Rome, Italy. Available: http://apps3.fao.org/wiews/wiewspage.jsp?i_l=EN&show = SOW1.
GENESYS. 2018. The global gateway to genetic resources. In: GENESYS – Plant Genetic Resources database. URL:https://www.genesys-pgr.org/welcomeLinks ]genesys-pgr.org/welcome" target="_blank">.
Graham C., Elith J., Hijmans R.J., Guisan A. & Peterson A.T. 2008. The influence of spatial errors in species occurrence data used in distribution models. Journal of Applied Ecology, 45: 239–247. [ Links ]
Guralnick R.P., Wieczorek J., Beaman R. & Hijmans R.J. 2006 The BioGeomancer: automated georeferencing to map the world´s biodiversity data. PLoS Biology, 4(11):e381. DOI:https://doi.org/10.1371/journal.pbio.0040381 . [ Links ]
Hajjar R. & Hodgkin T. 2007. The use of wild relatives in crop improvement: A survey of developments over the last 20 years. Euphytica, 156: 10-13. [ Links ]
Harlan J.R. & de Wet J.M.J. 1971. Toward a Rational Classification of Cultivated Plants. Taxon, 20(4): 509– 517. DOI:10.2307/1218252Links ]org/10.2307/1218252" target="_blank">.
Hernandez P.A., Graham C.H., Master L.L. & Albert D.L. 2006. The effect of sample size and species characteristics on performance of different species distribution modeling methods. Ecography, 29: 773–785. [ Links ]
Hijmans R.J., Cameron S.E., Parra J.L., Jones P.G. & Jarvis. 2005. Very high resolution interpolated climate surfaces for global land areas. International Journal of Climatology, 25: 1965-1978. [ Links ]
Hijmans R.J. & Graham C. 2006. The ability of climate envelope models to predict the effect of climate change on species distributions. Global Change Biology, 12(12): 2272–2281. DOI: https://doi.org/10.1111/j.1365-2486.2006.01256.xLinks ]org/10.1111/j.1365-2486.2006.01256.x" target="_blank">.
IPCC (Intergovernmental Panel on Climate Change). 2007. IPCC Fourth Assessment Report: Climate Change 2007. IPCC, Geneva. [ Links ]
Khoury C., Laliberte B. & Guarino L. 2010. Trends in ex situ conservation of plant genetic resources: a review of global crop and regional conservation strategies. Genetic Resources and Crop Evolution, 57(4): 625–639. DOI: 10.1007/s10722-010-9534-zLinks ]org/10.1007/s10722-010-9534-z" target="_blank">.
Khoury C.K., Amariles D., Soto J.S., Diaz M.V., Sotelo S., Sosa C.C., Ramírez-Villegas J., Achicanoy H.A., Velásquez-Tibatá J., Guarino L., León B., Navarro- Racines C., Castañeda-Álvarez N.P., Dempewolf H., Wiersema J.H. & Jarvis A. 2019. Comprehensiveness of conservation of useful wild plants: an operational indicator for biodiversity and sustainable development targets. Ecological Indicators, 98: 420-429. DOI: 10.1016/j.ecolind.2018.11.016Links ]org/10.1016/j.ecolind.2018.11.016" target="_blank">.
Loiselle B.A., Jorgensen P.M., Consiglio T., Jimenez I. & Blake J.G. 2008. Predicting species distributions from herbarium collections: does climate bias in collection sampling influence model outcomes? Journal of Biogeography, 35: 105–116. [ Links ]
Margules C.R. & Pressey R.L. 2000. Systematic conservation planning. Nature, 405: 243-253. [ Links ]
Maxted N. & Kell S. 2009. Establishment of a global network for the in situ conservation of crop wild relatives: status and needs. FAO Commission on Genetic Resources for Food and Agriculture. Rome, Italy. [ Links ]
Maxted N., Dulloo E., Ford-Lloyd B.V., Iriondo J.M. & Jarvis A. 2008. Gap analysis: a tool for complementary genetic conservation assessment. Diversity and Distributions, 14: 1018–1030. [ Links ]
Peralta I., Spooner D. & Knapp S. 2008. Taxonomy of Wild Tomatoes and their Relatives (Solanum sect. Lycopersicoides, sect. Juglandifolia, sect. Lycopersicon; Solanaceae). Book of The American Society of Plant Taxonomists. [ Links ]
Phillips S.J. 2008. Transferability, sample selection bias and background data in presence-only modeling: a response to Peterson, (2007). Ecography, 31: 272–278. [ Links ]
Phillips S.J., Anderson R.P. & Schapire R.E. 2006. Maximum entropy modeling of species geographic distributions. Ecological Modelling, 190: 231–259. [ Links ]
Phillips S.J. & Dudik M. 2008. Modeling of Species Distributions with Maxent: New Extensions and Comprehensive Evaluation. Ecography, 31: 161–175. [ Links ]
Prescott-Allen C. & Prescott-Allen R. 1986. The First Resource: Wild Species in the North American Economy. Yale University, New Haven. [ Links ]
Ramírez-Villegas J., Khoury C., Jarvis A., Debouck D.G. & Guarino L. 2010. A Gap Analysis Methodology for Collecting Crop Genepools: A Case Study with Phaseolus Beans. PLoS ONE, 5: e13497. DOI: 10.1371/journal.pone.0013497.
Singh S.P. 2001. Broadening the Genetic Base of Common Bean Cultivars: A Review. Crop Science, 41: 1659-1675. [ Links ]
Sotomayor D.A., Vilchez D. & Zorrilla C. 2019. Dataset on occurrences of Lycopersicum species from Peru. Figshare dataset: https://doi.org/10.6084/m9.figshare.9880073.v1Links ]org/10.6084/m9.figshare.9880073.v1" target="_blank">.
Tanksley S.D. & McCouch S.R. 1997. Seed Banks and Molecular Maps: Unlocking Genetic Potential from the Wild. Science, 277: 1063–1066. [ Links ]
VanDerWal J., Shoo L.P., Graham C.H. & Williams S.E. 2009. Selecting pseudo-absence data for presence-only distribution modeling: How far should you stray from what you know? Ecological Modeling, 220(4): 589–594. DOI: 10.1016/j.ecolmodel.2008.11.010Links ]org/10.1016/j.ecolmodel.2008.11.010" target="_blank">.
Veloz S.D. 2009. Spatially autocorrelated sampling falsely inflates measures of accuracy for presence-only niche models. Journal of Biogeography, 36(12): 2290–2299. DOI: https://doi.org/10.1111/j.1365-2699.2009.02174.x. [ Links ]
Vincent H., Amri A., Castañeda-Álvarez N.P., Dempewolf H., Dulloo E., Guarino L., Hole D., Mba C., Toledo A. & Maxted N. 2019. Modeling of crop wild relative species identifies areas globally for in situ conservation. Communications Biology, 2: 136. DOI: https://doi.org/10.1038/s42003-019-0372-zLinks ]org/10.1038/s42003-019-0372-z" target="_blank">.
WorldClim. 2005. Bioclimatic variables. In: WorldClim - Global Climate Data; Free climate data for ecological modeling and GIS. URL: http://www.worldclim.org/bioclimLinks ]worldclim.org/bioclim" target="_blank">.
Presentado: 10/09/2018
Aceptado: 23/10/2019

