


 Inglés (pdf)
 Articulo en XML
 Referencias del artículo
 Enviar articulo por email
 Citado por SciELO
  Similares en
SciELO
Similares en
SciELO  uBio
uBio 
 Permalink
Introduction
In the last decade, there has been a growing worldwide concern related to water quality issues (Orta, 2002). In developing countries, there is a real struggle for access to water due to the rapid demographic growth, new life habits, and industrial development without proper planning (Delgadillo et al., 2010). Mainly, inappropriate wastewater disposal, garbage, mining tailings, and chemical products have caused water pollution (Chulluncuy, 2011). The first has its most important source in homes and industries, as the wastewater is sent directly to the sewage system where different qualities of wastewater mix and ultimately reach a natural water body without the necessary treatment (Lahera, 2010).
Treating wastewater and reusing it for non-potable applications poses a potential solution for areas with limited access to water which are common around the globe (Winward et al., 2008). Typical uses for the treated wastewater revolve around agricultural, industrial, recreational and aquifer recharge activities (Guadarrama & Galván, 2015). In many Latin American countries, wastewater is commonly used without a previous treatment or diluted with natural water bodies, which causes health problems, especially when the untreated water is used for irrigation in fields destined for direct human consumption (Silva et al., 2008). This type of usage represents a risk, as wastewater is a source of pathogens such as bacteria, viruses, protozoa and worms, which cause gastrointestinal infections in humans (Veliz et al., 2009).
In this stage, finding new technological alternatives for wastewater treatment that are of low cost and simple requirements of operation and maintenance is a necessity (Delgadillo et al., 2010). Despite the development of multiple treatment technologies including centralized and decentralized systems, in general, the treatment capacity is relatively low in developing countries due to economic limitations (Wu et al., 2016). As the need for big-scale treatment systems grows fast, effort must be put into developing alternatives that are economically accessible and efficient.
Efficient microorganisms have been successfully applied in many aspects of environmental management (Okuda & Higa, 1999). These organisms mostly have fermentative properties, can produce bioactive substances, compete and display antagonism with pathogens, which can have positive impacts on both human health and the ecosystem (Romero & Vargas, 2017). Their potential for water treatment relies on their capability to enhance the natural process of oxidation (Higa & Chinen, 1998). The efficient microorganisms are leaded by lactic acid bacteria (LAB) which secrete organic acids that create acidic conditions down to a pH of 4.7 (Axelsson, 2004, citado por León et al., 2006). This pH drop is considered as the main inhibiting agent of growth for pathogenic microorganisms (Carrasco et al., 2002). Most lactic acid bacteria have a high tolerance to pH below 5 (Serna & Rodriguez, 2005), which gives them a competitive advantage over other bacteria (Hofvendahl & Hahn, 2000). The acidic conditions can lead to the removal of fecal coliform in wastewater, which needs the pH to be between 5.5 and 7.5 to survive (McFeters & Stuart, 1972).
One common application of lactic acid bacteria is as bio-preservative because of the production of substances with antibacterial properties, which prevent the decomposition of food products and the development of pathogenic microorganisms (Martín del Campo et al., 2008). Another biotechnological application of lactic acid bacteria is the production of liquid organic fertilizer. With this, Peralta et al. (2016) transformed the excreta of cattle into liquid organic fertilizer with good characteristics in a short time. Furthermore, Mindreau et al. (2016) evaluated physicochemical and microbiological parameters in a process of human feces stabilization through the inoculation of lactic acid bacteria from a solution called Biolac (or B-lac), accomplishing the stabilization of the residue in only 3 days. In addition, the application of LAC in water treatment has been investigated by Corpas & Herrera (2012), who obtained a reduction in coliform bacteria (41.1%) and Escherichia coli (48%) in effluents from a milk production plant, using efficient microorganisms.
The purpose of this study is to evaluate the effect of lactic acid bacteria, in the form of a lactic acid microbial consortium (B-lac), on the pH decrease to remove fecal coliform in domestic wastewater from the eco-touristic circuit Lomas de Lucumo, located in the Rural Village Center Quebrada Verde, in Pachacámac, (Lima, Peru). Experiments were conducted in the Environmental Biotechnology and Bioremediation Laboratory (Department of Biology) at the National Agrarian University La Molina (UNALM). This research aims to establish a biotechnological method for the fast and economic elimination of pathogens in domestic wastewater with the purpose of its later use in irrigation.
Materials and methods
Wastewater characterization
The wastewater was characterized for the main water quality parameters as shown in Table 1. The values were determined in the Environmental Biotechnology and Bioremediation Laboratory and the Environmental Engineering Laboratory, both at UNALM.
Table 1 Average values of the physical, chemical, and microbiological parameters analyzed in the wastewater - Lomas de Lucumo.
| Parameter | Unit | Concentration in wastewater - Lomas de Lucumo |
|---|---|---|
| Temperature | °C | 25.6 |
| Electric conductivity | uS/cm | 1 244 |
| pH | -- | 8.11 |
| Total suspended solids | mg/l | 16.67 |
| BOD | mg/l | 13.24 |
| COD | mg/l | 25.33 |
| Fecal coliforms | MPN/100 ml | 9.65x10⁵ |
| MPN: most probable number. BOD: biological oxygen demand. COD: chemical oxygen demand. |
Microbiological analysis of B-lac
The lactic acid microbial consortium, or B-lac, was characterized for key microbiological parameters in the Marino Tabusso Laboratory, at UNALM (Table 2). The aim was to determine if there is a presence of pathogens that would contaminate the sample or others that could interfere in the process of lactic acid fermentation. The microbiological analysis was carried out according to the procedures described by the Salfinger & Tortorello (2015).
Table 2 Microbiological analysis of B-lac.
| Microorganism | Unit | Result |
|---|---|---|
| Viable Aerobic Mesophilic Bacteria | CFU/ml | 42x10 |
| Molds and yeasts | CFU/ml | 70x10 |
| Total Coliforms | MPN/ml | < 3 |
| Fecal Coliforms | MPN/ml | < 3 |
| Note: Values < 3 indicate the absence of microorganisms. MPN: most probable number. CFU: colony-forming unit. |
Sampling and conditioning
Wastewater sampling was done on two occasions. The first consisted of the sampling of 10 l, taken from the wastewater storage box from the sanitary facilities in the eco-touristic circuit (used for the first stage of experiments and the wastewater characterization). In the second, only 5 l of wastewater were sampled which were used to evaluate the three best treatments determined in the first stage of the experiments. Samples were transported to the Environmental Biotechnology and Bioremediation Laboratory at UNALM, where they were stored at 4 °C until used for the experiments.
Experimental design and preparation of treatments
Two factors were established: the percentage (%) by volume of molasses and the percentage (%) by volume of the B-Lac solution, each in 6 levels. These were evaluated in a Completely Randomized Design (CRD) in a 6x6 factorial arrangement with three repetitions. 36 treatments were prepared in triplicate using combinations of 6 concentrations of B-Lac and 6 of molasses in proportions of 0 (0 ml), 1 (2 ml), 3 (6 ml), 5 (10 ml), 7 (14 ml), and 10% (20 ml), as shown in Table 3. These percentages were measured in respect of a wastewater volume of 200 ml (fixed volume) used for each treatment. The labeled containers were hermetically sealed to provide anaerobic conditions and were exposed to environmental conditions in the laboratory (average temperature of 34°C).
Table 3 Composition of the 36 treatments based on molasses, B-lac, and wastewater.
| T | B-Lac (ml) | Molasses (ml) | Wastewater (ml) |
|---|---|---|---|
| T1 | 0 | 0 | 200 |
| T2 | 0 | 2 | 200 |
| T3 | 0 | 6 | 200 |
| T4 | 0 | 10 | 200 |
| T5 | 0 | 14 | 200 |
| T6 | 0 | 20 | 200 |
| T7 | 2 | 0 | 200 |
| T8 | 2 | 2 | 200 |
| T9 | 2 | 6 | 200 |
| T10 | 2 | 10 | 200 |
| T11 | 2 | 14 | 200 |
| T12 | 2 | 20 | 200 |
| T13 | 6 | 0 | 200 |
| T14 | 6 | 2 | 200 |
| T15 | 6 | 6 | 200 |
| T16 | 6 | 10 | 200 |
| T17 | 6 | 14 | 200 |
| T18 | 6 | 20 | 200 |
| T19 | 10 | 0 | 200 |
| T20 | 10 | 2 | 200 |
| T21 | 10 | 6 | 200 |
| T22 | 10 | 10 | 200 |
| T23 | 10 | 14 | 200 |
| T24 | 10 | 20 | 200 |
| T25 | 14 | 0 | 200 |
| T26 | 14 | 2 | 200 |
| T27 | 14 | 6 | 200 |
| T28 | 14 | 10 | 200 |
| T29 | 14 | 14 | 200 |
| T30 | 14 | 20 | 200 |
| T31 | 20 | 0 | 200 |
| T32 | 20 | 2 | 200 |
| T33 | 20 | 6 | 200 |
| T34 | 20 | 10 | 200 |
| T35 | 20 | 14 | 200 |
| T36 | 20 | 20 | 200 |
| T: treatments. |
For treatments, a lactic acid bacterial consortium (B-Lac) composed of the genus Lactobacillus, Streptococcus, and Bifidobacterium, which was prepared in the Environmental Biotechnology and Bioremediation Laboratory, was used. In addition, sugar cane molasses was the main source of soluble carbohydrates, nutrients, and growth factor (Peralta et al., 2016), which was obtained from the stable at UNALM.
The variation of pH as a function of time was used as the response variable, as shown in Figure 1. The pH values on the third day of measurements were analyzed with an Analysis of Variance (ANOVA) followed by Tukey´s range test, using a level of significance of 95% (p < 0.05).

Evaluation of pH variation
The experiments consisted of two stages. First, the pH values were evaluated in the 36 treatments during 9 days using the potentiometric method according to Londoño et al. (2010). Subsequently, the three best treatments that met the criteria described by Peralta et al. (2016) were selected; a good treatment has to meet the following: pH ≤ 4.5, rapid pH decrease to around 4, absence of bad odor, and no formation of mold or yeast layers.
The second stage of evaluation aimed to determine the best treatment out of the three selected during the first stage. Three repetitions were considered for each treatment and the decrease in pH was evaluated during 4 days.
Microbiologic analysis of treated wastewater
After the second stage of evaluation, the best treatment was chosen. The effectiveness of each treatment was evaluated by determining the removal of fecal coliform. The methodology used was the most probable number (MPN), according to the recommendations established in the Standard Methods (APHA, 2017).
Results and discussion
First stage of evaluation of 36 treatments
Before preparing the treatments, the initial pH of the wastewater was 8.11, while the molasses had a pH of 5.05 and the B-Lac solution registered a value of 3.86. Due to this, when preparing the 36 treatments, most of them stabilized at a low pH after 3 minutes. In addition, the average temperature at which the fermentation process was evaluated was 33°C. According to Delgadillo et al. (2010), this value is within the optimum range for the development of microorganisms, so the speed at which the pH decreased in the treatments was favored. The lactic acid microorganisms improve the organoleptic properties of the substrate on which they act (Alejo et al. cited by Quiñones et al., 2016). For this reason, most of the treatments applied presented a characteristic aroma similar to that of corn liquor as fermentation is the process that drives both the preparation of this drink as well as the experiments itself.
Figure 1 shows the behavior of the pH in each of the 36 treatments during the first evaluation stage (9 days). This graph serves as a general overview of the pH trends and helps to identify the treatments with desirable behavior. It is observed that most of the treatments start with a pH in the range of [4 - 7.8]; from day 8 the pH remained constant in most of the treatments, except for T1, T7, T13, and T19. In these, no molasses was added, which is the main carbon source for lactic acid bacteria, providing them with energy to efficiently perform their fermenting activity. A high volume of B-Lac without molasses causes a process of starvation, which leads to the consumption of the nutrients contained in the B-Lac itself. The opposite effect is observed in treatments with high concentrations of molasses, where the bacteria reach the stationary phase faster, before consuming the entire substrate, which induces a stoppage in the production of biomass, due to the saturation state of the substrate compared to the concentration of microorganisms (Ossa et al., 2010). Another effect that was detected in the treatments that do not have a source of molasses (T1, T7, T13, and T19) is that the pH increases showing chaotic tendencies. This pH increase causes a decrease in the growth of bacteria in a culture medium (Ortiz et al., 2008). A trend of fast pH decrease to a value close to 4 is distinguished in most of the treatments; this pH decrease was slower after the fourth day of evaluation.
Due to the large number of treatments that were shown in Figure 1, only those that met the criteria described by Peralta et al. (2016) were analyzed in detail in Figure 2. Therefore, 10 treatments that showed an accelerated pH decrease were selected, reaching values below 4.5 (in the range of 4.0 - 4.2) on the third day, absence of bad odor, and no formation of mold or yeast layers. Moreover, treatments that reached low pH values on the third day but did not show a significant variation were discarded (T31 and T32).
Figure 2 presents three bars (black, gray, and dark gray) for each treatment, which represent the pH reached on days 0, 3, and 4. Also, an orange bar is shown for each treatment, which indicates the variation of pH (delta) between day 3 (D3) and day 0 (D0) of evaluation (absolute value). The analysis of Figure 2 aims to select the best treatments for the second stage of evaluation. Thus, on day 3 it is observed that two treatments have the lowest pH values: T16 (4.08) and T33 (4.06), which were selected for the second stage of evaluation. Besides, two other treatments with low pH values were found on the third day: T22 (4.13) and T29 (4.11). However, only T22 was selected because its composition has a lower requirement of molasses (10 ml) compared to that of T29 (14 ml). This criterion is based on favoring lower-cost options for water treatment since greater quantities of molasses will translate into a higher cost of the process, especially if we aim to provide a big-scale and low-cost viable treatment option.
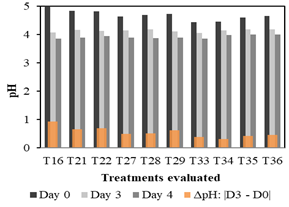
Figure 2 Treatments that reached pH values between 4 - 4.5 on the third day and showed significant pH variation during the first stage.
The pH decrease is attributed to the homofermentative metabolism possessed by lactic acid bacteria, in which mainly lactic acid is produced (Serna & Rodriguez, 2005). When lactic acid bacteria generate this acid, the pH of the fermented material drops to a level that inhibits the presence of putrefying bacteria (Garcés et al., 2004). This is expressed in the decrease of pH, an indicator that guarantees the absence of unwanted pathogens (Carrasco et al., 2002). It is relevant to mention that heterofermentative bacteria may have also been present in the mix, as they could have been living in the wastewater or the molasses; however, it is safe to assume that the medium was dominated by homofermentative bacteria as the inoculum (B-lac) was prepared to contain exclusively this type of lactic acid bacteria and there were no signs of significant gas formation, which is a clear indicator of the heterofermentative metabolism.
Second stage of evaluation of the 3 best treatments
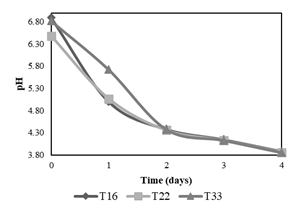
The second stage of experiments consisted of the evaluation of pH decrease applying treatments T16, T22, and T33 (in triplicate) during 4 days. Figure 3 shows that T33 has a slower pH decrease compared to that of T22 and T16 between the first and second day, therefore it is discarded. Between T16 and T22 no significant differences were noted in their fermenting activity, which leads to an analysis of the composition of each treatment. Both had the same quantity of molasses (10 ml), but T16 had a lower amount of B-Lac solution (6 ml) compared to T22 (10 ml), which is why T16 was chosen as the best treatment since it is preferable that the food source (molasses) exists in greater proportion than lactic acid bacteria to avoid problems of scarcity.
Microbiologic evaluation of the three best treatments
After 3 days of fermentation, the pathogen removal efficiency of T16 was evaluated by the most probable number method (MPN) to determine the presence of fecal coliform. This group of bacteria is used as a general indicator of water quality (García & Iannacone, 2014). Table 4 shows the removal of the fecal coliform bacteria in treatment T16. The enhancement of the coliform removal in T16 occurs because the efficient microorganisms inoculum have high populations of lactic acid bacteria (Lactobacillus and Pedicoccus), which produce lactic acid and other antimicrobial products as a consequence of the metabolism of carbohydrates (Tannock, 2004). One of the characteristics of this treatment is that it had enough substrate, which prevents the competition for nutrients amongst lactic acid bacteria and other present microorganisms. Corpas & Herrera (2012) observed that competition during the activation of their microbial mix, coupled with other factors, hindered its ability to deploy its arsenal for the inhibition of coliform populations. As shown in Table 2, the microbiological analysis of the B-Lac solution used indicates an absence of fecal and total coliforms (MPN.ml-1< 3), from which one can infer that the complete inactivation of the fecal coliforms in the wastewater treated with T16 was caused by the fermenting activity of Lactobacillussp. in the lactic acid microbial consortium, which is the predominant microorganism present. Another characteristic that would have favored the antagonistic behavior against lactic acid pathogens was the production of antimicrobial peptides and low molecular weight compounds such as bacteriocin class I (Kelly, 1998).
Table 4 Result of microbiological analysis of initial wastewater and waste treated with the T16.
| Microbiological parameter | Unit | Wastewater | Water treated with T16* |
|---|---|---|---|
| Fecal coliforms | MPN/100 ml | 9.65x10⁵ | < 3 |
| Note: < 3: absence of microorganisms. *: Result of the microbiological analysis in the laboratory. MPN: most probable number. |
Interaction of the B-lac and the molasses
Figure 4 presents the interaction effects of the B-lac (B0 to B10) and the molasses (M0 to M10) on the pH values on the third day of evaluation. This graph suggests that an interaction effect between the two factors studied exists, as the behavior of the pH cannot be explained by each variable alone. The ANOVA confirmed that there is a significant effect of the interaction, as well as that coming from the different molasses and B-lac concentrations (Table 5); the effect of the molasses levels seems to be the strongest. It is to note that although some treatments with a level of 0% of molasses or B-lac reach a pH of around 4.0 on the third day, they are significantly different from the mean of the other levels for each factor, as shown in Table 6 and Table 7. This supports the decision to discard such treatments. As for the three selected treatments (T16, T22, and T33), the pH values on the third day do not show a significant difference between them, according to Tukey’s test (p < 0.05).
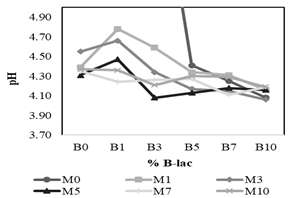
Figure 4 Interaction of molasses (M) and B-lac (B) concentrations on pH on the third day of evaluation.
Table 5 Analysis of Variance (ANOVA).
| Origin of variations | SS | df | MS | F cal | p-value | Sig. |
|---|---|---|---|---|---|---|
| Molasses | 27.53 | 5 | 5.506 | 20.95 | 7.326E-13 | yes |
| B-lac | 11.38 | 5 | 2.276 | 8.659 | 1.832E-06 | yes |
| Interaction | 27.82 | 25 | 1.113 | 4.234 | 8.241E-07 | yes |
| Error | 18.93 | 72 | 0.263 | |||
| Total | 85.67 | 107 | 0.801 | |||
| p < 0.05. |
Table 6 Tukey’s test for main effects of molasses concentrations.
| Levels | Diff. mean | mean crit. | lower | upper | p-value | |
|---|---|---|---|---|---|---|
| Group 1 | Group 2 | |||||
| 0% | 1% | 1.21 | 0.500 | 0.713 | 1.714 | 1.08E-05 |
| 0% | 3% | 1.32 | 0.500 | 0.820 | 1.820 | 7.51E-07 |
| 0% | 5% | 1.42 | 0.500 | 0.920 | 1.920 | 6.08E-08 |
| 0% | 7% | 1.41 | 0.500 | 0.905 | 1.905 | 8.87E-08 |
| 0% | 10% | 1.36 | 0.500 | 0.855 | 1.855 | 3.12E-07 |
| 1% | 3% | 0.11 | 0.500 | -0.394 | 0.607 | 9.89E+02 |
| 1% | 5% | 0.21 | 0.500 | -0.294 | 0.707 | 8.31E+02 |
| 1% | 7% | 0.19 | 0.500 | -0.309 | 0.692 | 8.71E+02 |
| 1% | 10% | 0.14 | 0.500 | -0.359 | 0.642 | 9.61E+02 |
| 3% | 5% | 0.10 | 0.500 | -0.400 | 0.600 | 9.92E+02 |
| 3% | 7% | 0.09 | 0.500 | -0.415 | 0.585 | 9.96E+02 |
| 3% | 10% | 0.04 | 0.500 | -0.465 | 0.535 | 1.00E+03 |
| 5% | 7% | 0.01 | 0.500 | -0.485 | 0.515 | 1.00E+03 |
| 5% | 10% | 0.06 | 0.500 | -0.435 | 0.565 | 9.99E+02 |
| 7% | 10% | 0.05 | 0.500 | -0.450 | 0.550 | 1.00E+03 |
| Comparisons that are significantly different (p < 0.05) are highlighted in grey. | ||||||
Table 7. Tukey’s test for main effects of B-lac concentrations.
| Levels | Diff. mean | mean crit. | lower | upper | p-value | |
|---|---|---|---|---|---|---|
| Group 1 | Group 2 | |||||
| 0% | 1% | 0.08 | 0.500 | -0.424 | 0.577 | 0.998 |
| 0% | 3% | 0.24 | 0.500 | -0.259 | 0.742 | 0.718 |
| 0% | 5% | 0.67 | 0.500 | 0.173 | 1.174 | 0.002 |
| 0% | 7% | 0.73 | 0.500 | 0.228 | 1.229 | 0.001 |
| 0% | 10% | 0.80 | 0.500 | 0.303 | 1.304 | 0.000 |
| 1% | 3% | 0.17 | 0.500 | -0.335 | 0.665 | 0.927 |
| 1% | 5% | 0.60 | 0.500 | 0.096 | 1.097 | 0.010 |
| 1% | 7% | 0.65 | 0.500 | 0.151 | 1.152 | 0.004 |
| 1% | 10% | 0.73 | 0.500 | 0.226 | 1.227 | 0.001 |
| 3% | 5% | 0.43 | 0.500 | -0.069 | 0.932 | 0.130 |
| 3% | 7% | 0.49 | 0.500 | -0.014 | 0.987 | 0.061 |
| 3% | 10% | 0.56 | 0.500 | 0.061 | 1.062 | 0.019 |
| 5% | 7% | 0.05 | 0.500 | -0.445 | 0.555 | 1.000 |
| 5% | 10% | 0.13 | 0.500 | -0.370 | 0.630 | 0.973 |
| 7% | 10% | 0.07 | 0.500 | -0.425 | 0.575 | 0.998 |
| Comparisons that are significantly different (p < 0.05) are highlighted in grey. | ||||||
Conclusions
This study showed that wastewater treatments with lactic acid bacteria tend to reach a stable pH from the fourth day on, generally achieving values below 5.0, which favor the inactivation of pathogenic microorganisms. The short periods in which the optimum pH values are achieved are a desirable characteristic as it shortens the total treatment length, which represents a reduction in costs.
In conclusion, the best result for the complete elimination of fecal coliforms in the wastewater samples from the sanitary facilities in the eco-touristic circuit Lomas de Lucumo was obtained with treatment T16. This treatment consisted of 6 ml of B-Lac and 10 ml of molasses to treat 200 ml of water in a period of 3 days; results show that the effect of the interaction between molasses a B-lac exists and is significant. The selected treatment reached a pH of 4.08 in the first evaluation stage and 4.15 in the second stage, achieving a 100% removal efficiency of fecal coliform bacteria in a narrow time frame. T16 could serve as an alternative remediation/treatment process for domestic wastewater since it supposes a low (but effective) cost of inputs due to the moderate use of the carbon source for the bacteria (molasses). However, to implement this system at a pilot scale, it is suggested that future studies carry out a comprehensive evaluation of the B-Lac efficiency to remove parameters such as Biological Oxygen Demand (BOD) and Chemical Oxygen Demand (COD).

