


 Inglês (pdf)
 Artigo em XML
 Referências do artigo
 Enviar este artigo por email
 Citado por SciELO
  Similares em
SciELO
Similares em
SciELO  uBio
uBio 
 Permalink
Introduction
Seasonal patterns among living organisms are normally aligned with the best environmental conditions in the habitat to assure that energy demanding activities (reproduction, feeding, hibernation, flowering, etc.) take place during the best favourable conditions (Visser & Both, 2005). This temporal dimension of natural history is called phenology (Forrest & Miller-Rushing, 2010). There are different interactions between abiotic parameters and phenology depending on the latitudinal location. In temperate regions, phenology is more influenced by temperature and/or photoperiodism (Edge et al., 2017), whereas in tropical latitudes, precipitation is more likely to play a significant role in phenology than temperature (Forrest & Miller-Rushing, 2010; Junk & Piedade, 2011). For fresh water organisms, biological processes are more influenced by the seasonal timing imposed by hydrological cycles such as the dry and wet season (Junk & Piedade, 2011). To explain the relation between hydrological cycle and biological processes in Amazon Basin, Junk et al. (1989) proposed the River Flood Pulse Concept, that is based on hydrological considerations, which considers the river and its floodplains as an indivisible unit. During an annual flood, floodplains oscillate between terrestrial and aquatic environments, with a degree of connection with the main stem depending on water level. The complex relationship between hydrological cycles and biological processes requires the understanding of hydrological functioning in the local floodplain rivers. Unfortunately, in-situ monitoring in remote areas is uncommon, especially in protected areas far from human influence. Moreover, main and tributary rivers in a floodplain become spatially connected during periods of higher water level and potential synchronicity between small tributaries and major rivers must be assessed. In this context, spatial altimetry is an important tool to assess inland waters hydrology (Maillard & Calmant, 2013). Satellite altimetry measurements enable hydrologists to measure basin-wide of discharge, storage and water level, which are much easier than monitoring changes from in situ gauge networks. Water level time series with decimeter accuracy were obtained for Amazonian wetlands (Getirana et al., 2009; Silva et al., 2010). Turtles’ species from the Podocnemis genus offer an interesting opportunity to study the complex relationship between hydrology and biological process, such as reproductive phenology, given that oviposition and incubation take advantage of the sandbanks appearing in the point bar areas during the dry season (Soini, 1996). Although oviposition and its linkage with the dry season is widely documented (Soini & Cóppula, 1980; Carvajal et al., 2011; Yapu-Alcázar et al., 2018), few studies identify particular river stages or water level thresholds related to the onset of, and peaks in oviposition. Unravelling the role of hydrology on biotic processes is crucial to develop correct strategies to management and conservation, particularly in Podocnemis sp. which provides an important source of protein for human population during the dry season (Conway-Gómez, 2008; Pantoja-Lima et al., 2014) and improves the economic well-being in Peru (Gockel & Gray, 2009; Harju et al., 2018).
The aim of this study was to use spatial altimetry to evaluate the potential hydrological synchronicity between the river’s main stem and its floodplain, and determine the relationship between water level variability in wetlands with Podocnemis unifilisTroschel, 1848 oviposition timing variations.
Methods
Study Area
This study was conducted in the Peruvian Amazon floodplains, focusing in two convergent river-floodplain systems: the Ucayali River and its plain tributary Pacaya, and the Marañon River and its plain tributary Samiria. This area is located at the Pacaya-Samiria National Reserve (PSNR) between 4°26'15"S 73°25'57"W and 6°21'26"S 75°32'01"W (Figure 1), where since 1979, due to repopulation efforts, the P. unifilis is currently abundant in places where management programs have been implemented. Although P. unifilis is currently categorized as vulnerable by national legislation, the recovery of the species is evident in the basins where it has been managed sustainably. The management and conservation of P. unifilis, in the last two decades has been considered by experts as one of the most successful experiences in the recovery of endangered species. The number of hatchlings released has been increasing continuously and significantly since 1995. The participation of local communities in the conservation program is of great importance, demonstrating that the model of productive and commercial conservation, with clear benefits for local populations, has been a success.
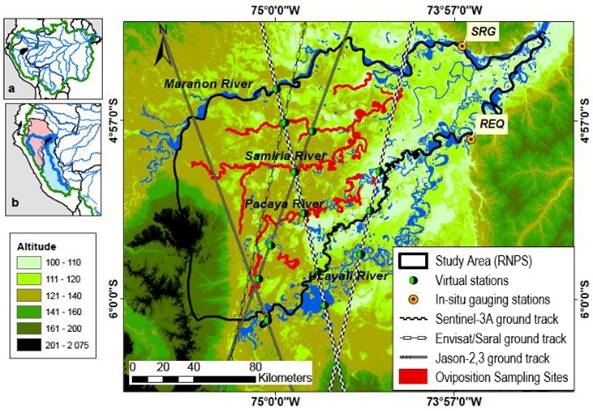
Figure 1 Study area with satellite trajectories location of virtual stations in situ water level gauge stations (SRG, REQ) in the Ucayali and Marañon rivers, and oviposition sampling areas. (Projection: GCS WGS 84 UTM 18S). (a) Amazon Basin in green border with the study area Pacaya Samiria National Reserve in black. (b) Peruvian Amazon Basin with the two major basins: Marañon Basin in pink with mainstem Marañon River and Ucayali Basin in blue with Ucayali River mainstem.
Annual temperature ranges between 20.1 and 33.1 °C (Rodriguez et al., 1995). In the plain, precipitation reaches values of 2 744 mm·yr-1 in the Ucayali at Requena gauge station (REQ, 5°02'28" S, 73°50'24" W) (HYBAM, 2018), and 2 817 mm·yr-1 in the Marañon at Santa Rita de Castilla meteorological station (4°30'48" S, 73°54'24" W). The dry season occurs between June and the first days of October (Soini & de Soini, 1986).
Hydrology Data Sources
To assess water level in small rivers, we made use of spatial altimetry techniques retrieving data from different satellite missions. A set of altimetry-derived water level data retrieved from virtual stations in inner rivers (Pacaya and Samiria) vs. in situ hydrological data (2000-2017) in the major rivers (Ucayali and Maranon), was used to assess if behaviour in the inner rivers was similar to major rivers. In situ water level data were retrieved from the Critical Zone Observatory (CZO) - HYBAM database (HYBAM, 2018). Requena water level gauge station (REQ) is located in the Ucayali River downstream the river mouth of Pacaya River, whereas San Regis (SRG) is located in Marañon River downstream Samiria River mouth (Figure 1). Altimetry-derived water level data were obtained from different space agencies: Collecte Localisation Satellites (CLS, 2018) for Jason-2, Copernicus Open Access Hub de l'ESA (European Spatial Agency) (ESA, (2018) for Sentinel-3A, Satellite Data and Services Center (AVISO+, (2018) for Saral and Jason-3, Center for Topographic studies of the Ocean and Hydrosphere (CTOH, (2018) for ENVISAT. Three families of altimetry satellites (Figure 1) were used to define a set of virtual stations: Jason-2 and Jason-3 with a return cycle of 10 days, ENVISAT and Saral with a cycle of 35 days and Sentinel-3A with a return cycle of 27 days. A total of four virtual stations for Pacaya River, and seven for Samiria River, were spatially distributed so that spatial representativeness was covered (Table 1). For Samiria River, five out of the seven virtual stations happened to be located close together at the same geographical point (S3A331Sami03, env422sami03, env551sami03, srl422sami03, srl551sami03). This “multistation” was used to obtain temporal representativeness (Aug 2002 - May 2018). More detailed information on altimetry can be found in Fu & Cazenave (2001).
Table 1 Virtual stations from different altimetric satellites and geographical coordinates used in this study
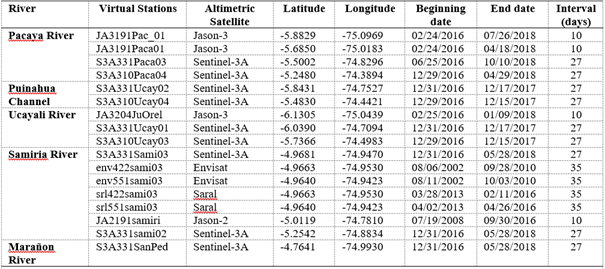
Data was retrieved between the beginning and end dates, with different time intervals
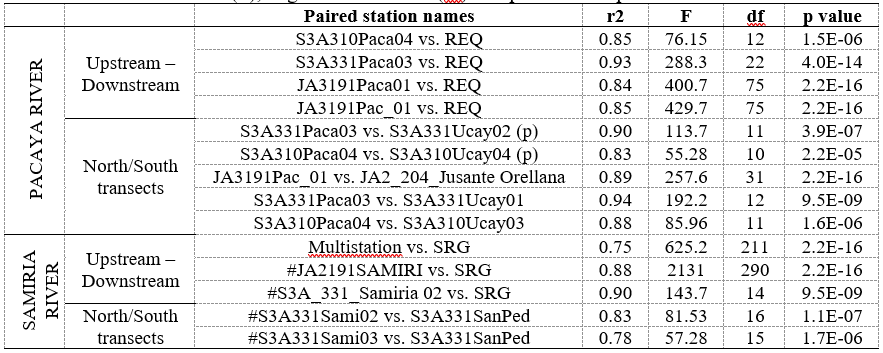
Correlation graphs, with correlation coefficients (r2), were constructed using the daily water level z-scored transformed values to account for normality and comparativeness. Firstly, an upstream-downstream spatial comparison where each virtual station in the tributary inner river was compared with the in-situ gauge station downstream in the major river. Secondly, since rivers in our study area run from west to east, comparisons between virtual stations in north/south transects (one in the inner river vs. one in the major river) were carried out to assess the influence of water lateral exchanges between the major and the inner river on water level variability. Selection of pairs was subjected to the conditions they were located either in the same satellite pathway or at similar geographical longitudinal location. Fisher statistics (F), degrees of freedom (df) and p values were also calculated.
Oviposition data sources of the freshwater turtle Podocnemis unifilis
P. unifilis is a medium sized freshwater turtle with a mean weight of 8.5 kg and a carapace length between 33 and 48 cm. The species reaches sexual maturity at the age of 5 or 6 years, laying eggs between July and August in our study area. The incubation time in Peru is between 55-70 days and the mean clutch size is 34.5 (Soini & Cóppula, 1980; Soini & de Soini, 1986; Soini, 1996).
Daily oviposition historical data (2003-2012) of P. unifilis were provided by the natural resource management programme running at the PSNR (more information in Harju et al., 2018). Every record corresponds to a single nest, for which the oviposition date, number of eggs, habitat substrate type, river margin and local name of the place is recorded. A set of more than 53 795 nest records were checked for data quality and reliability, and then aggregated per day to obtain daily amount of oviposition. These data were merged with the daily water level, discharge and precipitation data above mentioned and were treated using Fisher statistic. The collect effort (CE) that is the number of nests per kilometer per person was also estimated.
Oviposition data analysis
To assess the onset of oviposition for the population, we identified the Julian day at which 5% of the total nesting activity was complete (Prodon et al., 2017; Wheeler et al., 2018). Using a 5% threshold assures that oviposition onset reflects the population level oviposition behaviour, and is not affected by particular individuals (Palmer et al., 2017). Median oviposition date was used as a thick mark against which a measure of deviance (shifts) was calculated using the absolute deviation around the median. This method has been suggested when the purpose is to detect outliers or extreme values, in this case called “extreme biological responses” (Palmer et al., 2017). The absolute deviation around the mean is defined as the median value plus two median absolute deviations (MAD). MAD is the median of the absolute differences between each data and the sample median, multiplied by a factor “b” (Formula 1).
 Formula 1
Where:
xi is the observation;
Mj(xj) is the sample median value;
Mi is the median of the absolute deviation.
Factor “b” is a constant associated to the assumption of normality and takes the value of 1.4826 (Leys et al., 2013). For this work, normality was tested for all oviposition starting dates converted as Julian days.
Results
Hydrological analysis
Water levels for REQ and SRG stations are presented in Figure 2, from January 2000 until December 2017. The amplitude of the water level was larger during this period at REQ station (Ucayali) than at SRG (Marañon) (10 ± 0.5 m for REQ, 8.5 ± 0.5 m for SRG). The mean annual water level was 95 meters above sea level (masl) for REQ and 93 masl for SRG. The highest amplitude ranges were registered during 2011 and 2012 (11.9 and 11.4 for REQ, 10.4 and 10.5 for SRG, respectively). Water levels reached the lowest values for 2005 (88.6 masl for REQ and 86.9 masl for SRG) and 2010 (87.7 masl for REQ and 86.7 masl for SRG). Highest values were registered for SRG during 2012 (98.1 masl) and for REQ during 2000 (100.3 masl) and 2012 (100.0 masl). When comparing altimetry-derived data with in situ water level measures, a synchronic behaviour was found along time.
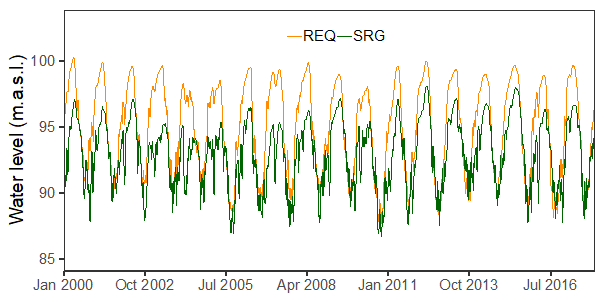
Figure 2 Water level time series for REQ (Ucayali River) and SRG (Maranon River) gauge stations from 2000 to 2017.
In Figure 3, altimetry-derived data from Jason-2 in Samiria River follows the same temporal variation of SRG located 210 km far away from the virtual station in the Marañon Basin. Similar results were obtained for virtual station S3A331_Samiria02 and the Multistation in Samiria River located upstream from SRG, with R-squared values of 0.9 and 0.75, respectively (Table 2). Synchronic behaviour was also found for Ucayali Basin between the four virtual stations in Pacaya river vs. REQ in situ gauging station in Ucayali River. These virtual stations (JA3191Pac_01, JA3191Paca01, S3A331Paca03, S3A310Paca04) obtained correlation values ranging between 0.84-0.93 (Table 2).
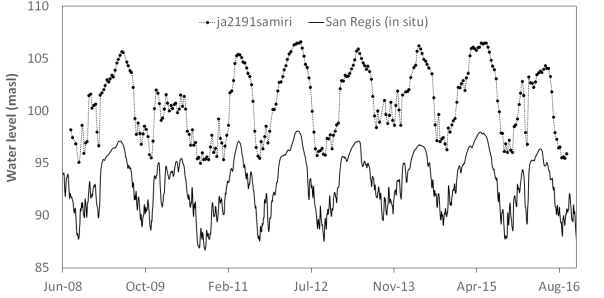
Figure 3 Temporal series of water level for SRG in-situ gauge station (black line) and water level obtained from virtual station JA2191samiri (Jason 2 pathway 191) in Samiria River (dashed line)
The set of north/south transects also showed synchronic behaviour for Ucayali and Marañon basins. Only one transect from Sentinel 3 was available for Marañon Basin, with correlation coefficient values of 0.78 and 083 (Table 2). For Ucayali Basin three transects were available, two Sentinel 3 tracks and one Jason 2 tracks. Therefore, comparisons were made between Pacaya and Puinahua Channel, and Pacaya vs. Ucayali River. These comparisons also showed water level synchronicity between virtual stations with R squared values ranging from 0.83 to 0.94.
Oviposition analysis
During 10 years of oviposition data (2003 - 2012), female P. unifilis nested in this area between June 22th and September 30th with mean oviposition duration of 61.5 days ± 11.7 SD for both basins (Table 3). Oviposition onset did not occur below 89 masl or above 96 masl with a constant preference of water level values around 92-93 masl (Figure 4). Across both basins and along the years the 5% of the total oviposition activity occurs at July 23th (Julian day 204) as median oviposition starting date and a mean water level of 91.8 masl ± 0.8 SD. Oviposition starting dates showed a normal distribution (W = 0.9649, p: 0.497) and hence, median absolute deviation (MAD) was set to 6.7 days. Therefore, extreme biological responses (extreme shifts towards early or late oviposition) are the oviposition starting dates 13 days far from the median oviposition date.
Table 3 Dates of oviposition at 5% with its correspondent water levels registered for the same day in REQ for Pacaya Basin and SRG for Samiria Basin. CE stands for collecting effort (nests per kilometer per person)
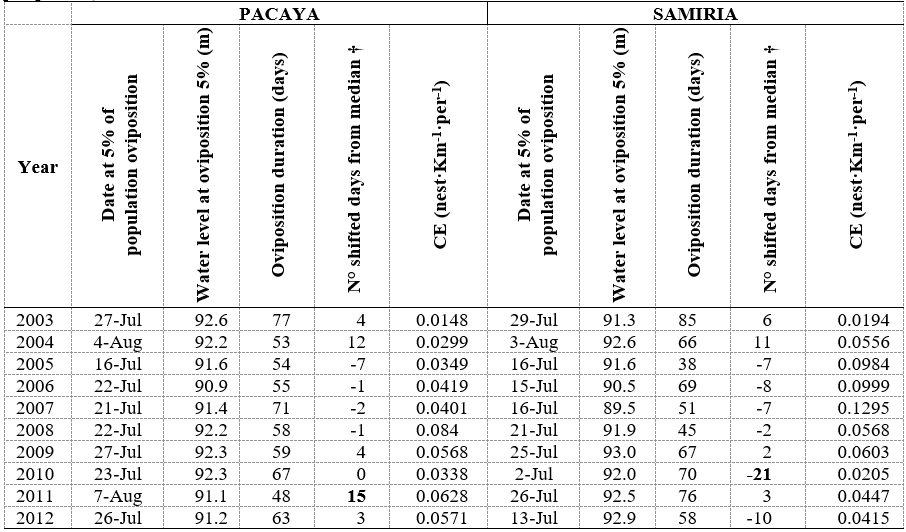
† Positive values accounts for the number of days later than July 23th, while negative values for days earlier than July 23th. Highlighted values exceed two median absolute deviations
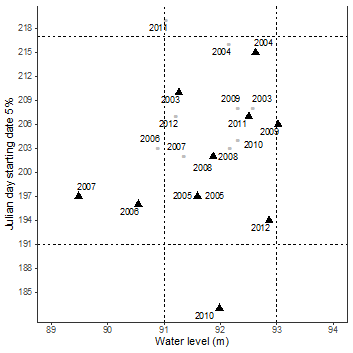
Figure 4 Water level values during the oviposition starting dates at which 5% of the total nesting activity is complete (Julian days). Pacaya Basin in grey and Samiria Basin in black. Vertical dashed lines represent one standard deviation for water level and horizontal dashed lines two median absolute deviations (12 days) for oviposition dates. Median oviposition date July 23th (Julian day 204).
For Pacaya Basin years with an early start were between 2005 and 2008, and late start were registered for 2003, 2004, 2009, 2011, 2012. In Samiria Basin, years with an early start were 2005 - 2010, 2012 and a later start was registered for 2003, 2004 and 2009. Extreme biological responses were registered for 2011 in Pacaya Basin (15 days later), and 2010 for Samiria Basin (21 days earlier). A marginal extreme value of 12 days later was registered for Pacaya Basin during 2004.
Discussion
River floodplain hydrological functioning
Hydrological synchronicity in the study area was tested using altimetry-derived water level from virtual stations vs. in-situ water level gauge station. Synchronic hydrological functioning was found between tributaries in the floodplain, and Ucayali and Marañon rivers (Figure 3). This synchronicity might reflect a quasi-permanent water lateral exchange. Similar hydrological behaviour was observed in other Amazonian floodplain systems (Bonnet et al., 2008; Alsdorf et al., 2010; Moreira‐Turcq et al., 2013), where contribution from the main river channel to the floodplain is between 77 and 93%; while local runoff, direct precipitation and groundwater contributes with the remaining percentage (Alsdorf et al., 2010; Rudorff et al., 2014). Furthermore, the water exchanges between the floodplain and the main river are mainly controlled by the water levels in the main channel. Upstream-downstream comparisons in the upper Amazon Basin are especially relevant, since the majority of studies using spatial altimetry have been carried out in the lower and middle Amazon Basin, where channel width is between 3 - 7 km. Here, channel widths range from 1 - 2.5 km for Marañon and between 0.5 - 1.3 km for Ucayali River, and Pacaya and Samiria tributaries widths ranges between 15 m (upper basin) and 130 m (river mouth, satellite image measurements). Lateral exchange influences not only water fluxes but also sediment and organic matter transportation (Moreira‐Turcq et al., 2013). Sediment input from the main river stem during the high-water periods, influences grain size distribution, dimensions and morphology of oviposition areas in the inner rivers during the dry season (Ferreira Júnior & Castro, 2003). This interaction is important for the turtle species under study since oviposition areas may be affected when extreme changes in water level and discharge occur/or are absent.
Relation hydrology-oviposition and extreme hydrological events
In our study, oviposition occurred at a mean water level value of 92 masl ± 0.8 SD (Figure 4 and Table 3) with a mean oviposition duration of 61.5 days ± 11.7 SD (Table 3). A comparison between the Julian day at which water level reaches 92 masl with the Julian day of oviposition onset at 5% was carried out (Figure 5). Points located very close to a 1:1 line illustrate the relationship, whereas points above this line but below the critical value of July 23th (Julian day 204) are the years with early dry season onset where turtle population made an attempt to follow these early shifts but did not succeed to be close to the 1:1 line. On the other hand, points located below the 1:1 line and later than July 23th are years with late dry season onset. In this case, points below the 1:1 reflect the attempts of turtle populations to follow these shifts. Within these shifts, there are extreme biological events that cause values to exceed the median oviposition date (July 23th) plus two median absolute deviations (13 days). Those are 2011 and a marginal value for 2004 for Pacaya Basin (15 and 12 days later respectively), and 2010 for Samiria Basin with 21 days earlier.
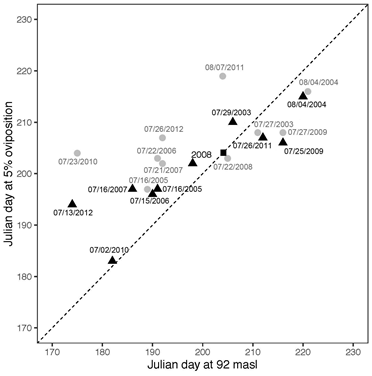
Figure 5 Julian day at which the 92 masl critical water level value occurs versus the Julian day of oviposition onset at 5% of nesting activity. Pacaya Basin in grey circles and Samiria Basin in black triangles. The black square on the line represents the Julian day 204.
P. unifilis shares oviposition habitats with P. expansa the largest fresh water turtle in Amazonian rivers. While P. unifilis starts oviposition earlier and lay eggs in the middle and lower parts of the point bar, P. expansa starts laying eggs later using the upper areas (Soini & de Soini, 1986); thus, overlap in nest placement is rare (Ferreira Júnior & Castro, 2003). Other authors find that height of nest above water level is an important variable among all species of Podocnemis genus (Escalona & Fa, 1998; Pezzutti & Vogt, 1999). Both turtles have temperature-dependent sex determination (Ferreira & Castro, 2010), pointing to the importance of nest site on the resulting sex ratios and species preservation. Where incubation success is highly determined by the ambient temperature. (Rodrigues & Lima-Ribeiro). The river dynamics also significantly affect the hatching success (Leao et al., 2019).
In general, oviposition starting dates have followed consistently early and late start of the dry season. Years with an early beginning of the dry season were 2005, 2006 and 2007 in Tamshiyacu (Ronchail et al., 2018), and shifts towards early oviposition were identified from 2005 to 2008 for both basins. Samiria Basin registered two more years (2010 and 2012) with shifts to earlier oviposition (21 and 10 days, respectively). Furthermore, our time series contains two extreme dry years 2005 and 2010 (Espinoza et al., 2011), where early oviposition starting dates occurred. This illustrates a consistent biological response facing not only dry years, but also early beginning of the dry season. Literature refers similar shifts towards earlier oviposition onset for 1988 (Soini & Correa, 1989), a year with an early beginning of the dry season (Ronchail et al., 2018). Years with a late beginning of the dry season were 2004 and 2009 (Ronchail et al., 2018) and in this study shifts towards later oviposition onset were 2003, 2004, 2009 and 2011 for both basins. Year 2011 showed the most important delay of 16 days for Pacaya Basin (Figure 4). This year has been catalogued as a transitional year between a dry (2010) and a flooded (2012) year (Espinoza et al., 2012), where water level values peaked up to almost the same values obtained for 2012. As a consequence, the water receding process took longer reaching the critical value of 92 masl by the end of July, thus in accordance with oviposition onset delay. Although, 2011 was not an extreme year, a focus on the dry season explains this result.
Although these temporal shifts may be considered a good trait facing extreme events, extreme shifts towards late oviposition could also pose a threat for the population. Since incubation period requires a time window of 55 - 70 days, extreme delays in oviposition onset may be risky when the next rainy season starts earlier. Considering that mean oviposition duration for our database was 61.5 days ± 11.7 SD (n = 53 795 nests), 15 days of delay during 2011 represents between 22-32% of the oviposition period, thus increasing inundation risk at the end of incubation. Nest loss via inundation reached between 28 - 50% during 1980 and 1982, in the same location of this study (Soini & Soini, 1982). It has been suggested that if extreme floods return with a frequency of less than 10 years, population decline is likely to occur in few decades (Véliz Rosas, 2012). For P. expansa in Trombetas River (Brazil) an increase of 137 cm of water height would result in 50% of mortality (Eisemberg et al., 2016). Additionally, when oviposition onset for P. unifilis is delayed, increased competition for space may occur due to an overlap in oviposition time with P. expansa which breeds later (Soini & de Soini, 1986).
Extreme hydrological events can also affect habitat quality. This was the case for 2010 (oviposition started 21 days earlier for Samiria Basin) when park rangers in the study area referred that P. unifilis were laying eggs in sites covered with vegetation. Vegetation has shading effects which potentially cause poor embryological development or bias in sex ratios (Soini & Soini, 1982; Janzen, 1994). Morphology, topography and grain size in the beach are also important for nest site selection, and erosion during the flood period is an important driver shaping breeding areas with good habitat quality (Ferreira Júnior & Castro, 2003; Ferreira & Castro, 2010). Natural and anthropogenic impacts on nesting areas can negatively affect the reproductive rate of populations (Quintana Garcia, 2018). For conservation purposes, it is important to protect the nesting beaches where the species nests during the dry season, but also the flooded forest zones that are heavily used during the rainy season. (De Leão et al., 2019). If the habitat offers low quality areas, productivity can also be affected. In fact, during 2010 the numbers of nests per km and per person (CE) were very low (Table 3). In this water level time series, the frequency of extreme events is higher during the last 20 years and we can identify constant shifts on the direction of change from drought to flooding and vice versa (eg. an unprecedentedly abrupt transition from the extreme drought in September 2010 to one of the four highest discharges in April 2011) (Espinoza et al., 2011; 2012). Several studies have shown an increase in the frequency and intensity of extreme hydrological events, such as droughts and floods, in the Amazon Basin during the last decades (Marengo & Espinoza, 2016). We can expect that in the future, these extreme events will increase even more, as is already being observed, and that organisms that have their development directly dependent on environmental conditions (e.g. temperature and water level) will be more likely to be affected in a way that may be critical for the preservation of the species. P. unifilis is known for its nest-site fidelity but under adverse environmental conditions a migration to other nesting sites can be expected (Naveda-Rodriguez et al., 2018). Winter et al. (2016) demonstrated in an extensive review paper that climate change has a strong impact on reptile and amphibian population declines.
Conclusions
This work shows the existence of a synchronous hydrological functioning between the inner rivers (Pacaya and Samiria) and the major rivers (Ucayali and Marañon). Consequently, this allows us to use the in situ data set as a proxy of the hydrological behaviour of small rivers. Furthermore, Podocnemis unifilis start laying eggs around 92 masl, show oviposition responses in accordance with dry season onset changes, and extreme biological responses for at least one extreme dry year (2010).
Synchronicity and water lateral exchange in the floodplains are topics which are not currently included in the environmental impact assessments of large infrastructure projects. Currently, dam construction in the upper Marañon Basin, and navigability in the Amazon waterway are major projects fostered by the government. Possible impacts like long-distance discharge regulation, river’s course modifications and removal of bed sediments, have not been discussed in relation to river synchronicity found in this work and the subsequent biological impacts. In that sense, research on this topic and its relation with biota, becomes important to assess future impacts in one of the most important Peruvian wetlands and Ramsar site.

