


 Espanhol (pdf)
 Artigo em XML
 Referências do artigo
 Enviar este artigo por email
 Citado por SciELO
  Similares em
SciELO
Similares em
SciELO  uBio
uBio 
 Permalink
Introduction
Natural Protected Areas (NPA) have emerged as a response to different forms of human intervention that cause damage to different natural ecosystems existing in different global contexts. This response includes policies that provide goods and services which promote, among others, the conservation of such ecosystems.
In Peru, there are 76 NPA protected by the State, which are responsibility of the Ministry of Environment (MINAM) and are conserved by the National Service of Natural Protected Areas by the State (SERNANP). To ensure the financial sustainability of these NPA, mechanisms are required that can reinforce their financial base and ensure stable and adequate resources, as highlighted by MINAM (2009); for this, an adequate economic valuation of their contribution to the country's natural and cultural heritage is fundamental, which ultimately would allow estimating the value of the financial base required for said NPA sustainability.
Choquequirao is a Regional Conservation Area (RCA), a type of NPA located in Cusco-Peru, with an extension of 103 814.4 ha. It has an archaeological and tourist complex that include a political and religious center, a system of fountains and canals with aqueducts, as well as a group of doorways. Its condition of RCA contributes to conservation of ecosystems through the protection of humid montane forests, seasonally dry forests, native forests, and puna ecosystems (Ortiz de Orue, 2020).
Cusco's main tourist attraction is the Historic Sanctuary of Machu Picchu, which accounts for 98% of the tourism sector's income in Peru. In contrast, the RCA-Choquequirao (RCA-Ch) is a relatively new tourist product that has rich natural and cultural resources similar to Machu Picchu; however, it has been slow to establish itself in the tourism market due to problems with tourist services. These issues include inadequate facilities at the archaeological site, insecure pedestrian access to the area, and hazards such as landslides and rocks on the routes leading to the RCA-Ch.
In terms of biodiversity, the RCA-Ch has a high variability of wild fauna and flora . However, according to the RCA-Ch Master Plan 2014-2018, prepared by the Regional Government of Cusco (GORECUSCO, 2013), major threats to biodiversity have been identified, coming from forest and grassland fires, pollution from waste generated by tourism and external geodynamics; also, medium threats such as the expansion of the agricultural frontier, extraction of timber species for firewood; finally, low threats related to the extraction of orchids and other ornamental plants.
Due to the issues above mentioned, the number of tourists visiting the RCA-Ch has decreased in recent years. From 2005 to 2010, tourism activity grew at a rate of 3.16%, but since 2011, there has been a decrease in tourist flow, reaching a rate of 0.66% (Ortiz de Orue, 2020). The financial unsustainability of the RCA-Ch has been linked to these problems. To address this limitation, it is essential to assess whether the current admission fees are adequate to create a fund that contributes to the financial sustainability of the NPA.
Economic valuation could be helpful for properly assessing an admission fee; it involves a range of techniques that enable the quantification of changes in the quantity or quality of an environmental good or service, with a focus on its impact on social welfare. By monetizing such changes, market failures can be addressed and an economic value can be assigned to goods or services that lack a formal market.
Conservation and tourism in the RCA-Ch are ultimately scarce goods and services terms of that are constantly deteriorating (in quality and quantity), resulting in a decrease in the influx of tourists to the archaeological site. The survey presents visitors with four scenarios for improving services, outlining the attributes of each improvement along with their respective costs.
Studies on economic valuation of ecosystem goods and services in NPA have mainly used two techniques: the travel cost or the contingent valuation methods. However, the contingent valuation method has gained more relevance as it estimates the non-use value of natural spaces (Mitchell & Carson, 1989). Mogas & Riera (2001) state that the main advantage of the contingent valuation method is its ability to evaluate preservation values and a variety of simulated situations. However, a limitation is that it cannot break down the individual value assigned to a resource into the sum of values of its most relevant attributes. To address this limitation, the Conjoint Analysis (CA) approach has been used in this research study as an alternative that allows for such decomposition.
Conjoint Analysis (CA) is based on the economic theory of demand (Lancaster, 1966), which posits that consumers stems from the attributes of goods or services rather than the goods or services themselves. The objective of CA is to derive an indirect utility function based on the attributes that define a particular good or service.
In this research study, the contingent ranking method of CA was employed. This approach involves asking consumers to rank a set of options according to their preferences. The premise of CA is that by presenting respondents with various options, it is possible to infer their preferences (Kuriyama, 1998; Mogas & Riera, 2001; Riera et al., 2012). These options consist of different combinations of characteristics or attributes and their associated costs.
The scope of this study is to estimate the social benefits resulting from policies aimed at improving the conservation of biodiversity and tourism infrastructure in RCA-Ch, as well as combining both actions. The main goal was to determine the willingness to pay (WTP) of visitors to RCA-Ch to estimate the value of a fund that can be utilized for proactive enhancements in conservation efforts and investment in tourism within the NPA.
Materials and methods
The Conjoint Analysis (CA) approach
CA is a versatile approach to evaluate consumer preferences for products and services; the method is based on the concept of utility, which measures overall preference . Goods or services with higher utility are more attractive and have a greater chance of being chosen. By measuring this latent utility, the relative significance of each attribute level in the ultimate purchasing decision can be quantified (Picón et al., 2006).
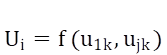
The CA appraise comprises a set of techniques that seek to replace the subjective consumer responses with parameters that estimate the utility of each attribute level in the preference manifested by them (Green & Rao, 1971). The CA is represented in Formula 1.
 Formula 1
Where Ui represents the utility value assigned by individual "i" to a product based on the combination of its attributes, with the highest value indicating the preferred choice among a set of options. The discrete choice model of CA allows for studying user preferences for choosing an alternative other than the status quo. The option ordering version shows how individuals rank the different scenarios presented based on ratings. Once the options and attributes are established, variations in these factors provide insights into (i) the indirect utility of an average individual for each option, (ii) the individual compensatory variations for each improvement option, and (iii) compensatory variation resulting from simultaneous improvement in options.
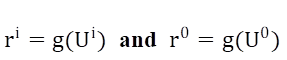
It is implicitly assumed that there is a function that explains the valuation that individuals make of the options (Formula 2).
 Formula 2
Where ri depends on the utility (U) that the individual i perceives for each one of the j options; ri and r0 represent individual valuations as function of utilities for a given individual versus the status quo. The function g(.) represents a monotonic transformation of the utility in the decision assessment that individual makes of each one of the options, such that Ui > U0 if and only if ri > r0.
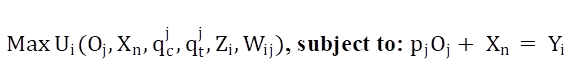
If the utility function of an individual is maximized, then it will be possible to explain how the demand behaves for each of the options; or it will be possible to explain how the characteristics of the individuals and the attributes of the options explain their ordering (Formula 3).
 Formula 3
Where:
Oj represents the alternatives available for each individual "i".
Xn represents other goods and services that generate utility.
qc j is a vector with characteristics related to an attribute "c".
qt j is a vector with features related to another attribute “t”.
Zi is a vector of characteristics of individuals.
Wij are the combined variables, characteristics and attributes of the individuals.
pj represents the cost of alternatives and options.
Yi is a vector of income for each of the individuals “i”.
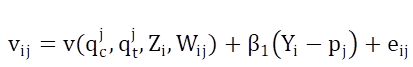
If in Formula 3, the restriction is replaced in the objective function, it is obtained the indirect demand function (vij in the Formula 4), which does not depend on the "quantities" of the options but on their attributes (Dow, 1999).
 Formula 4
Where the indicators in Formula 4 can be identified based on the denominations expressed in Formula 3.
The term “Individual Compensating Variation” (CV) represents the value (amount of money), that must be removed from a household so that, with the proposed improvements in the attributes, such household remains at its initial utility level. The CV arises from the indifference condition, as depicted in Formula 5.
 Formula 5
Where the indicators in Formula 5 can also be identified based on the definitions of indicators in Formula 3.
According to Formula 5, once the compensating variation has been subtracted from the income of individual i, then its indirect utility for alternative j (vij) must be equal to the indirect utility of said individual in the initial state (vi0).
Specification and estimation of the operational model
To calculate the WTP, in this study it was employed a theoretical Random Utility Model, within the framework of the Conjoint Analysis Approach in its contingent ranking version. The procedure assumes that different attribute levels can offset each other, resulting in different products with similar overall utility for consumers. The econometric operational model used is the Ordered Multinomial Logit (MOML), which defines the marginal utilities for changes or improvements in the characteristics of ecosystem services.
The rationality of the decision-making process can be analyzed from the perspective of the random utility approach, which examines the utility that individual i obtains from alternative j. Building upon Formula 1, the random utility can be represented by the following expression:
 Formula 6
Where Vij is the observable component of the total utility, depends on characteristics of the options and also the interviewed; εij is the unobservable part (or the stochastic component).
The individual will choose alternative j if and only if Uij > Uik , for k ≠ j. Then, the probability that individual i chooses alternative j can be expressed as Formula 7.
 Formula 7
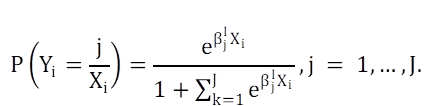
Under the assumption that errors (εio,.… εij) are independently distributed, with a “Gumbel” distribution of the extreme value type, the so-called “McFadden” conditional Logit is given by Formula 8.
 Formula 8
Where the term Vij is the deterministic component of utility expressed as a function of the characteristics of individual i and option j, it is expressed as Vij = βj Ι Xi (Kuriyama, 1998); the term βj I is the transpose of vector of parameters associated with Xi .
In order to solve the identification problem, the Formula 8 requires incorporation of a restriction, consisting of expressing the probabilities of choosing each alternative as a function of the difference in utilities, with respect to the one taken as reference: j = 0. In this way, the Logit model derived from the random utility approach is finally transformed into a model MOML, with the following specification in Formula 9a.
 Formula 9a
The Formula 9a represents the indirect utility, where:
"e" is base of the natural logarithms (approximately 2.71828).
βj ΙXi is the transformed utility for individual i and category j.
J is the total number of categories in the ordered outcome.
Yi is the chosen category for individual i.
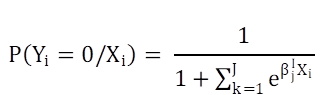
The baseline probability, which serves as reference for the probability of the Formula 9a, is expressed according to Formula 9b.
 Formula 9b
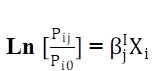
The operational model that allows obtaining the J logarithms of the probability ratios is given by the Formula 10.
 Formula 10
Where [Pij/Pi0] is the odds ratio for choosing alternative j in relation to the baseline.
Marginal Effect
Subject to specific regularity conditions, the choice probabilities of any random utility model can be approximated using an Ordered Multinomial Logit (MOML). The Formula 10 is estimated through the maximum likelihood method, along with iterative procedures. The model can be interpreted in relation to the marginal effects, as the impact of each explanatory variable on the probability is contingent upon both the explanatory variable vector and the model parameters set.
The formula for the marginal effect is mathematically complex, but easily calculable by existing modern software (Pérez, 2007). The effect of the variable Xk (continue) on the probability that the individual Y i choose the alternative j is given by the formula 11.
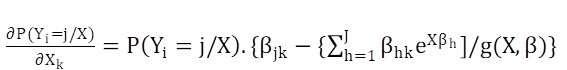
Where βhk is the k-th element de βh y g(X,β) = 1+∑ J (h=1) exp(X βh)
Compensating variation
The compensating variation (CV) is a measure of welfare arising from the indifference condition (Formula 12).
 Formula 12
The names of variables in Formula 12 can be identified based on the designations of indicators in Formula 3.
According to Formula 12, once the compensating variation has been subtracted from the income of individual i, then the indirect utility of i for alternative j must be equal to the indirect utility of that individual in the initial state (vi0) (Hanemann, 1996). Starting from the indifference condition, we obtain the individual compensatory variation (Formula 13).
 Formula 13
Where:
CVi represents the compensatory variation, going from the initial state to a level of improvement in environmental quality k.
"e" is base of the natural logarithms (approximately 2.71828).
β1 represents the marginal utility of income.
vk = vij k represents the marginal utility after the change in the alternatives or options.
v0 = vij 0 represents the indirect utility before the change (status quo).
In the Formula 13, the assumption is made that the option providing the highest utility to the individual will receive the highest score and be ranked first. Consequently, the probability of an individual assigning the highest score to a certain option is determined by the manner in which each option generates indirect utility (Greene, 2012).
Willingness to pay (WTP)
It is a concept addressed in the MOML model. According to this model, the alternative that generates the highest utility for an individual is considered the most valuable, receiving the highest score and occupying the top position in the ranking. Consequently, the probability of an individual assigning the highest score to a specific alternative depends on the indirect utility generated by each alternative.
In cases where one of the attributes includes the price vector pj, the change from one level to another in any of the other attributes defining a service can be evaluated in terms of compensated variation (Hanemann, 1996). This evaluation provides an estimate of the marginal utility of income and, consequently, serves as an approximation to the WTP for a unit increase in attribute levels other than price. The estimation can be obtained from the expression presented in the Formula 14.
Where β1 is the coefficient of the attribute being considered. The remaining indicators can be identified based on the designations in Formula 3.
Research design
To estimate the coefficients of the MOML model, which represent the benefits of conservation and tourism improvements, a survey was conducted among visitors of ACR-Ch at their respective visit location (specifically in the areas of “Mollepata” and “San Andrés de Cachora”). The purpose of this study was to identify visitor preferences for a set of presented options. Tourists were asked to choose the option that provided the highest utility among various combinations of alternatives randomly displayed to them. This information was then analyzed using the CA method, allowing for a comprehensive examination of the attributes used. Further details regarding this analysis are provided in the subsequent section.
Study area
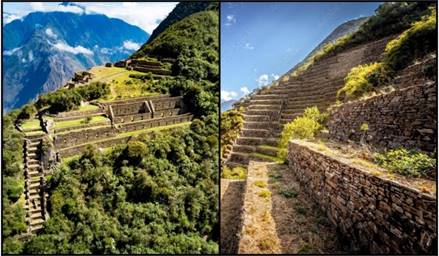
Choquequirao encompasses a total area of 103 814.39 hectares and is situated in the southeastern region of the country, specifically within the provinces of "La Convencion" and “Anta”, Cusco region or Department (Figure 1). It is home to the Choquequirao Archaeological Park, located at an elevation of 3 100 meters above sea level, halfway up the mountain that shares its name. RCA-Ch boasts diverse life zones encompassing dry, montane, and subtropical forests, thereby harboring significant biodiversity and a range of bioclimatic sub-areas. The establishment of the RCA was carried out through D.S. 022-2010-MINAM (MINAM, 2010).
The RCA-Ch boasts several two-level buildings along with irrigation canals (Figure 2). Additionally, visitors can witness hydraulic systems that service the houses, as well as a system of cultivation terraces. The use of terraces is a hallmark of Incan towns and played a crucial role in maximizing agricultural output on sloping hillsides; to the delight of tourists, the terraces resemble lush, vegetated floors. Thanks to more than a decade of public policies promoting tourism, visits to the RCA-Ch was able to take off (Ortiz de Orue, 2020).
Scenarios, attributes and levels
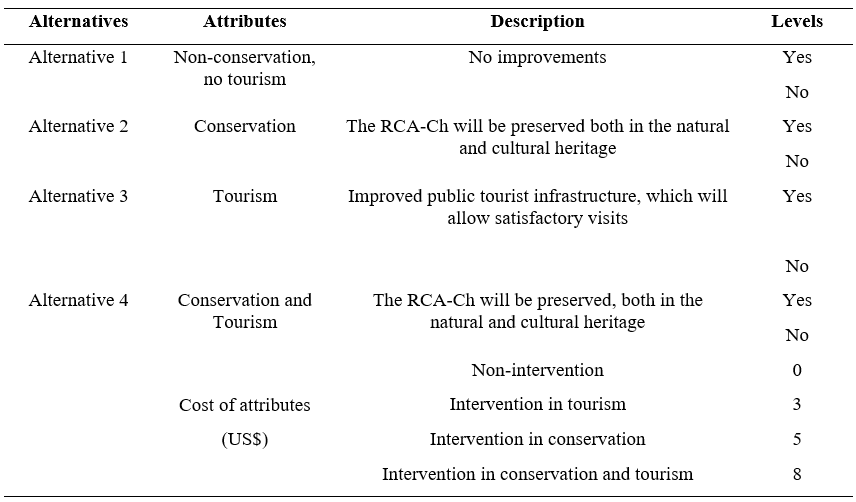
Through the utilization of various data collection tools, several activity scenarios (or valuation alternatives) were identified, each consisting of different attribute and level combinations, as outlined below.
Alternative 1: represents the current situation of the natural and cultural heritage and tourism infrastructure, denoted as (qt 1 = 0, qc 1 = 0). This scenario entails the NPA management solely conducting maintenance activities, without implementing restoration programs for deteriorated areas or scientific research on ecosystems.
Alternative 2: corresponds to a situation where no improvements are made to tourism infrastructure and conservation, indicated by (qt 2 = 0, qc 2 = 1). It involves implementing projects focused on protecting and conserving natural resources, training technical personnel in natural resource management, enhancing organizational capacities and involving local authorities and the community. As for cultural heritage, actions encompass the prioritization of specific sectors, archaeological research, and preventive conservation. According to data from the National Public Investment System, interventions would require the implementation of investment projects totaling US$ 14 288 333 .
Alternative 3: represented by (qt 3 = 1, qc 3 = 0); maintains the current state of the natural and cultural heritage while making improvements to public tourism infrastructure. This includes installing and expanding public tourist services. The necessary interventions have been identified in the investment programs of respective entities, requiring an investment of US$ 9 591 030.
Alternative 4: Involves the implementation of investment projects and programs in both, conservation and in tourism, totaling US$ 24 528 833. This alternative is represented by (qt 4 = 1, qc 4 = 1).
Cost levels were assigned to each of the four alternatives, corresponding to the choice characteristics of the respective attributes. The cost is described in four rate levels (US$ 0, US$ 3, US$ 5 and US$ 8) per visitor. The interviewees selected and ordered according to their preferences and the attributes of improvements in tourism and/or conservation. Attributes are independent of each other, that is, no correlation between them (McFadden et al., 1977). A summary of the scenarios, including their attributes and levels, is provided in Table 1.
Choice of options, sample size and data collection Formula 14b
( Choice of options
After establishing the utility model and determining the attributes and levels for the RCA-Ch scenarios, the subsequent step involved choosing the alternative services to be assessed by visitors. Various techniques have been developed to reduce the number of potential alternatives and effectively infer utilities from attribute combinations. In this study, the orthogonal design approach was employed, resulting in the selection of four alternatives from a pool of eight.
The design of CA is orthogonal; each attribute variation is independent of the others, resulting in null correlations between attribute levels. When using CA, it is important to select only the most representative attributes that can influence consumer preferences. In this research, four choice alternatives were offered to the interviewees, which were ordered by preference and used to construct an orthogonal design (Table 2); a price was assigned to each of the options.
Table 2 RCA-Ch: choice options for preferences of the interviewees
| Option 1 | Option 2 | Option 3 | Option 4 |
| Statu quo in conservation and tourism | Improvement in tourism | Improvement in conservation | Improvement in conservation |
| Statu quo in conservation | Statu quo in tourism | Improvement in tourism | |
| US$ 0.0 | US$ 3.0 | US$ 5.0 | US$ 8.0 |
Source: own elaboration
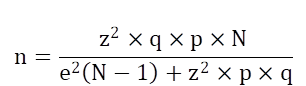 Formula 14b
Where:
n = calculated statistically significant sample size
N = population size, estimated at 406 average monthly tourists (MINCETUR, 2021)
z = chosen confidence level, 0.90.
e = margin of error of the sample: ± 5%.
p = proportion of respondents who want changes and improvements in policies for the area (0.7, according to data obtained from a previous pilot survey).
q = (1- p), proportion of those interviewed who do not wish to change the policies.
Tourist surveys were carried out at two exit points of RCA-Ch, during various periods throughout the year 2017. The questionnaire consisted of three sections. The first section gathered data on the tourist's visit to RCA-Ch, their previous knowledge, attitude towards nature, conservation of cultural heritage. The second section presented four choice scenarios, each featuring distinct attributes; and respondents were asked to express their preferences for each alternative. Lastly, the third section focused on socioeconomic questions to characterize the sample.
The economic valuation of the RCA-Ch captures the social preferences of the area's users regarding the preservation of levels of well-being generated by the benefits of natural, cultural, and sustainable management conservation policies. Therefore, the implementation of any program and/or investment project that involves improvements in the area will bring about changes in the well-being of both, direct and indirect users, thus enabling the determination of potential additional costs for visits. The interview forms include the costs of each alternative, distinguishing between tourism projects, conservation projects, and both components.
Results and discussion
In the case of RCA-Ch, the Conjoint Analysis model was applied using its contingent ranking version to assign ratings to each alternative based on visitor preferences. Implicitly, visitors rank the presented alternatives from most preferred to least preferred. To analyze the data, an Ordered Mixed Multinomial Logit model (MOML) was utilized, which is highly suitable for this scenario as the dependent variable represents the ordered ranking of options from 1 to 4 (with 1 being the most preferred and 4 being the least preferred). The variables that participated in the specification and estimation of the MOML are presented in Table 3.
The coefficients associated with the independent variables of the model are statistically significant at the 95% confidence level and with the expected signs (Table 4). Implementation of investment projects in conservation and tourism, will increases the probability that it will receive a better place in the ranking of interviewees; also, greater attribution and greater marginal effect to conjoint improvements in tourism and conservation.
Indirect utility functions
As an adjusted equation, indicators of Table 4 may be presented by the Formula 15.
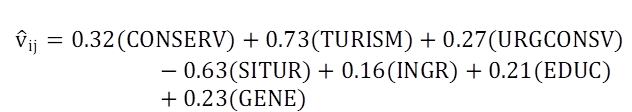 Formula 15
The estimated equation shows the indirect utility of each option for individuals. The marginal effect of residual income (INGR) is positive, indicating that higher residual income leads to greater indirect utility in conservation and tourism. Education also positively influences perceived indirect utility. Conversely, the SITUR variable (tourism infrastructure) has a negative effect, suggesting that improvements are necessary to enhance levels of indirect utility. On the other hand, the CONSERV variable (interest in conservation) exhibits a positive effect, indicating that higher levels of concern result in greater utility. The model's goodness of fit, measured by the coefficient R2 of Veall and Zimmermann, is relatively high at 74%.
Compensating variations (CV)
In this study, CV is used as an approximation of individuals' willingness to pay (WTP) for the options presented in Table 4. It represents the compensatory change in individuals' welfare for investing in tourism, conservation, or both. Using Formula 13 and the condition of indifference, the results show that visitors to RCA-Ch would be willing to pay US$ 4.5 for tourism infrastructure improvements and US$ 1.9 for conservation interventions. Interestingly, the CV for simultaneous improvements, in both areas, is much higher than the sum of CV for individual improvements, reaching the value of US$ 11.5.
Table 3 Variables in the estimation of the MOML.
| Name | Definition |
|---|---|
| Vij (ORDER) | Dependent variable, represents indirect utility; contains the order of the four AC alternatives, in a ranking that goes from 1 to 4, where 1 is the most preferred option and the highest rating, 4 is the least preferred option. |
| Independent or regressor variables X | |
| CONSERV | Dummy variable, 1 = if the person surveyed agrees with any of the conservation policies and 0 = otherwise. |
| SITINFTUR | Categorical variable of how the respondent considers the problems of tourism infrastructure/public services (1 = not serious, 2 = serious, 3 = very serious. |
| URGCONSV | Categorical variable, which describes how urgent is implementation of investment projects for the conservation of natural and cultural heritage seems to the visitor (scale from 1 to 3) 1 = not very urgent, 2 = urgent, 3 = very urgent. |
| URGTUR | Categorical variable, which describes how urgent the installation and improvements in public tourism services seem to the visitor (scale from 1 to 3), 1 = not very urgent, 2 = urgent, 3 = very urgent. |
| INGR | Continuous variable, residual income of each individual interviewed; it is the average of the range of family income minus the cost of the options (in thousands US$). |
| EDUC | Categorical variable: 1 = complete primary, 2 = not complete secondary school, 3 = high school, 4 = technical education, 5 = some college semesters, 6 = higher education. |
Source: own elaboration.
The combined CV for the simultaneous implementation of investment projects in tourism and conservation is US$ 80 718.5 per year, nearly doubling the total CV of options 2 and 3 as presented in Table 5.
Results of interviews
The results of model estimation largely coincide with the direct results of the interviews of RCA-Ch visitors. When it comes to the options presented to the interviewees, the most highly desired choice was option 4, which involves the integrated implementation of public policies for both conservation and tourism (58.2% preference rate). In stark contrast, option 1 (representing the initial situation without any interventions) was only preferred by a mere 5.3% of the interviewed individuals (Table 6).
Table 4 Results of the MOML (with ordering of options).
| Dependent Variable: ORDER | |||
| Independent Variables * | Coefficient | Value of “z” statistic | Probability of the “z” statistic |
| CONSERV | 0.32 | 3 012 | 0.00000000 |
| TURISM | 0.73 | 5 762 | 0.00000021 |
| URGCONSV | 0.27 | 3 505 | 0.00000016 |
| SITUR | -0.6 | -5.157 | 0.00000000 |
| INGR | 0.16 | 29.885 | 0.00000000 |
| EDUC | 0.21 | 2.089 | 0.00000000 |
| GENE | 0.23 | 2.133 | 0.00000009 |
| Log-Likelihood | -253.33 | ||
| R2 Veall & Zimmerman | 0.74 | ||
| χ2 | 153.46 | ||
| N° of observations | 716** | ||
Source: own estimation.
* For this research, there was a greater number of independent variables, which were filtered out the specification process of the model, according to their significance and statistical importance in the explanation of the objective variable.
** The sample size was 179, but since there are 4 alternatives, and each visitor was asked to order their preferences, then the number of observations resulted in 179 x 4 = 716.
Table 5 RCA-Ch: compensated variation, cost of attributes and aggregate WTP.
| Options | Compensated variation US$. visit-day (Marginal WTP) | Cost of option (US$) | Compensated variation annual aggregate (2018, in US$) |
| 2 | 4.5 | 3 | 31 585.5 |
| 3 | 1.9 | 5 | 13 336.1 |
| 4 | 11.5 | 8 | 80 718.5 |
Source: own elaboration.
According to the interview results, it is evident that majority of both, domestic (69.6%) and foreign (56.5%) tourists, strongly endorse the implementation of investments projects in a collaborative manner. Conversely, the option of no improvements garners support from only a small fraction of visitors, with foreigners expressing a preference of 4.8% and nationals at 8.7% preference refer to Figure 3 below for a visual representation of these findings.
Comparison of the results with respect to other scientific research
The conjoint analysis (CA) model is frequently used to study how the characteristics of a good influence individuals' consumption preferences, as is the case with the improvements that would be developed in the RCA Choquequirao. Below, we detail some studies that used the CA model to economically assess policy improvements in different circumstances and locations. It is important to mention that, at the national level, the CA method has not been employed by researchers for assessing attributes in the conservation of natural and cultural heritage, respectively; however, some international studies have been found and are presented in Table 7.
Table 6 Frequency of RCA-Choquequirao options.
| Options | Frequency | Percentage | Cumulative Percentage |
|---|---|---|---|
| 1. No intervention | 9 | 5.3 | 5.3 |
| 2. Improvement in conservation | 19 | 11.2 | 16.5 |
| 3. Improvement in tourism | 43 | 25.3 | 41.8 |
| 4. Improvement in conservation and tourism | 99 | 58.2 | 100.0 |
| Total | 170 | 100.0 |
Source: own elaboration, based on survey results.
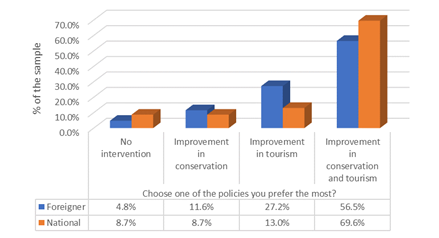
Source: own elaboration, using data from visitor interviews for this study.
Figure 3 Preferences of visitors to the RCA-Ch, by nationality.
Not many ecosystem goods and services have been addressed using the conjoint model; in this research, one special ecosystem service was examined: the non-market valuation of an archaeological site of historical significance to the country. A WTP of US$ 11.5 was obtained for joint activities in conservation and tourism (with only US$ 4.5 and US$ 1.9 allocated to tourism and conservation, respectively). In the field of historical ecosystem conservation, this study contributes to the scientific literature by including tourism as an attribute of the environmental goods and services provided by a natural area, resulting in a higher WTP value compared to the conservation of other types of ecosystems. The comparative studies used in this research yield values and attributes that are relatively lower than those estimated in the present study, but these are only rough approximations due to the comparison of multiple attributes of different types of ecosystem services. Moreover, it should be noted that different currencies and circumstances from each country were used, with average data, given that exchange rates can also be quite flexible. However, one conclusive aspect is that archaeological sites that include tourism attributes, such as in the case of Choquequirao, Cusco, tend to have relatively higher valuations.
Conclusions
The findings of this study highlight the significance attributed by a majority of visitors to the Regional Conservation Area “Choquequirao” in Cusco, Peru, to the enhancement of both conservation and tourism activities within the Natural Protected Area. Such policy improvements are seen as beneficial for ecosystem preservation and tourism promotion. In the field of historical ecosystem conservation, this study contributes to the scientific literature by including tourism as an attribute of the environmental goods and services provided by a natural area, resulting in a higher WTP value compared to the conservation of other types of ecosystems. The comparative studies used in this research yield values and attributes that are relatively lower than those estimated in the present study.
Furthermore, this research introduces an economic tool for valuing the direct utilization of RCA-Ch. It demonstrates that investments in the simultaneous development of conservation and tourism yield greater social benefits. To implement these improved policies effectively, public managers in the region must endorse this economic instrument, which reflects the importance and prioritization of such measures.
By utilizing an Ordered Mixed Logit model that allows for prioritizing visitors' preferred options, the study estimated the Willingness to Pay (WTP) of visitors to RCA Choquequirao for various policy alternatives. The results reveal that visitors are willing to pay $4.5 for tourism investment projects, US$ 1.9 for conservation projects, and US$ 11.5 for joint projects. The total social benefit attributed by direct users to joint policy improvements in conservation and tourism at RCA-Ch amounts to approximately US$ 281 902.1 per year (2018). This value could serve as initial capital for the conservation and enhancement of the Natural Protected Area, as well as a means to leverage funds from national and international cooperation.
Table 7 Comparison of results in the international application of the CA method.
| Objectives | Results | Reference and Place of application |
|---|---|---|
| To estimate the willingness to pay (WTP) to reduce the risk of forest fires in a Mediterranean forest area | The value of a 25% and 50% reduction in the risk of a forest fire amounts to a WTP of US$1.3 and US$2.7 per hectare/ citizen, respectively. | (Bengochea et al., 2007). Valencia, Spain. |
| To estimate the potential of the Conjoint Method as a tool for public management in determining visitor recreation preferences in a protected natural park. | Regarding activities within the park, the majority of groups expressed preferences for horseback riding (WTP > US$ 6.7); similarly, visitors who favored mountain-related activities and biking were willing to pay a WTP of up to US$ 20; whereas visitors who preferred only biking were willing to pay between US$ 2 and 6.7. | (Sánchez & Pérez, 2000). Gorbea Natural Park, Zaragoza, Spain. |
| To use CA to analyze the main attributes and preferences of individuals in different markets regarding wine consumption in Navarre, Spain. | The most valued attributes were the price of the wine, in the first place, followed by its geographical origin. The study did not determine WTP (Willingness to Pay), but concluded by indicating that the Ordered Logit model identifies three market segments. | (Sánchez & Gil, 1998). Navarre, Spain. |
| To Compare contingent valuation and conjoint analysis (CA) through the assessment of changes in attributes of a recreational fishing area | It was found that the welfare measures obtained through contingent valuation are three to four times smaller than those obtained with the conjoint analysis method. | (Mackenzie, 1992). Delaware, USA. |
| To evaluate conservation policies for wetland ecosystems in Kushiro, Japan. | An average WTP of US$ 0.4 per year per household was found, as well as an aggregate WTP of up to 288 million dollars per year for the protection of the wetland and its surrounding area. | (Kuriyama, 1998). Kushiro, Japan. |
Source: own elaboration, based on revised literature. Note: the comparative studies had different monetary units, which were converted to US dollars using the exchange rate of the year of execution.

