


Services on Demand
Journal

Article
 text in
  English (pdf)
 Article in xml format
 Article references
 Send this article by e-mail
Indicators
-
 Cited by SciELO
Related links
-
 Similars in
SciELO
Similars in
SciELO
Share

 Permalink
Revista Peruana de Medicina Experimental y Salud Publica
Print version ISSN 1726-4634
Rev. perú. med. exp. salud publica vol.37 no.4 Lima Oct-Dec 2020 Epub Nov 11, 2020
http://dx.doi.org/10.17843/rpmesp.2020.374.5705
Original articles
Factors associated with unwanted additional fertility: secondary analysis of a national survey in Peru
, Medical student http://orcid.org/0000-0002-5270-4339
, Medical studenthttp://orcid.org/0000-0003-3718-5857
, Medical studenthttp://orcid.org/0000-0002-8402-010X
, Medical studenthttp://orcid.org/0000-0003-2571-4344
, Doctoral student in Economicshttp://orcid.org/0000-0003-0522-9931
, Medical epidemiologisthttp://orcid.org/0000-0001-5281-8398
1 Escuela de Medicina, Universidad Peruana de Ciencias Aplicadas, Lima, Perú.
2 Sociedad Científica de Estudiantes de Medicina de la Universidad Peruana de Ciencias Aplicadas, Lima, Perú.
3 Universidad Complutense de Madrid, Madrid, España.
4 Centro de Prevención y Control de Enfermedades, Ministerio de Salud, Lima, Perú.
INTRODUCTION
Fertility is a demographic variable that facilitates the analysis of the growth trend of any population ( 1. In the last decades, the fertility rate has decreased considerably in all regions of the world 2. Latin America is one of the regions where the decline has been greater 2. In Peru, between 1986 and 2017, the fertility rate decreased by 44% 3. Despite the decline, there is still a gap between desired and observed fertility, which is described as unwanted additional fertility (UAF) 4. This indicator varies between developed and developing countries, and between urban and rural populations. In developed countries, desired fertility is higher than observed fertility, while in developing countries, it is the opposite 5 , 6.
Family planning is one of the factors associated with UAF 7. Although this measure has shown to be effective in controlling population growth, only 18% of people talk to their doctor about this subject and the lack of information is similar for both genders 8. Likewise, the use of modern contraceptive methods has not varied significantly, and the use of traditional or folkloric contraceptive methods predominates in rural areas 3 , 9.
Similarly, women’s education is an important factor 10. Amaranta et al. reported that at lower education levels, observed fertility is higher than desired fertility 6. Regarding employment, a retrospective study conducted in the United States between 1976 and 2010 states that for every 1 percentage point increase in the unemployment rate, the fertility rate decreases by 0.5 conceptions per 1,000 women ( 11.
Sexual violence is also an important factor to consider. A study of sexually abused women under 53 years of age reported increased frequency of abortion and infertility 12. It has also been observed that intimate partner violence is associated with miscarriages, fetal death, and maternal health complications 13.
In short, fertility is a demographic variable that has a great impact on the country’s economic and socio-cultural development. It is postulated that decrease in a country’s fertility rate, increases the educational level of women and, with it, economic growth 14. In Peru, no data was identified that demonstrated an association between the previously described factors and the gap between observed and desired fertility. Therefore, the aim of this study is to determine the sociodemographic and reproductive factors associated with UAF in Peru.
KEY MESSAGES
Motivation for the study: To get a better understanding of the socio-cultural and economic characteristics of the gap between desired and observed fertility in Peru.
Main findings: An unwanted additional fertility (UAF) of 72.5% nationwide. UAF is 7% more likely in women from a rural setting than in those from an urban setting and 20% less likely in women from the fifth wealth quintile.
Implications: Our study provides a starting point for the design of effective public policies to address the studied factors in the regions with higher UAF prevalence.
MATERIALS AND METHODS
Study design and study population
We conducted an analytical cross-sectional observational study, based on a secondary analysis of the 2018 Demographic Health Survey (DHS) in Peru. The sample framework of the 2018 DHS was the updated statistical and cartographic information of the 2007 National Census and the update of the System of Household Targeting 2012-2013. The sampling used by the DHS had two stages and was balanced, stratified and independent, by department, urban and rural areas. Sampling units consisted of the conglomerate of private housing in the urban area, and the area of rural registry and private housing in the rural area. The sample size for 2018 DHS was 36,760 homes, where 34,996 women between the ages of 15 and 49 were surveyed. Our study included only women from 40 to 49 years old, since it has been described that the probability of gestation is considerably reduced at the age of 40 15, which is evidenced by a decrease in the fertility rate in Peruvian women from that age 16. Likewise, records that did not contain all the variables of interest were excluded.
Variables
The dependent variable was created from the numerical difference between the obtained fertility and the desired fertility. The obtained fertility was defined as the sum of the living and dead children of the women surveyed. The survey included the following questions: “How many living children do you have?”, “How many of your sons who died?” and “How many of your daughters died?”. While the desired fertility was obtained with the question: “What is your ideal number of children to have?”. The UAF variable was categorized as “present” when the numerical difference was positive and “absent”, when the numerical difference was negative or zero.
The independent variables were of a socio-demographic and reproductive nature. Among the sociodemographic variables, we described: age, region, socioeconomic level, marital status, degree of education attained by the woman and her partner, the woman’s occupation, and health insurance coverage. On the other hand, the reproductive variables were the following: age when first married, age when first intercourse occurred, age at first delivery, desire of the couple to have more children, use of contraceptive methods at some time, decision maker for the use of contraceptive methods and final decision maker regarding health issues.
Collection and processing of information
The DHS is a continuous, annual national survey, carried out by the Instituto Nacional de Estadísticas e Informática (INEI). It contains updated information on reproductive health and maternal and child health, which allows for the analysis of trends and changes related to these topics. The database was obtained from the “Microdata” section of the INEI website, available at the following link: http://iinei.inei.gob.pe/microdatos/. Initially, the variables of interest described above were selected and found in different modules: (basic data, birth history - method knowledge table), 69 (pregnancy, delivery, puerperium, and lactation), 70 (immunization and health). Then, the database was compiled in the program RStudio 3.5.2 (RStudio Team [2015]. RStudio: Integrated Development for R. RStudio, Inc., Boston, MA) through the “Merge” function. Finally, the database was exported in .dta format for further analysis.
Data analysis
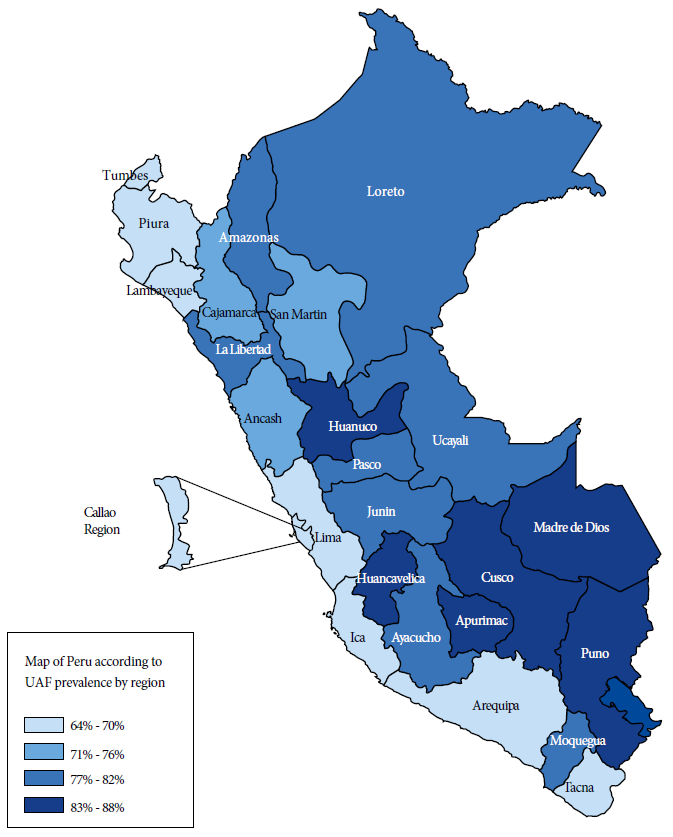
We analyzed data in Stata 14.0 (Stata Corporation, College Station, TX, USA). We used the svy command module for complex surveys and to specify cluster, stratum, and weighting factors for prevalence description, bivariate, and multiple regression analysis. The relative frequencies of socio-demographic and reproductive variables were described. We also created a choropleth map of Peru to graphically represent the distribution of UAF by department, according to quartiles. Then, the bivariate analysis was carried out by using the chi-square test between the independent variables and the UAF. Finally, crude (cpr) and adjusted (apr) prevalence ratios were calculated using generalized Poisson family linear models with log-linkage. The variables that entered the adjusted model were selected with the Stepwise method. Statistical significance was considered with a p < 0.05.
RESULTS
The 2018 DHS included 34,996 women between the ages of 15 and 49. Of these, 28,052 women under 40 years old were excluded because they were yet to achieve their desired fertility. Thus, 6,944 women between 40 and 49 years old were included, with an average age of 44.3 years (SD: 2.51). Sixty percent lived on the coast; 82.4% lived in the urban area; 90% had a long-term partner; 70.9% had at least a secondary school education; and 37.2% worked as professionals or in the service sector. We also found that 45.1% had a partner with secondary school education; and 33.9% had a partner with higher education. Only 24% had health insurance (Table 1). Thirty percent were married before 19 years old and 62.5% said that both members of the couple wanted the same number of children (Table 2).
Table 1 Prevalence of unwanted additional fertility according to sociodemographic characteristics in women 40-49 years old who participated in the 2018 DHS, Peru
| Variable | Population (%) n = 6,944 | UAF (%) n = 5,034 | 95% CI | p value a |
|---|---|---|---|---|
| Age (Years) b | 44.30 (SD: 2.51) | |||
| Region | ||||
| Coast | 60.0 | 60.4 | 58.3-62.4 | 0.463 |
| Sierra | 33.2 | 32.6 | 30.7-34-5 | |
| Jungle | 6.8 | 7.1 | 6.4-7.8 | |
| Setting | ||||
| Urban | 82.4 | 79.6 | 78.3-80.9 | <0.001 |
| Rural | 17.6 | 20.4 | 19.1-21.7 | |
| Wealth quintile | ||||
| Lower quintile | 15.9 | 18.5 | 17.2-19.9 | <0.001 |
| Second quintile | 19.1 | 20.1 | 18.3-22.1 | |
| Intermediate quintile | 20.9 | 21.5 | 19.7-23.6 | |
| Fourth quintile | 21.0 | 20.8 | 18.6-23.2 | |
| Top quintile | 23.1 | 19.0 | 16.7-21-6 | |
| Marital status | ||||
| With a long-term partner c | 90.0 | 93.7 | 92.2-95.0 | <0.001 |
| Without a long-term partner d | 10.0 | 6.3 | 5.0-7.8 | |
| Women’s education level | ||||
| No education | 3.7 | 4.1 | 3.4-4.9 | <0.001 |
| Primary school | 25.4 | 28.9 | 27.0-31-0 | |
| Secondary school | 35.7 | 36.7 | 34.3-39.2 | |
| Higher education | 35.2 | 30.3 | 27.7-32.9 | |
| Women’s occupation | ||||
| Unemployed | 5.2 | 5.8 | 4.6-7.3 | <0.001 |
| Professional and services | 37.2 | 34.9 | 32.3-37.6 | |
| Handcraft | 27.2 | 28.4 | 26.2-30.7 | |
| Agriculture | 12.7 | 15.6 | 14.4-16.9 | |
| Home and domestic | 10.1 | 10.7 | 9.1-12.6 | |
| Clerical | 6.0 | 4.6 | 3.5-5.9 | |
| Partner’s education level | ||||
| No education | 1.1 | 1.2 | 0.9-1.7 | <0.001 |
| Primary school | 19.8 | 21.4 | 19.7-23.1 | |
| Secondary school | 45.1 | 47.2 | 44.6-49.9 | |
| Higher education | 33.9 | 30.2 | 27.6-32.8 | |
| Health insurance coverage | ||||
| Yes | 24.0 | 22.9 | 20.8-25.2 | 0.041 |
| No | 76.0 | 77.1 | 74.8-79.2 |
a chi-square test
b mean (SD)
c with a long-term partner: married, cohabiting or non-cohabiting couple.
d without a long-term partner: single, divorced, widowed
Table 2 Prevalence of unwanted additional fertility according to reproductive characteristics in women aged 40-49 who participated in the 2018 DHS, Peru
| Variables | Population (%) | UAF (%) | 95% CI | p valuea |
|---|---|---|---|---|
| n=6944 | n=5034 | |||
| Age at first marriage | ||||
| <19 years | 30 | 33.8 | 31.5-36.2 | <0,001 |
| ≥19 years | 70 | 66.2 | 63.8-68.5 | |
| Age at first intercourse | ||||
| No intercourse | 1.6 | 0 | 0.0-0.0 | |
| <19 year | 94.1 | 96.89 | 96.0-97.5 | <0,001 |
| ≥19 years | 4.2 | 3.1 | 2.5-4.0 | |
| Age at first delivery | ||||
| <19 years | 24.4 | 27.1 | 25.1-29.1 | <0,001 |
| ≥19 years | 75.6 | 72.9 | 70.9-74.9 | |
| Partner’s desire to have children | ||||
| Same number as her | 62.5 | 61.1 | 57.8-64.2 | 0,073 |
| Wants less | 9.9 | 9.6 | 7.8-11.4 | |
| Wants more | 21.6 | 23.4 | 20.8-26.3 | |
| Does not know | 6 | 6 | 4.8-7.6 | |
| Use of contraceptive methods | ||||
| Never used | 5.9 | 2.8 | 2.1-3.6 | <0,001 |
| Modern method | 87 | 89.9 | 88.6-91.1 | |
| Folkloric method | 0.3 | 0.4 | 0.3-0.6 | |
| Traditional method | 6.8 | 6.9 | 5.9-8.1 | |
| Decision maker on contraceptive use | ||||
| Both | 70.8 | 69.8 | 66.1-72.8 | |
| She | 24.5 | 26.2 | 23.0-29.4 | 0.143 |
| Her partner | 4.7 | 4.1 | 3.1-5.4 | |
| Decision maker on health issues | ||||
| Both | 20.3 | 20.3 | 18.2-22.5 | |
| She | 68.3 | 67.7 | 65.2-70.2 | |
| She and someone else | 0.1 | 0.1 | 0.02-0.3 | 0.332 |
| Husband | 11.2 | 11.8 | 10.4-13.3 | |
| Someone else | 0.1 | 0.1 | 0.1-0.3 | |
chi-square test
The UAF prevalence was 72.5% (95% CI: 70.4%- 74.4%). The UAF rate was higher in Huancavelica (88%), Cusco (86.5%) and Madre de Dios (84.9%); and lower in Ica (64.1%), Callao (65%) and Tumbes (66.5%) (Figure 1). Of the group of women surveyed, 60.4% lived on the coast and 79.6% in the urban area; 93.7% had a long-term partner; 66.9% had at least secondary school education; and 34.9% worked as professionals or in the service sector. Only 22.9% had health insurance; 47.2% had a partner with secondary education and 30.2% with a partner with higher education. Statistically significant associations were found between UAF and area of residence, socioeconomic level, marital status, education level, occupation, education level of the partner, and health insurance coverage (Table 1).
From the total of women surveyed, 33.9% were married before the age of 19, 61.1% reported that both partners wanted the same number of children, 89.9% reported using modern contraceptive methods and 69.8% reported that the decision to take contraceptive methods was made jointly with their partner.
Statistically significant associations were found between age at first marriage, age at first intercourse, age at first delivery, use of anti-conceptive methods, and UAF (Table 2).
In the multiple regression model, we found that being in the upper wealth quintile decreases the probability of UAF by 20% (RPa 0.80; 95% CI: 0.69-0.93) with respect to the intermediate quintile. On the other hand, being from a rural setting increases by 7% the probability of UAF (PRa 1.07; 95% CI: 1.01-1.14) with respect to the urban setting. In addition, the fact that the respondent is the sole decision maker about her contraceptive methods increases the probability of UAF (PRa 1.10; 95% CI: 1.02-1.18) by 10% compared to having the decision made jointly with her partner. Similarly, having the interviewee and a person, other than her partner, make health decisions increases the probability of UAF by 45% (PRa 1.45; 95% CI 1.30-1.62), compared to having the decision made jointly with her partner (Table 3).
DISCUSSION
This study found high prevalence of UAF in Peruvian women aged 40-49 in seven out of every ten respondents. This finding is particularly important in those less advantaged socioeconomic sectors. A national study found that poorer populations had higher fertility and lower contraceptive use rates than wealthier populations. In Peru, only 34% of women of reproductive age in the lower socioeconomic strata use effective contraception 17. Similarly, a study in Bolivia identified that ethnic minority women had higher fertility rates than non-minority women, and this difference was almost entirely attributed to UAF in ethnic minority women 18. Thus, identifying the groups with the highest UAF is essential for reorienting family planning programs.
Similarly, the gap between desired and observed fertility, which is measured in our study as UAF, is an indicator of dissatisfaction with the reproductive ideal 19. In this sense, it has been proposed that awareness measures aimed at reducing desired family size are necessary but not sufficient to achieve a significant reduction in observed fertility. This requires expanding the system of reproductive control services, especially in vulnerable regions, after raising awareness about the importance of reducing desired fertility 20 , 21. In this regard, our study identified the regions of Huancavelica, Puno, and Cusco as those with the highest UAF.
Also, our study found that women from the top wealth quintile are 20% less likely to have more children than those in the middle quintile. A study that evaluated factors associated with fertility decline in working Peruvian women found that both dependent and independent workers with high wealth are 60% less likely to have children 22. The differences in the figures cited can be explained by the different populations studied. Our study analyzed women from 40 to 49 years old, while the cited study analyzed working women of childbearing age. Another difference is the selection of the dependent variable since, in the cited study, it was the probability of having children. However, a study carried out in Brazil on women from 15 to 49 years old found similar figures to those of our study regarding the level of wealth. The top wealth quintile was reported to be 26% less likely to have more children 23.
A higher probability of UAF was found in women working in handcraft and agriculture. Our results are consistent with previous studies in Latin America, which were collected in a systematic review 24 and describe negative or non-significant associations between traditional jobs and fertility. The same study also describes a lower impact on fertility in women in independent jobs than those in dependent jobs. Therefore, we suggest exploring the contradiction between the reduced access to health services and schooling in the rural setting (where most agricultural work occurs, and which is mostly independent) and the apparent decline in fertility. Another study aimed at sociocultural differences of African women found important differences in how social context influences the impact of work on fertility, such that certain variables that positively impact fertility decrease it in other contexts, even when both are adjusted to the same variables. That study described a negative impact of female labor on fertility in the Togolese society, where there is an important syncretism between Christianity and animism; these is a similar situation to that of Peru, and that coincides with our results 25 , 26.
Our study reported that if women’s health decisions are made jointly with a person other than their partners, UAF increases. A study in Bangladesh described that when decisions at home were made by a person other than the woman, the partner, or the couple, the likelihood of using contraception decreased by up to 40%. An association was also described between discordance among the responses of both partners and women’s use of contraception. To explain this behavior, the authors recommend further study of Peruvian family dynamics.
Regarding the use of contraceptive methods, the results obtained are incongruent with a previous study that evidenced family planning as a protective factor for UAF 28. The authors attribute this inconsistency to the fact that the DHS asks about lifetime use of contraceptive methods, and it is possible that these methods were used at the time of the survey but were not used at the time of conception. Also, our study found that if women are the sole decision-makers about their contraceptive methods, the likelihood of UAF increases. In the literature review, no information was found about the association between the identity of who chooses the contraceptive method and fertility. However, it has been described that, despite the increased frequency of contraceptive use in Peru, especially the male condom, fertility has not been impacted as would be expected 29. The authors attribute this to incorrect or inconsistent use of contraceptive methods among women who use them.
An important limitation of our study is that UAF reflects results that can only be extrapolated to populations with similar characteristics to the Peruvian one. Also, UAF is the result of family planning policies of previous years, so UAF in young women should be evaluated according to current family planning programs, whose results will be seen in the coming years.
There may also be a memory bias, as the DHS asks “have you ever ...” questions. Furthermore, because it is a cross-sectional study, it is not possible to determine a causal relationship. On the other hand, among the strengths of this study, it is worth noting that sociodemographic variables and those of the reproductive environment, both of the woman and of the partner, were analyzed. It should be noted that the sampling used by the 2018 DHS means that the results found can be extrapolated to the reality of the Peruvian female population aged 40-49.
The prevalence of UAF among Peruvian women aged 40-49 who responded to the DHS 2018 is high. We describe significant associations with socio-demographic and reproductive factors, as well as with the characteristics of women and people in their immediate environment. Due to the limitations faced during the execution of this study, we recommend conducting prospective studies that evaluate the impact of these factors on UAF in women from the first sexual intercourse onwards. We also suggest a qualitative study to evaluate the interests and opinions of this population.
REFERENCES
1. OMS. Estadísticas Sanitarias Mundiales, 2009 [Internet]. Francia: Observatorio Mundial de la Salud,OMS; 2009 [citado el 24 de abril de 2020]. Disponible en: https://www.who.int/gho/publications/world_health_statistics/2009/es/. [ Links ]
2. Rodríguez-Gómez G, Molina-Cintra MC, Quintana-Llanio L. Fecundidad. Estudio y comportamiento. América Latina y Cuba. Rev Noved Poblac. 2015;11(21):65-77. [ Links ]
3. INEI. Encuesta Demográfica y de Salud Familiar 2017 [Internet]. INEI. 2017 [citado 7 de marzo de 2020]. Disponible en: https://www.inei.gob.pe/media/MenuRecursivo/publicaciones_digitales/Est/Lib1525/index.html. [ Links ]
4. Gillespie D, Ahmed S, Tsui A, Radloff S. Unwanted fertility among the poor: an inequity? [Internet]. Bull World Health Organ. 2007;85(2):100-7. doi: 10.2471/blt.06.033829. [ Links ]
5. Nishimura T. What are the factors of the gap between desired and actual fertility? - A comparative study of four developed countries [Internet]. School of Economics, Kwansei Gaskuin University. 2012 [citado el 24 de abril de 2020]; 1-34. Disponible en: https://www.researchgate.net/publication/254426501_What_are_the_factors_of_the_gap_between_desired_and_actual_fertility_A_comparative_study_of_four_developed_countries. [ Links ]
6. Amarante V, Cabella W. La brecha entre la fecundidad deseada y la observada en Montevideo y su Área Metropolitana. Notas Poblac CEPAL [Internet]. 2015 [citado 7 de marzo de 2020];42. Disponible en: https://www.cepal.org/es/publicaciones/38521-la-brecha-la-fecundidad-deseada-la-observada-montevideo-su-area-metropolitana. [ Links ]
7. Ministerio de Salud. Norma Técnica de Salud de Planificación Familiar, 2017 [Internet]. Lima: Dirección General de Intervenciones Estrategias en Salud Pública, MINSA; 2017 [citado el 24 de abril de 2020]. Disponible en: http://bvs.minsa.gob.pe/local/MINSA/4191.pdf. [ Links ]
8. Almeida-Santos T, Melo C, Macedo A, Moura-Ramos M. Are women and men well informed about fertility? Childbearing intentions, fertility knowledge and information-gathering sources in Portugal. Reprod Health. 2017;14(1):91 doi: 10.1186/s12978-017-0352-z. [ Links ]
9. OMS. Planificación familiar [Internet]. Organización Mundial de la Salud; 2018 [citado 7 de marzo de 2020]. Disponible en: https://www.who.int/es/news-room/fact-sheets/detail/family-planning-contraception. [ Links ]
10. Kan K, Lee M-J. The Effects of Education on Fertility: Evidence from Taiwan. Econ Inq. 2018;56(1):343-57. doi: 10.1111/ecin.12492. [ Links ]
11. Currie J, Schwandt H. Short- and long-term effects of unemployment on fertility. Proc Natl Acad Sci USA. 2014;111(41):14734-9. doi: 10.1073/pnas.1408975111. [ Links ]
12. Ryan GL, Mengeling MA, Booth BM, Torner JC, Syrop CH, Sadler AG. Voluntary and involuntary childlessness in female veterans: associations with sexual assault. Fertil Steril. 2014;102(2):539-47. doi: 10.1016/j.fertnstert.2014.04.042. [ Links ]
13. Dhar D, McDougal L, Hay K, Atmavilas Y, Silverman J, Triplett D, et al. Associations between intimate partner violence and reproductive and maternal health outcomes in Bihar, India: a cross-sectional study. Reprod Health. 2018;15(1):109. doi: 10.1186/s12978-018-0551-2. [ Links ]
14. Karra M, Canning D, Wilde J. The Effect of Fertility Decline on Economic Growth in Africa: A Macrosimulation Model. Population and Development Review. 2017;43:237-263. doi: 10.1111/padr.12009. [ Links ]
15. George K, Kamath MS. Fertility and age. J Hum Reprod Sci. 2010;3(3):121-3. doi: 10.4103/0974-1208.74152. [ Links ]
16. INEI. Encuesta Demográfica y de Salud Familiar 2018 [Internet]. Lima: INEI; 2018 [citado 26 de marzo de 2020]. Disponible en: https://www.inei.gob.pe/media/MenuRecursivo/publicaciones_digitales/Est/Lib1656/index1.html. [ Links ]
17. Soriano-Moreno DR, Soriano-Moreno AN, Mejia-Bustamante A, Guerrero-Ramirez CA, Toro-Huamanchumo CJ. Factors associated with highly effective contraceptive use among reproductive-age women in Peru: Evidence from a nationwide survey. Eur J Obstet Gynecol Reprod Biol. 2019;245:114-120. doi: 10.1016/j.ejogrb.2019.12.017. [ Links ]
18. McNamee CB. Wanted and Unwanted Fertility in Bolivia: Does Ethnicity Matter: Int Perspect Sex Reprod Health. 2009;35(4):166-75. doi: 10.1363/ipsrh.35.166.09. [ Links ]
19. Enríquez-Canto Y, Ortiz-Romaní KJ, Ortiz-Montalvo YJ. Efecto de las preferencias de fecundidad en la cantidad de hijos. Comparación entre trabajadoras peruanas. Horiz. Med. 2018;18(3). doi: 10.24265/horizmed.2018.v18n3.07. [ Links ]
20. Muhoza DM, Broekhuis A, Hooimeijer P. Variations in Desired Family Size and Excess Fertility in East Africa. Int J Popul Res. 2014:11. doi: 10.1155/2014/486079. [ Links ]
21. Günther I, Harttgen K. Desired Fertility and Number of Children Born Across Time and Space. Demography. 2016;53(1):55-83. doi: 10.1007/s13524-015-0451-9. [ Links ]
22. Enríquez Canto Y, Ortiz Romaní KJ, Ortiz Montalvo YJ. Efecto de las preferencias de fecundidad en la cantidad de hijos. Comparación entre trabajadoras peruanas. Horiz Méd. 2018;18(3):37-47. doi: 10.24265/horizmed.2018.v18n3.07. [ Links ]
23. Oviedo Tejada CA, Madeira Triaca L, Katrein da Costa F, Hellwig F. The sociodemographic, behavioral, reproductive, and health factors associated with fertility in Brazil. PLoS ONE [Internet]. 2017;12(2). doi: 10.1371/journal.pone.0171888j. [ Links ]
24. Schockaert I. Travail féminin et fécondité en Amérique latine. Population. 2005;60(1):157-78. doi: 10.3917/popu.501.0157. [ Links ]
25. Beguy D. The impact of female employment on fertility in Dakar (Senegal) and Lomé (Togo). Demogr Res Population. 2009;20(7):97-128. doi: 10.4054/DemRes.2009.20.7. [ Links ]
26. Guerreira MCB. Evangelización y sincretismo religioso en los Andes. Rev Complut Hist América. 1993;19:11-19. [ Links ]
27. Uddin J, Hossin MZ, Pulok MH. Couple's concordance and discordance in household decision-making and married women's use of modern contraceptives in Bangladesh. BMC Women's Health Internet. 2017;17(1):107. doi: 10.1186/s12905-017-0462-3. [ Links ]
28. Barden-O´Fallon JL, Speizer IS, White JS. Association between contraceptive discontinuation and pregnancy intentions in Guatemala. Rev Panam Salud Publica. 2008;23(6):410-7. doi: 10.1590/s1020-49892008000600006. [ Links ]
29. Bellizzi S, Ali MM, Cleland J. Long-Term Trends in Reproductive Behavior Among Young Women in Four Countries, 1995-2009. J Adolesc Health. 2019;64(2):201-10. doi: 10.1016/j.jadohealth.2018.08.014. [ Links ]
Cite as: Mendez-Guerra C, Al-kassab-Córdova A, Cornejo-Venegas G, Quevedo-Ramirez A, Alva K, Napanga-Saldaña E. Factors associated with unwanted additional fertility: secondary analysis of DHS 2018 in Peru. Rev Peru Med Exp Salud Publica. 2020;37(4). doi: https://doi.org/10.17843/rpmesp.2020.374.5705.
Received: May 03, 2020; Accepted: July 16, 2020
 Este es un artículo publicado en acceso abierto bajo una licencia Creative Commons
