


Servicios Personalizados
Revista

Articulo
 texto en
  Inglés (pdf)
 Articulo en XML
 Referencias del artículo
 Enviar articulo por email
Indicadores
-
 Citado por SciELO
Links relacionados
-
 Similares en
SciELO
Similares en
SciELO
Compartir

 Permalink
Revista Peruana de Medicina Experimental y Salud Publica
versión impresa ISSN 1726-4634versión On-line ISSN 1726-4642
Rev. perú. med. exp. salud publica vol.38 no.2 Lima abr./jun. 2021 Epub 05-Abr-2021
http://dx.doi.org/10.17843/rpmesp.2021.382.6562
Original articles
Chest computed tomography findings associated with severity and mortality in patients with COVID-19
, Physician specialized in Radiology http://orcid.org/0000-0003-1944-9345
, Resident Physician of Radiologyhttp://orcid.org/0000-0003-0547-7249
, Physician specialized in Radiology, Master in Medicinehttp://orcid.org/0000-0001-5952-5141
, Physician, Master in Biomedical Informatics in Global Healthhttp://orcid.org/0000-0003-4840-2191
, Physician specialized in Radiologyhttp://orcid.org/0000-0002-9642-3600
, Physician specialized in Radiologyhttp://orcid.org/0000-0003-2510-5506
1 Departamento de Imagenología, Hospital Nacional Edgardo Rebagliati Martins, Lima, Perú.
2 Facultad de Medicina «Alberto Hurtado», Universidad Peruana Cayetano Heredia, Lima, Perú.
Objectives:
To determine chest CT findings associated with severity and mortality in patients with COVID-19 from the Hospital Nacional Edgardo Rebagliati Martins (HNERM) and propose cut-off values for a tomographic severity score (TSS).
Materials and Methods:
A retrospective cohort study was conducted in 254 patients with COVID-19 who underwent chest CT as part of their initial evaluation at the emergency room; they were classified according to clinical severity. Main tomographic findings were described. A multivariate analysis with logistic regression was carried out to determine association with clinical severity, the Cox model was used to evaluate mortality, and ROC curves were elaborated to assess cutoff values for the TSS.
Results:
CT findings associated with clinical severity were the following: diffuse pattern (OR: 3.23, 95% CI: 1.46-7.14), crazy-paving pattern (OR: 2.48; 95% CI: 1.08-5.68), and high TSS value (OR: 1.73; 95% CI: 1.49-2.02). The crazy-paving pattern (HR: 1.78; 95% CI: 1.03-3.06) and a high TSS value (HR: 1.33; 95% CI: 1.20-1.48) were found to be associated with mortality. A value of 7 in the TSS showed a sensibility of 94.4% and a specificity of 100% for moderate disease, and a value of 13 showed a sensibility of 84.9% and a specificity of 70.6% for severe disease.
Conclusions:
The diffuse pattern is associated with higher clinical severity. The crazy-paving pattern and a high TSS value are associated with higher clinical severity and mortality. We propose TSS cutoff values of 7 and 13 for moderate and severe disease, respectively.
Keywords: COVID-19; SARS-CoV-2; Pneumonia; Tomography; Severity of Illness Index; Mortality
INTRODUCTION
In December 2019, the new severe acute respiratory syndrome coronavirus 2 (SARS-CoV-2) produced the first outbreak of a pneumonic disease known as COVID19 in Wuhan, China; which became pandemic in March 2020 1 - 4.
Chest computed tomography (CT) has been proved to be useful for evaluating patients with moderate and severe disease, as well as those with impaired respiratory function. Accordingly, the Fleischner Society 5 ) recommends the use of CT in these groups of patients, and not in asymptomatic patients or patients with mild disease, as a screening test.
Several studies 6 - 10 have evaluated the diagnostic performance of CT and the reference test (reverse transcriptase polymerase chain reaction [RT-PCR]), and have reported a combined sensitivity and specificity of 94% and 37%, respectively 11. The main tomographic findings ( 12 - 15 ) are the presence of ground-glass opacities, consolidations and “crazy-paving” pattern of bilateral peripheral distribution; while the presence of pleural effusion and adenopathies have been infrequently reported.
Other studies 16 - 20 have evaluated the relationship between tomographic findings and the degree of clinical severity, as well as the risk of death, and have proposed different tomographic scores to assess the extent of pulmonary involvement. Among them, the tomographic severity score (TSS), proposed by Li et al. 16, is the most practical and feasible to apply; however, the authors suggest a single cut-off point of 7.5 to determine severe-critical disease. This model does not fit the clinical severity classification (mild, moderate and severe) applied to our patients 21, so it is important to validate this tomographic score in our country.
The aim of this study was to determine the pulmonary tomographic findings associated with severity and mortality in patients with COVID-19 from the Hospital Nacional Edgardo Rebagliati Martins (HNERM) in Lima, Peru, and to propose cut-off points for the TSS.
KEY MESSAGES
Motivation for the study: Tomographic findings related to greater severity and mortality in patients with COVID-19 in Peru are not known.
Main findings: The diffuse pattern of lesions was associated with greater clinical severity. The “crazy-paving” pattern and a higher TSS value were associated with greater clinical severity and mortality. Values of 7 and 13 are proposed as cut-off points for the TSS to identify moderate and severe cases.
Implications: The results of this study would help to improve the clinical evaluation of patients with COVID-19 in the hospital setting.
MATERIALS AND METHODS
Population, study design and data collection
A retrospective cohort study was carried out. We included all patients over 18 years of age treated between April 1 and 30, 2020 in the emergency department of HNERM in Lima, Peru, who were confirmed cases of COVID-19 and who had chest CT scans requested during their initial evaluation.
We used the operational definition by the Ministry of Health (MINSA) 21 ) and, therefore, the suspected cases who had positive molecular or serological test for SARS-CoV-2 infection were considered as confirmed cases. Patients who had incomplete data in their clinical record or a CT scan with important artifacts that limited their evaluation were excluded. Thus, out of 309 patients with a chest CT scan and confirmed diagnosis, 53 with incomplete data and two with significant artifacts were excluded, resulting in a total of 254 patients (Annex 1).
Demographic and clinical variables were obtained from the electronic medical record, such as age in years (>60 years, ≤60 years), sex (female, male), clinical severity (mild, moderate, severe), time of illness in days, symptoms (dyspnea, fever ≥38 °C, cough, malaise, sore throat, diarrhea), comorbidities (arterial hypertension, diabetes mellitus (DM), obesity, chronic kidney disease, asthma) and time of hospitalization in days.
Laboratory data were collected, such as leukocytes (x103/uL), lymphocytes (x103/uL), aspartate aminotransferase (AST) (U/L), alanine aminotransferase (ALT) (U/L), lactate dehydrogenase (LDH) (U/L), prothrombin time (PT) (s), activated partial thromboplastin time (APTT) (s), creatinine (mg/dl), C-reactive protein (mg/dl), serum ferritin (ng/ml) and D-dimer (ug/ml).
Clinical severity was determined according to the guidelines established by MINSA ( 21: in mild cases there were at least two signs or symptoms of COVID-19; in moderate cases there were at least one hospitalization criterion (dyspnea, respiratory frequency (RF) > 22 breaths per minute (bpm), oxygen saturation <95%, altered level of consciousness, hypotension, signs of pneumonia, lymphocyte count <1000 cells/μL) and in severe cases there were signs of sepsis and/or respiratory failure (at least two of RF >22 bpm, PaCO2 <32 mmHg, altered level of consciousness, hypotension, PaO2 <60 mmHg or P/F ratio <300, clinical signs of muscle fatigue, serum lactate >2 mOsm/L).
Image collection and analysis
Chest CT scans were carried out in the hospital with the patient in the supine position, contrast material was not used, in a Toshiba Aquilion Prime tomograph with 80 detector rows and multislice system.
Image analysis was carried out by two radiologists with 3 and 21 years of experience (JCG and MM), who used the tomographic terms listed in the Fleischner Society glossary 22. The following tomographic findings were registered: ground-glass opacities, consolidations, crazypaving pattern, interlobular interstitial thickening (IIT), “reverse halo” sign, parenchymal bands, air bronchogram, pleural effusion, adenopathy (mediastinal lymph node with short axis >10 mm) and the “subpleural preservation” sign (1-2 mm region of non-opacified subpleural lung parenchyma). The distribution of the lesions (peripheral, central or mixed), their pattern (patchy or diffuse), as well as the number of lung lobes involved were also registered. The TSS was calculated by assigning a value between 0 and 4 to each of the five lung lobes according to their degree of involvement: 0 (0%), 1 (1-25%), 2 (26-50%), 3 (5175%) and 4 (76-100%), and the sum of these values determined the final score, with values between 0 and 20 16.
Statistical analysis
Quantitative variables were expressed as mean and standard deviation (SD) or as median and interquartile range (IQR), while categorical variables were expressed as percentages.
For qualitative variables, Fisher’s exact test or the Chi-square test were used to determine differences between survivors and deceased. The normality of quantitative variables was assessed by using histograms and the Jarque-Bera test. If the distribution was normal, the Student’s t-test was used; otherwise, the Wilcoxon rank sum test was used.
We used an intraclass correlation coefficient (ICC) to assess the consistency between both observers in the assessment of TSS. Likewise, ROC curves were constructed to determine the cut-off points with the highest combination of sensitivity and specificity to identify moderate and severe cases.
The tomographic findings associated with clinical severity were evaluated using a multivariate logistic regression model, grouping the mild and moderate categories and comparing them with the severe cases category. The model was adjusted for variables such as age, sex, time of illness, and comorbidities, such as arterial hypertension (AHT), obesity and diabetes mellitus, since they are recognized risk factors for severe and mortal cases in patients with COVID19 23 - 26.
To determine the tomographic findings associated with mortality in patients with severe disease, we carried out a multivariate Cox regression analysis adjusted for the same variables of the logistic model, obtaining hazard ratios (HR) for mortality. The proportionality of the HR of each parameter and of the overall model was verified using the Schoenfeld residuals plot and the nonzero slope test. Survival time in days was counted from the day of patient admission to the eventual death, hospital discharge or end of the follow-up period (86 days). Statistical analysis was carried out using Stata version 16.1.
Ethical aspects
This study was approved by the Specific Research Ethics Committee for COVID-19 of EsSALUD and the Institutional Research Ethics Committee (IREC) of the Universidad Peruana Cayetano Heredia (certificate E086-16-20) under the category of “exempt from review”. The application of an informed consent form was not required since the study only included the review of clinical records and tomographic results, preserving patient confidentiality.
RESULTS
Demographic, clinical and laboratory characteristics
Of the 254 patients included in the study, 137 (53.9%) had positive RT-PCR and 117 (46.1%) had positive serology; 173 (68.1%) were male and 81 (31.9%) female; median age was 59.1 (SD: 14.7 years). Regarding clinical severity, 13 (5.1%) cases were mild, 89 (35.0%) moderate and 152 (59.9%) severe. At the end of the follow-up period, 158 (62.2%) patients were discharged, 95 (37.4%) died and 1 (0.4%) remained in the intensive care unit (ICU). The remaining demographic and clinical variables are shown in Table 1.
Table 1 Demographic and clinical characteristics of patients with COVID-19 from the Hospital Nacional Edgardo Rebagliati Martins, April 2020.
| Characteristics | Total | Deceased | Survivors | p value |
|---|---|---|---|---|
| (254 cases) | (95 cases) | (159 cases) | ||
| n (%) | n (%) | n (%) | ||
| Age (years), mean (SD) | 59.1 (14.7) | 66.7 (12.2) | 54.6 (14.2) | <0.001 a |
| >60 | 125 (49.2) | 72 (75.8) | 53 (33.3) | <0.001 b |
| ≤60 | 129 (50.8) | 23 (24.2) | 106 (66.7) | |
| Sex | 0.232 b | |||
| Male | 173 (68.1) | 69 (72.6) | 104 (65.4) | |
| Female | 81 (31.9) | 26 (27.4) | 55 (34.6) | |
| Clinical severity | NC | |||
| Mild | 13 (5.1) | 0 | 13 (8.2) | |
| Moderate | 89 (35.0) | 1 (1.1) | 88 (55.3) | |
| Severe | 152 (59.9) | 94 (98.9) | 58 (36.5) | |
| Time of illness (days), mean (SD) | 10.2 (5.2) | 10,3 (5.2) | 10.1 (5.3) | 0.622 a |
| Symptoms | ||||
| Dyspnea | 229 (90.2) | 93 (97.9) | 136 (85.5) | 0.001 b |
| Fever ≥ 38 °C | 215 (84.7) | 73 (76.8) | 142 (89.3) | 0.008 b |
| Cough | 215 (84.7) | 79 (83.2) | 136 (85.5) | 0.611 b |
| General malaise | 167 (65.8) | 63 (66.3) | 104 (65.4) | 0.883 b |
| Sore throat | 67 (26.4) | 28 (29.5) | 39 (24.5) | 0.387 b |
| Diarrhea | 43 (16.9) | 9 (9.5) | 34 (21.4) | 0.014 b |
| Comorbidities | ||||
| AHT | 79 (31.1) | 39 (41.1) | 40 (25.2) | 0.008 b |
| Diabetes mellitus | 47 (18.5) | 22 (23.2) | 25 (15.7) | 0.140 b |
| Obesity | 40 (15.8) | 19 (20.0) | 21 (13.2) | 0.150 b |
| CKD | 13 (5.1) | 8 (8.4) | 5 (3.1) | <0.001 c |
| Asthma | 11 (4.3) | 2 (2.1) | 9 (5.7) | 0.218 c |
| Time of hospitalization (days), median (IQR) | 11 (6-20) | 7 (4-12) | 13 (8-23) | <0.001 d |
SD: standard deviation; IQR: interquartile range; AHT: arterial hypertension; CKD: chronic kidney disease; NC: not calculated.
a Student’s T test, b Chi-square test, c Fisher’s exact test, d Wilcoxon rank sum test.
The variables that showed significant differences between survivors and deceased were age, dyspnea, fever, diarrhea, AHT and length of hospitalization (Table 1). The laboratory tests evaluated at admission that showed significant differences between survivors and deceased were leukocytes, lymphocytes, LDH, PT, APTT, creatinine, C-reactive protein, serum ferritin and D-dimer (Annex 2).
Tomographic findings
Of the 254 chest CT scans, 243 (95.7%) showed ground-glass opacities; 200 (78.7%), consolidations; 184 (72.4%), “subpleural preservation”; 182 (71.7%), IIT; 120 (47.2%), air bronchograms; 90 (35.4%), “crazy-paving” pattern, and 47 (18.5%), parenchymal bands. Adenopathies were observed in 15 (5.9%) patients, pleural effusion in 7 (2.8%) and the “reverse halo” sign in 5 (2.0%). The most frequent lung lesions had mixed distribution (78.3%), followed by those with a diffuse pattern (74%) and those with patchy pattern (26%).
The “subpleural preservation” sign, IIT, “crazy-paving” pattern, adenopathy, mixed distribution and diffuse pattern of lesions were more frequent in the deceased; while parenchymal bands, peripheral distribution of lesions and patchy pattern were more frequent in the survivors. All these findings showed significant difference between both groups (Table 2).
Table 2 Tomographic findings in patients with COVID-19, deceased and survivors from the Hospital Nacional Edgardo Rebagliati Martins, April 2020.
| Tomographic findings | Total (254 cases) | Deceased (95 cases) | Survivors (159 cases) | p value |
|---|---|---|---|---|
| n (%) | n (%) | n (%) | ||
| Ground-glass opacities | 243 (95.7) | 94 (99.0) | 149 (93.7) | 0.047 a |
| Consolidations | 200 (78.7) | 76 (80.0) | 124 (78.0) | 0.704 a |
| “Subpleural preservation” | 184 (72.4) | 77 (81.1) | 107 (67.3) | 0.018 a |
| IIT | 182 (71.7) | 80 (84.2) | 102 (64.2) | 0.001 a |
| Air bronchogram | 120 (47.2) | 47 (49.5) | 73 (45.9) | 0.582 a |
| “Crazy-paving” | 90 (35.4) | 59 (62.1) | 31 (19.5) | <0.001 a |
| Parenchymal bands | 47 (18.5) | 3 (3.16) | 44 (27.7) | <0.001 b |
| Adenopathies | 15 (5.9) | 10 (10.5) | 5 (3.1) | 0.025 b |
| Pleural effusion | 7 (2.8) | 4 (4.2) | 3 (1.9) | 0.430 b |
| “Reverse halo” sign | 5 (2.0) | 0 | 5 (3.1) | NC |
| Distribution | <0.001 b | |||
| Mixed | 199 (78.3) | 86 (90.5) | 113 (71.1) | |
| Peripheral | 49 (19.3) | 8 (8.4) | 41 (25.8) | |
| Central | 6 (2.4) | 1 (1,1) | 5 (3.1) | |
| Pattern | <0.001 a | |||
| Diffuse | 188 (74.0) | 86 (90.5) | 102 (64.2) | |
| Patchy | 66 (26.0) | 9 (9.5) | 57 (35.8) | |
| TSS, median (IQR) | 13 (11-15) | 16 (14-17) | 12 (9-14) | <0.001 c |
IQR: interquartile range, IIT: interlobular interstitial thickening, TSS: tomographic severity score, NC: not calculated.
a Chi-square test, b Fisher’s exact test, c Wilcoxon rank sum test.
Regarding the extent of pulmonary involvement, we observed bilateral involvement in 250 (98.4%) cases; the five pulmonary lobes were more frequently involved together (94.5%), and of these, the right lower lobe (RLL) was the most frequently involved (61.4%) (Annex 3).
Tomographic severity score (TSS)
The application of the TSS by both evaluators showed an adequate repeatability analysis with an ICC of 0.93 (95% CI: 0.85-0.97). The median TSS value in the 254 cases was 13 (IQR: 11-15); for the survivors it was 12 (IQR: 9-14) and for the deceased it was 16 (IQR: 14-17), a significant difference was found between both groups, p<0.001 (Table 2). Regarding the degree of clinical severity, the median TSS value for moderate cases was 11 (IQR: 9-13) and for severe cases it was 15 (IQR: 13-16) (Table 3).
Table 3 Tomographic findings associated with severe cases in patients with COVID-19 seen at the Hospital Nacional Edgardo Rebagliati Martins, April 2020.
| Tomographic findings | Mild and moderate (102 cases) | Severe (152 cases) | COR (95% CI) | AOR (95% CI) |
|---|---|---|---|---|
| n (%) | n (%) | |||
| Consolidations | 76 (74.5) | 124 (81.6) | 1.51 (0.83-2.75) | 1.02 (0.41-2.50) |
| “Subpleural preservation” | 63 (61.8) | 121 (79.6) | 2.42 (1.38-4.24) | 1.79 (0.87-3.69) |
| IIT | 58 (56.9) | 124 (81.6) | 3.36 (1.91-5.92) | 1.81 (0.83-3.94) |
| Air bronchogram | 38 (37.3) | 82 (53.9) | 1.97 (1.18 -3.29) | 1.68 (0.82-3.45) |
| “Crazy-paving” | 16 (15.7) | 74 (48.7) | 5.10 (2.74-9.50) | 2.48 (1.08-5.68) |
| Parenchymal bands | 33 (32.4) | 14 (9.2) | 0.21 (0.10-0.42) | 0.34 (0.14-0.75) |
| Distribution | ||||
| Peripheral | 34 (33.3) | 15 (9.9) | 0.21 (0.11-0.42) | 0.57 (0.24-1.34) |
| Central | 3 (3.0) | 3 (2.0) | 0.49 (0.10-2.47) | 0.92 (0.14-6.07) |
| Mixed | 65 (63.7) | 134 (88.2) | 1 | 1 |
| Pattern | ||||
| Diffuse | 54 (52.9) | 134 (88.2) | 6.62 (3.53-12.39) | 3.23 (1.46-7.14) |
| Patchy | 48 (47.1) | 18 (11.8) | 1 | 1 |
| TSS | 10 (8-13) a | 15 (13-16) a | 1.76 (1.52-2.03) b | 1.73 (1.49-2.02) b |
IIT: interlobular interstitial thickening, TSS: tomographic severity score. COR: crude bivariate odds ratio (each tomographic finding independently). AOR: adjusted odds ratio (all tomographic findings + covariates).
a median (interquartile range), b TSS + covariates.
Covariates: age, sex, obesity, time of illness, arterial hypertension and diabetes.
The ROC curve analysis for moderate cases showed an area under the curve (AUC) of 0.99 (95% CI: 0.98-1.00) and a cutoff point of 7 showed sensitivity of 94.4% and specificity of 100%. The ROC curve for severe cases showed an AUC of 0.86 (95% CI: 0.82-0.90) and a cutoff point of 13 showed sensitivity of 84.9% and specificity of 70.6% (Annex 4).
Figure 1. presents tomographic images of three patients included in the study, and the description of the main findings identified and the assigned TSS value.
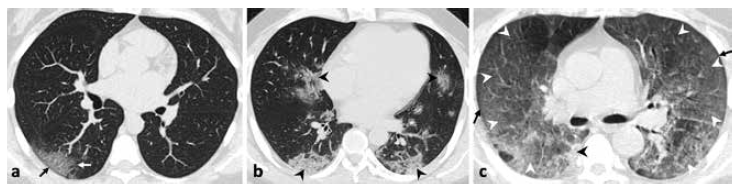
Figure 1 Axial non-contrast chest tomography (a, b, c). a) 31-year-old woman with fever, malaise and diarrhea. There are ground-glass opacities (white arrow) with peripheral distribution, and the sign of “subpleural preservation” (black arrow); tomographic severity score (TSS): 2. b) 45-year-old male with fever, cough, dyspnea, diarrhea and chest pain. There are consolidations (black arrows) with central and peripheral distribution; TSS: 9. c) 45-year-old male with fever and dyspnea. There are extensive areas of “crazy-paving” pattern (white arrows) and with diffuse pattern in both lungs, as well as the sign of subpleural preservation (black arrow) and consolidation (black arrow), TSS: 19.
Multivariate analysis, Cox regression and Kaplan-Meier survival curve
The tomographic findings associated with clinical severity were the diffuse pattern (OR: 3.23; 95% CI: 1.46-7.14), “crazy-paving” pattern (OR: 2.48; 95% CI: 1.08-5.68) and a higher value in TSS (OR: 1.73; 95% CI: 1.49-2.02) (Table 3).
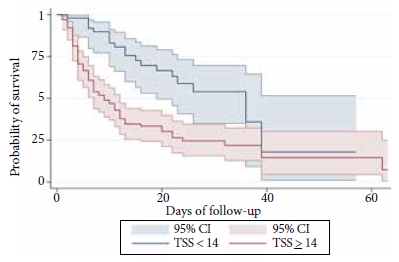
The tomographic findings associated with higher mortality in severe patients according to the Cox regression analysis of survival were the presence of “crazy-paving” pattern (HR: 1.78; 95% CI: 1.03-3.06) and a higher TSS value (HR: 1.33; 95% CI: 1.20-1.48) (Table 4). In addition, we identified that survival in severe patients, after 86 days of follow-up, was lower in those with TSS values ≥14 compared to those with TSS values <14. This result is shown in the Kaplan Meier curve presented in Figure 2.
Table 4 Tomographic findings associated with mortality in severe cases of patients with COVID-19 from the Hospital Nacional Edgardo Rebagliati Martins, April 2020.
| Tomographic findings | CHR (95% CI) | AHR (95% CI) |
|---|---|---|
| “Subpleural preservation” | 0.84 (0.50-1.42) | 0.85 (0.50-1.48) |
| IIT | 0.66 (0.33-1.30) | 0.67 (0.34-1.34) |
| “Crazy-paving” | 2.35 (1.40-3.93) | 1.78 (1.03-3.06) |
| Distribution | ||
| Mixed | 1 | 1 |
| Peripheral | 0.68 (0.31-1.51) | 0.72 (0.31-1.68) |
| Central | 1.11 (0.15-8.38) | 1.34 (0.17-10.34) |
| Pattern | ||
| Diffuse | 1.22 (0.57-2.61) | 1.23 (0.54-2.80) |
| TSS | ||
| Continuous | 1.33 (1.19-1.47) a | 1.33 (1.20-1.48) a |
IIT: interlobular interstitial thickening, TSS: tomographic severity score.
CHR: crude Hazard ratio.
AHR: adjusted Hazard ratio (all tomographic findings + covariates).
a TSS + covariates.
Covariates: age, sex, obesity, time of disease, arterial hypertension and diabetes.
DISCUSSION
The most frequent tomographic findings were ground-glass opacities and consolidations; the least frequent were adenopathies and pleural effusion. The findings associated with clinical severity were the diffuse pattern of lesions, “crazy-paving” pattern and higher TSS value; while the findings associated with mortality in severe cases were “crazy-paving” pattern and higher TSS value. A TSS value of 7 showed sensitivity of 94.4% and specificity of 100% to identify moderate cases, and a value of 13 showed sensitivity of 84.9% and specificity of 70.6% to identify severe cases.
Of the demographic and clinical variables evaluated, diabetes mellitus and obesity did not show significant differences between survivors and deceased, unlike to what has been described in international reports 23 - 26. This finding could be explained by the underreporting of these comorbidities in medical records of the patients during initial evaluation in the emergency room.
The higher frequency of ground glass opacities and consolidations coincides with the findings described by multiple studies carried out in other countries since the beginning of the pandemic 6 - 10. The “reverse halo” sign was an infrequent finding (2.0%), similar to what was described by Bernheim 12 but opposite to the 10% reported by Tabatabaei et al 27. The “subpleural preservation” sign was observed quite frequently (72.4%) in this study; it is a sign classically described in nonspecific interstitial pneumonia, pulmonary contusion and other viral infections such as influenza, but has also been reported by some authors ( 15 , 28 ) in cases of pneumonia by COVID-19.
The mixed distribution (central and peripheral) and the diffuse pattern of lesions observed in most cases could be explained by the large number of patients with moderate or severe disease included in the study. In contrast, cases with mild disease showed mainly a peripheral distribution of lesions as well as the patchy pattern. Regarding the involvement of the pulmonary lobes, the RLL was the most frequently affected lobe (61.4%), in contrast to that reported by Long et al. 8, who found that the left lower lobe (LLL) was affected in most cases (66.7%).
Regarding TSS, the study published by Li et al. 16 proposed a value of 7.5 to identify cases of severe-critical disease with a sensitivity of 82.6% and specificity of 100%. In our country, we use a different clinical severity classification: mild, moderate and severe cases 21; therefore, this study determined a TSS value of 7 to identify moderate cases and 13 for severe cases, both with adequate sensitivity and specificity.
The tomographic findings associated with greater severity and mortality, such as the diffuse pattern of the lesions and a higher TSS value, coincide with those described in other studies. These studies mention that greater pulmonary involvement, assessed by different tomographic scores, is related to a greater probability of admission to the ICU and higher mortality 16 , 17. Likewise, the “crazy-paving” pattern has also been associated with more severe clinical pictures in some studies 20 , 27. The analysis of the tomographic findings associated with mortality was conducted only in the group of severe patients because almost all the deceased (98.9%) were from this group of patients.
No association was found between the presence of consolidations and the degree of clinical severity or mortality risk, in contrast to what was reported by authors such as Li et al. ( 29, but similar to what was found by Zhou et al. 24; probably because, according to the progression of the tomographic findings described by Pan et al 18, the presence of consolidations would depend more on the time of evolution of the disease, than on the severity of the clinical picture.
One of the limitations of this study is the small number of patients included with mild disease, due to the fact that the study was carried out in a national referral institution, which receives a higher proportion of moderate and severe cases. However, it should be noted that the usefulness of chest CT is greater in this group of patients, and minimal in patients with mild disease. In addition, patients with a positive serological test were included because this criterion was part of the MINSA guidelines for the diagnosis of COVID-19, considering also that all patients included had a clinical picture and tomographic representation of this disease. Finally, the treatment received by the patients was not included among the studied variables, because the severity was determined based on the initial evaluation recorded in the emergency room, and because there was no reference scheme for the treatment of this disease at the time of the study.
In conclusion, the diffuse pattern of lesions was associated with greater clinical severity. The “crazy-paving” pattern and a higher TSS value were associated with greater clinical severity and also with mortality. Values of 7 and 13 are proposed as cut-off points for TSS to identify moderate and severe cases of COVID-19.
The results obtained in this study should be used to complement the evaluation of patients with COVID-19 in the hospital setting. We also recommend the development of further studies in our country to evaluate the relation of pulmonary tomographic findings with mortality, including the treatments that so far have been shown to have influence on mortality.
Acknowledgments:
The authors thank Dr. Malú Arias Schreiber, Dr. Johnni Huamán and Dr. Henry Tito for their critical assessment of this study, as well as all the health personnel at the Hospital Nacional Edgardo Rebagliati Martins who work on the front line caring for patients affected by COVID-19.
REFERENCES
. Huang C, Wang Y, Li X, Ren L, Zhao J, Hu Y, et al. Clinical features of patients infected with 2019 novel coronavirus in Wuhan, China. Lancet. 2020;395(10223):497-506. doi: 10.1016/S0140-6736(20)30183-5. [ Links ]
. Zhu N, Zhang D, Wang W, Li X, Yang B, Song J, et al. A Novel Coronavirus from Patients with Pneumonia in China, 2019. N Engl J Med. 2020;382:727-33. doi: 10.1056/NEJMoa2001017. [ Links ]
. Organización Mundial de la Salud [Internet]. Ginebra: OMS; 2020 [citado el 29 de abril del 2020]. Discursos del Director General de la OMS. Disponible en: https://www.who.int/es/dg/speeches/detail/who-director-general-s-remarks-at-the-media-briefing-on-2019-ncovon-11-february-2020. [ Links ]
. Organización Mundial de la Salud [Internet]. Ginebra: OMS; 2020 [citado el 29 de abril del 2020]. La OMS caracteriza a COVID-19 como una pandemia; Disponible en: https://www.paho.org/es/noticias/11-3-2020-oms-caracteriza-covid-19-como-pandemia. [ Links ]
. Rubin GD, Ryerson CJ, Haramati LB, Sverzellati N, Kanne JP, Raoof S, et al. The Role of Chest Imaging in Patient Management during the COVID-19 Pandemic: A Multinational Consensus Statement from the Fleischner Society. Radiology. 2020;296(1):172-180. doi: 10.1148/radiol.2020201365. [ Links ]
. Ai T, Yang Z, Hou H, Zhan C, Chen C, Lv W, et al. Correlation of Chest CT and RT-PCR Testing in Coronavirus Disease 2019 (COVID-19) in China: A Report of 1014 Cases. Radiology. 2020;296(2):E32-E40. doi: 10.1148/radiol.2020200642. [ Links ]
. Xie X, Zhong Z, Zhao W, Zheng C, Wang F, Liu J. Chest CT for Typical 2019-nCoV Pneumonia: Relationship to Negative RT-PCR Testing. Radiology. 2020;296(2):E41-E45. doi: 10.1148/radiol.2020200343. [ Links ]
. Long C, Xu H, Shen Q, Zhang X, Fan B, Wang C, et al. Diagnosis of the Coronavirus disease (COVID-19): rRT-PCR or CT?. Eur J Radiol. 2020;126:108961. doi: 10.1016/j.ejrad.2020.108961. [ Links ]
. Caruso D, Zerunian M, Polici M, Pucciarelli F, Polidori T, Rucci C, et al. Chest CT Features of COVID-19 in Rome, Italy. Radiology. 2020;296(2):E79-E85. doi: 10.1148/radiol.2020201237. [ Links ]
. Fang Y, Zhang H, Xie J, Lin M, Ying L, Pang P, et al. Sensitivity of Chest CT for COVID-19: Comparison to RT-PCR. Radiology. 2020;296(2):E115-E117. doi: 10.1148/radiol.2020200432. [ Links ]
. Kim H, Hong H, Yoon SH. Diagnostic Performance of CT and Reverse Transcriptase-Polymerase Chain Reaction for Coronavirus Disease 2019: A Meta-Analysis. Radiology. 2020. doi: 10.1148/radiol.2020201343. [ Links ]
. Bernheim A, Mei X, Huang M, Yang Y, Fayad ZA, Zhang N, et al. Chest CT Findings in Coronavirus Disease-19 (COVID-19): Relationship to Duration of Infection. Radiology. 2020;295(3). doi: 10.1148/radiol.2020200463. [ Links ]
. Ding X, Xu J, Zhou J, Long Q. Chest CT findings of COVID-19 pneumonia by duration of symptoms. Eur J Radiol. 2020;127. doi: 10.1016/j.ejrad.2020.109009. [ Links ]
. Chung M, Bernheim A, Mei X, Zhang N, Huang M, Zeng X, et al. CT Imaging Features of 2019 Novel Coronavirus (2019-nCoV). Radiology. 2020;295(1):202-7. doi: 10.1148/radiol.2020200230. [ Links ]
. Prokop M, van Everdingen W, van Rees Vellinga T, Quarles van Ufford J, Stöger L, Beenen L, et al. CO-RADS - A categorical CT assessment scheme for patients with suspected COVID-19: definition and evaluation. Radiology. 2020;296(2):E97-E104. doi: 10.1148/radiol.2020201473. [ Links ]
. Li K, Fang Y, Li W, Pan C, Qin P, Zhong Y, et al. CT image visual quantitative evaluation and clinical classification of coronavirus disease (COVID-19). Eur Radiol. 2020;30:4407-4416. doi: 10.1007/s00330-02006817-6. [ Links ]
. Francone M, Iafrate F, Masci GM, Coco S, Cilia F, Manganaro L, et al. Chest CT score in COVID-19 patients: correlation with disease severity and short-term prognosis. Eur Radiol 2020. doi: 10.1007/s00330-020-07033-y. [ Links ]
. Pan F, Ye T, Sun P, Gui S, Liang B, Li L, et al. Time Course of Lung Changes at Chest CT during Recovery from Coronavirus Disease 2019 (COVID-19). Radiology. 2020;295(3):715-721. doi: 10.1148/radiol.2020200370. [ Links ]
. Yang R, Li X, Liu H, Zhen Y, Zhang X, Xiong Q, et al. Chest CT Severity Score: An Imaging Tool for Assessing Severe COVID-19. Radiol Cardiothorac Imaging 2020;2(2):e200047. doi: 10.1148/ryct.2020200047. [ Links ]
. Zhang R, Ouyang H, Fu L, Wang S, Han J, Huang K, et al. CT features of SARS-CoV-2 pneumonia according to clinical presentation: a retrospective analysis of 120 consecutive patients from Wuhan city. Eur Radiol. 2020;30(8):4417-4426. doi: 10.1007/s00330-020-06854-1. [ Links ]
. Ministerio de Salud. Documento técnico Prevención Diagnóstico y Tratamiento de personas afectadas por COVID-19 en el Perú [Internet]. Lima: MINSA; 2020 [Citado el 29 de abril del 2020]. Disponible en: https://www.gob.pe/institucion/minsa/informes-publicaciones/473587-prevencion-diagnostico-y-tratamiento-de-personas-afectadas-por-covid-19-en-el-peru. [ Links ]
. Hansell DM, Bankier AA, MacMahon H, McLoud TC, Müller NL, Remy J. Fleischner Society: Glossary of Terms for Thoracic Imaging. Radiology. 2008;246(3):697-722. doi: 10.1148/radiol.2462070712. [ Links ]
. Li X, Xu S, Yu M, Wang K, Tao Y, Zhou Y, et al. Risk factors for severity and mortality in adult COVID-19 inpatients in Wuhan. Journal of Allergy and Clinical Immunology. 2020;146(1)110-118. doi: 10.1016/j. jaci.2020.04.006. [ Links ]
. Zhou F, Yu T, Du R, Fan G, Liu Y, Liu Z, et al. Clinical course and risk factors for mortality of adult inpatients with COVID-19 in Wuhan, China: a retrospective cohort study. The Lancet. 2020;395(10229):1054-1062. doi: 10.1016/S0140-6736(20)30566-3. [ Links ]
. Albitar O, Ballouze R, Ooi JP, Ghadzi SMS. Risk factors for mortality among COVID-19 patients. Diabetes Research and Clinical Practice. 2020;166:e108293. doi: 10.1016/j.diabres.2020.108293. [ Links ]
. Mikami T, Miyashita H, Yamada T, Harrington M, Steinberg D, Dunn A, et al. Risk Factors for Mortality in Patients with COVID-19 in New York City. J Gen Intern Med. 2021;36:17-26. doi: 10.1007/s11606-020-05983-z. [ Links ]
. Tabatabaei SMH, Talari H, Moghaddas F, Rajebi H. Computed Tomographic Features and Short-term Prognosis of Coronavirus Disease 2019 (COVID-19) Pneumonia: A Single-Center Study from Kashan, Iran. Radiol Cardiothorac Imaging. 2020;2(2):e200130. doi: 10.1148%2Fryct.2020200130. [ Links ]
. Wu J, Pan J, Teng D, Xu X, Feng J, Chen Y. Interpretation of CT signs of 2019 novel coronavirus (COVID-19) pneumonia. Eur Radiol. 2020;30(10):5455-5462. doi: 10.1007/s00330-020-06915-5. [ Links ]
. Li K, Wu J, Wu F, Guo D, Chen L, Fang Z, et al. The Clinical and Chest CT Features Associated With Severe and Critical COVID-19 Pneumonia. Investive Radiology. 2020;55(6):327-331. doi: 10.1097/rli.0000000000000672. [ Links ]
Cite as: Contreras-Grande J, Pineda-Borja V, Díaz H, Calderon-Anyosa RJC, Rodríguez B, Morón M. [Chest computed tomography findings associated with severity and mortality in patients with COVID-19]. Rev Peru Med Exp Salud Publica. 2021;38(2):206-13. doi: https://doi.org/10.17843/rpmesp.2021.382.6562.
Received: October 12, 2020; Accepted: March 03, 2021
 Este es un artículo publicado en acceso abierto bajo una licencia Creative Commons
