


Services on Demand
Journal

Article
 text in
  English (pdf)
 Article in xml format
 Article references
 Send this article by e-mail
Indicators
-
 Cited by SciELO
Related links
-
 Similars in
SciELO
Similars in
SciELO
Share

 Permalink
Revista Peruana de Medicina Experimental y Salud Publica
Print version ISSN 1726-4634On-line version ISSN 1726-4642
Rev. perú. med. exp. salud publica vol.40 no.2 Lima Apr./Jun. 2023 Epub June 30, 2023
http://dx.doi.org/10.17843/rpmesp.2023.402.12472
Original article
Serological surveillance of parasitic zoonoses in 13 highlands regions of Peru: Period 2016-2019
1
, Biologist http://orcid.org/0000-0002-8684-767X
1
, Biologisthttp://orcid.org/0000-0001-7380-8885
1
, Biologisthttp://orcid.org/0000-0001-7031-1136
2
, veterinarianhttp://orcid.org/0000-0002-6818-7612
1
, Biologisthttp://orcid.org/0000-0002-1946-6287
1
, Biologisthttp://orcid.org/0000-0001-8179-1657
3
, dentisthttp://orcid.org/0000-0001-7084-088X
1 National Referral Laboratory for Metaxenics and Parasitic Zoonoses, Instituto Nacional de Salud, Lima, Peru.
2 Directorate of Prevention and Control of Metaxenic Diseases and Zoonoses of the General Directorate of Strategic Interventions in Public Health, Ministerio de Salud, Lima, Peru.
3 Universidad Científica del Sur, Lima, Peru.
Objectives.
To determine seropositivity to anti-IgG antibodies against Echinococcus granulosus, Fasciola hepatica and Taenia solium cysticercus infection and to describe the characteristics of the infected patients in 13 regions of the Peruvian highlands between 2016 and 2019.
Materials and methods.
Cross-sectional, observational study, in which we analyzed 7811 epidemiological records of laboratory-based surveillance of parasitic zoonoses from 2016 to 2019. Diagnosis was established by detecting IgG type anti-E. granulosus, F. hepatica and T. solium cysticercus antibodies using native antigens by enzyme-linked immunosorbent assay (ELISA) and Immunoblot. We evaluated the difference in the frequency of the cases according to identified characteristics using Pearson’s chi-square test and Fisher’s exact test.
Results.
Seropositivity was 7.9% for fascioliasis, 4.9% for cystic echinococcosis, and 2.3% for T. solium cysticercus. These rates were higher in Cerro de Pasco for cystic echinococcosis (24.5%), in Ayacucho for T. solium cysticercus (4.5%) and in Puno for fascioliasis (40.6%). Regarding the sociodemographic characteristics, we found a statistically significant difference in the frequency of cases for all zoonoses according to age group, occupation, and region of residence. We also found a difference with the consumption of vegetables in emollients, and between clinical-epidemiological characteristics and having a family history of parasitic zoonoses.
Conclusions.
From the 7811 samples, we found that these parasitic zoonoses are distributed in 13 regions of the Peruvian highlands, and represent a major health problem, with frequencies that change according to different characteristics.
Keywords: Taenia solium Cysticercosis; Cystic Echinococcosis; Fascioliasis; ELISA; Seroepidemiologic Studies; Public Health Surveillance; Zoonoses; Peru
- Motivation for the study. To understand the characteristics and distribution of the main parasitic zoonoses in Peru and to generate data for decision making in surveillance, prevention and control.
- Main findings. These parasitic zoonoses are distributed in areas of extreme poverty in the central and southern highlands of Peru. Fascioliasis seropositivity was found to be higher than for echinococcosis and cysticercosis. In addition, sociodemographic characteristics and lifestyle habits influence the transmission of these zoonoses.
- Implications. An active search for these zoonoses should be carried out in other risk areas with similar epidemiological characteristics to determine the prevalence of each of these zoonoses and implement multisectoral prevention and control programs.
Keywords: Taenia solium Cysticercosis; Cystic Echinococcosis; Fascioliasis; ELISA; Seroepidemiologic Studies; Public Health Surveillance; Zoonoses; Peru
INTRODUCTION
Parasitic zoonoses are neglected diseases that are naturally transmitted from vertebrate animals to humans, the most important being zoonoses caused by helminths such as Fasciola hepatica, Echinococcus granulosus and Taenia solium1. In humans, T. solium cysticercus infection mainly affects the central nervous system (CNS), F. hepatica infection affects the bile ducts of the liver, and E. granulosus infection affects the liver and lungs. All these tissue parasitosis are asymptomatic until the chronic phase of the disease, where the main signs and symptoms begin to manifest, significantly deteriorating health 2.
These zoonoses are mainly distributed in Africa, Asia, Southern Europe and South America (3-5. In Peru, seroprevalence rates in humans of up to 20% of cystic echinococcosis were reported in Cerro de Pasco 6, 24% of T. solium cysticercus in Saylla (Cusco) 7 and up to 31% of fascioliasis in Puno 8, which are rural and cattle-raising areas of the central and southern highlands. It is estimated that, in Peru, the burden of disease per disability-adjusted life years (DALY) for human cystic echinococcosis is 1139 years with a total annual cost of 2,420,348 US dollars 9; however, there are no DALY estimates for T. solium cysticercus and human fascioliasis.
The main risk factors associated with human cystic echinococcosis, which have been reported in the Peruvian population, are exposure to infected dogs, contact with infected cattle and consumption of food contaminated with eggs of E. granulosus, which is the infecting form of the parasite 10. Human fascioliasis is associated with determinants such as exposure to infected cattle and consumption of raw vegetables exposed to irrigation water contaminated with metacercariae of F. hepatica, which is the infecting form of the trematode 11. On the other hand, the risk factors associated with T. solium cysticercus are the consumption of raw or undercooked pork contaminated with T. solium cysticercus larvae, consumption of food and water contaminated with feces of people with taeniasis through direct transmission of T. solium eggs, which is the infecting form of T. solium cysticercus12. In addition, there are common determinants for the three zoonoses such as deficient hygienic habits and unfavorable socioeconomic conditions, such as the lack of access to adequate health services, education and basic sanitation 10-12.
There are studies on the distribution of zoonoses at the national level focused on school-age children; however, neither the communities at high risk of zoonoses in the Peruvian territory nor the magnitude of the disease in the general population have been determined. For this reason, this study aimed to determine seropositivity to anti-IgG antibodies for E. granulosus, F. hepatica and T. solium cysticercus infection and to describe the characteristics of those infected in 13 regions of the Peruvian highlands between 2016 and 2019.
MATERIALS AND METHODS
Study design
We conducted an observational, quantitative, of cross-sectional study, in which we analyzed the epidemiological records of parasitic zoonoses and results obtained from the activities of laboratory-based surveillance for the identification of parasitic zoonoses, executed by the National Referral Laboratory of Parasitic Zoonoses of the National Institute of Health (LRNZOP-INS) between the years 2016 and 2019.
Study population
Epidemiological files of villagers who participated in laboratory-based epidemiological surveillance activities between 2016 and 2019 were evaluated. We included participants from 13 highland regions of Peru (Apurímac, Arequipa, Ayacucho, Cajamarca, Cerro de Pasco, Cusco, Huancavelica, Huánuco, Junín, Lima Provincias, Moquegua, Puno and Tacna), which are located between 1800 and 4100 meters above sea level, with an estimated total poverty rate between 23 and 44% 13, and are characterized by having livestock and agriculture as their main economic activity.
Sample and selection of participants
The analysis included all the available epidemiological files from each region. The assessment of the files was based on the number of inhabitants in each locality and the logistical capacity of the Regional Health Directorates (DIRESA) of the regions that implemented the surveillance activity. Screening was carried out by convenience by proactive search of participants in homes and educational institutions in each locality. The screening considered people older than five years of age and with permanent residence in endemic areas, while people with other conditions diagnosed by laboratory tests were excluded. We excluded incomplete files.
Data collection
We used data that had been previously collected for the epidemiological surveillance of parasitic zoonoses: cystic echinococcosis, fascioliasis and T. solium cysticercus (Supplementary Material), as well as the results of the serological tests of each of the screened participants registered in the NETLAB system.
The epidemiological files analyzed were prepared by LRNZOP-INS for surveillance activities. These files have been previously reviewed by technical experts, were applied by trained personnel, and were stored at LRNZOP-INS, as a tool for the elaboration of technical reports on the epidemiological situation of these parasitic diseases.
Serological data
After filling out the epidemiological record, we obtained a 5 mL sample of venous blood for the serological diagnosis by ELISA-IgG and Immunoblot-IgG. It should be noted that both diagnostic kits were produced at LRNZOP-INS. The Immunoblot method for cystic echinococcosis has a sensitivity of 95% and specificity of 100% for the 8 kDa, 16 kDa, and 21 kDa bands, using antigens from the hydatid fluid of E. granulosus. On the other hand, the immunoblot for T. solium cysticercus has a sensitivity of 93% and specificity of 100% for the bands of 13 kDa, 14 kDa, 17 kDa, 18 kDa, 23 kDa, 24 kDa, 31 kDa, and 35 kDa, using antigens from the vesicular fluid of T. solium cysticercus. Finally, the immunoblot for fascioliasis has a sensitivity of 91% and specificity of 99%, using purified antigens of 27-28 kDa from the secretion/excretion products of F. hepatica 14,15.
First, serological screening was performed for each parasite, using the ELISA-IgG method for cystic echinococcosis, fascioliasis and T. solium cysticercus, which were carried out in the Regional Reference Laboratories (LRR) of each DIRESA. Then, diagnosis was confirmed by using the Immunoblot-IgG method for cystic echinococcosis, fascioliasis, and T. solium cysticercus of the samples with REACTIVE results in the ELISA-IgG method, which were performed at the LRNZOP-INS.
Variables
The dependent variable corresponds to the categorical result (positive, negative) of the serological diagnosis of zoonoses according to the type of parasitosis. The independent variables correspond to data obtained from epidemiological files that have been of interest to other studies for this type of infections 11,16-20. These variables included information on sociodemographic characteristics, animal husbandry, slaughtering and risk practices, consumption of risky foods and beverages, and clinical and epidemiological characteristics.
The names of some of the variables were adapted from the names of the items on the files for an adequate presentation. Some original items incorporated the alternative “other” to allow an exhaustive collection of responses that were considered, at the discretion of the LRNZOP-INS team, to be infrequent at the time of the file’s elaboration. Among these variables are “Housing material” (which could include stone with mud, cardboard, stone or ashlar, etc.), as well as “Type of vegetables consumed” and “Type of vegetable consumption”. The characteristics of the variable adjustments/groupings are presented in the Supplementary Material.
We assessed the following sociodemographic characteristics: age, sex, occupation, educational level, housing material, source of water for human consumption, consumption of boiled water, type of toilet facilities, and department of origin, as well as characteristics related to animal husbandry, slaughtering and risk practices. Data were obtained on the type of animals raised currently or previously, type of raising and place of slaughter of pigs, place of slaughter of sheep/bovine/goats, feeding raw offal to their dogs, deworming of their dogs and handling of meat with cysticercosis. Age was categorized according to life stage, which is a classification widely used in health systems. Occupation was categorized by convenience considering the similarity and affinity of answers found in the epidemiological file.
Information on the foods consumed, the frequency of pork and vegetable consumption, type of vegetables consumed and form of consumption was also collected. The clinical and epidemiological characteristics evaluated included personal semiological history (fainting, weight loss, abdominal pain, headache, chest pain, epilepsy, fever, jaundice, dizziness, nausea, chronic cough and vomiting), and family history of echinococcosis, cysticercosis and fascioliasis.
Statistical analysis
Data analysis was carried out with the Stata v17.0 statistical package (Stata Corporation, College Station, Texas, USA). Descriptive estimates of the study variables were made by obtaining absolute and relative frequencies. In an exploratory manner, the difference in the proportion of each infection was identified according to all the study characteristics by means of Pearson’s chi-square test or Fisher’s Exact test (according to Cochran’s rule). These tests were performed considering a significance level of 0.05.
Ethical Aspects
The present study used secondary data that were collected during epidemiological surveillance activities in the framework of the “Protocol for Laboratory-Based Surveillance of Parasitic Zoonoses (Teniosis/Cysticercosis, Cystic Echinococcosis, and Fasciolosis)” approved in 2015 by the National Public Health Center of the INS.
Prior to obtaining clinical and laboratory information, as established in the aforementioned protocol, each participant gave their authorization through consent and/or informed assent.
RESULTS
Of the 9389 epidemiological files identified, 1578 were excluded due to lack of information. A total of 7811 epidemiological files obtained from inhabitants of 13 highland regions of Peru were included (Figure 1).
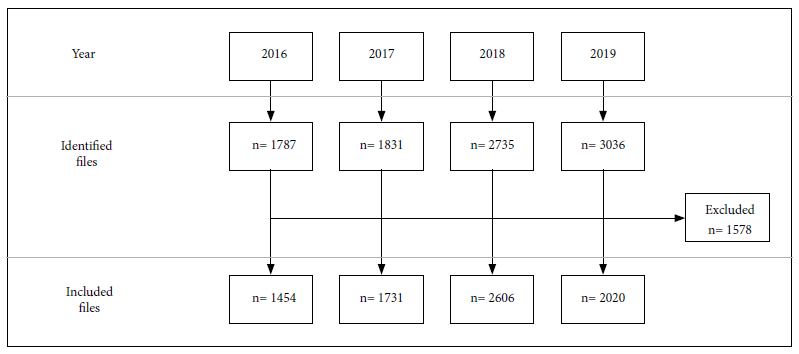
Table 1 describes the sociodemographic characteristics of the population; 36.7% were adults, 65% were male, and 41.4% were students. Likewise, most the participants had primary education (44.4%), had adobe as a housing wall material (85.2%), had water supply through a sink or pipe (52.3%), had access to boiled water (86.1%), a bathroom with a drain (50.5%) and were from Apurimac (26.2%).
Table 1 Sociodemographic characteristics of the studied population from 13 highland regions of Peru, 2016-2019.
| Sociodemographic characteristics | Total number of evaluated files | Cystic echinococcosis positive | p-value | Cysticercosis positive | p-value | Fascioliasis positive | p-value | |
|---|---|---|---|---|---|---|---|---|
| n / N | % | n/N (%) | n/N (%) | n/N (%) | ||||
| Age group | ||||||||
| Children (5 -11 years) | 1241 / 7811 | 15.9 | 42 / 1241 (3.4) | 0.031a | 10 / 1241 (0.8) | <0.001a | 96 / 1241 (7.7) | <0.001a |
| Adolescents (12 -17 years) | 1774 / 7811 | 22.7 | 77 / 1774 (4.3) | 25 / 1774 (1.4) | 172 / 1774 (9.7) | |||
| Young adults (18 - 29 years) | 974 / 7811 | 12.5 | 53 / 974 (5.4) | 24 / 974 (2.5) | 76 / 974 (7.8) | |||
| Adults (30 - 59 years) | 2866 / 7811 | 36.7 | 157 / 2866 (5.5) | 83 / 2866 (2.9) | 178 / 2866 (6.2) | |||
| Older adults (60 or more) | 956 / 7811 | 12.2 | 52 / 956 (5.4) | 39 / 956 (4.1) | 93 / 956 (9.7) | |||
| Sex | ||||||||
| Women | 2730 / 7811 | 35.0 | 129 / 2730 (4.7) | 0.647a | 51 / 2730 (1.9) | 0.053a | 214 / 2730 (7.8) | 0.934a |
| Men | 5081 / 7811 | 65.0 | 252 / 5081 (5.0) | 130 / 5081 (2.6) | 401 / 5081 (7.9) | |||
| Occupation | ||||||||
| Student | 3230 / 7811 | 41.4 | 136 / 3230 (4.2) | 0.019a | 37 / 3230 (1.1) | <0.001a | 280 / 3230 (8.7) | <0.001a |
| Trade | 671 / 7811 | 8.6 | 23 / 671 (3.4) | 20 / 671 (3.0) | 22 / 671 (3.3) | |||
| Housekeeping/cleaning | 1635 / 7811 | 20.9 | 93 / 1635 (5.7) | 67 / 1635 (4.1) | 94 / 1635 (5.7) | |||
| Agriculture and Livestock | 2248 / 7811 | 28.8 | 128 / 2248 (5.7) | 56 / 2248 (2.5) | 219 / 2248 (9.7) | |||
| Not registered | 27 / 7811 | 0.3 | 1 / 27 (3.7) | 1 / 27 (3.7) | 0 / 27 (0.0) | |||
| Education level | ||||||||
| Primary | 3278 / 7389 | 44.4 | 149 / 3278 (4.5) | 0.554a | 81 / 3278 (2.5) | 0.194a | 262 / 3278 (8.0) | 0.034a |
| Secondary | 3242 / 7389 | 43.9 | 159 / 3242 (4.9) | 68 / 3242 (2.1) | 258 / 3242 (8.0) | |||
| Higher | 604 / 7389 | 8.2 | 28 / 604 (4.6) | 10 / 604 (1.7) | 28 / 604 (4.6) | |||
| No education | 265 / 7389 | 3.6 | 17 / 265 (6.4) | 10 / 265 (3.8) | 21 / 265 (7.9) | |||
| Housing material | ||||||||
| Adobe | 6144 / 7210 | 85.2 | 272 / 6144 (4.4) | 0.519a | 152 / 6144 (2.5) | 0.064a | 502 / 6144 (8.2) | <0.001a |
| Hut | 126 / 7210 | 1.7 | 9 / 126 (7.1) | 5 / 126 (4.0) | 14 / 126 (11.1) | |||
| Noble materials | 802 / 7210 | 11.1 | 35 / 802 (4.4) | 9 / 802 (1.1) | 31 / 802 (3.9) | |||
| Other | 138 / 7210 | 1.9 | 7 / 138 (5.1) | 4 / 138 (2.9) | 5 / 138 (3.6) | |||
| Source of water for human consumption | ||||||||
| Drinking water | 2427 / 6486 | 37.4 | 117 / 2427 (4.8) | 0.200a | 65 / 2427 (2.7) | 0.304a | 196 / 2427 (8.1) | <0.001a |
| Fountain and/or pipe | 3393 / 6486 | 52.3 | 145 / 3393 (4.3) | 77 / 3393 (2.3) | 230 / 3393 (6.8) | |||
| Well | 301 / 6486 | 4.6 | 10 / 301 (3.3) | 9 / 301 (3.0) | 37 / 301 (12.3) | |||
| Spring | 245 / 6486 | 3.8 | 11 / 245 (4.5) | 8 / 245 (3.3) | 22 / 245 (9.0) | |||
| Irrigation canal | 49 / 6486 | 0.8 | 5 / 49 (10.2) | 0 / 49 (0.0) | 6 / 49 (12.2) | |||
| River | 71 / 6486 | 1.1 | 1 / 71 (1.4) | 4 / 71 (5.6) | 0 / 0 (0.0) | |||
| Consumes boiled water | ||||||||
| Yes | 6212 / 7213 | 86.1 | 305 / 6212 (4.9) | 0.027† | 146 / 6212 (2.4) | 0.857a | 457 / 6212 (7.4) | 0.024† |
| No | 855 / 7213 | 11.9 | 33 / 855 (3.9) | 18 / 855 (2.1) | 72 / 855 (8.4) | |||
| Sometimes boiled or unboiled | 146 / 7213 | 2.0 | 1 / 146 (0.7) | 4 / 146 (2.7) | 19 / 146 (13.0) | |||
| Bathroom | ||||||||
| Toilet with drainage | 3592 / 7111 | 50.5 | 169 / 3592 (4.7) | 0.445a | 79 / 3592 (2.2) | 0.353a | 207 / 3592 (5.8) | <0.001a |
| Latrine | 2987 / 7111 | 42.0 | 123 / 2987 (4.1) | 73 / 2987 (2.4) | 262 / 2987 (8.8) | |||
| Defecate in open field | 532 / 7111 | 7.5 | 21 / 532 (3.9) | 17 / 532 (3.2) | 70 / 532 (13.2) | |||
| Department of origin | ||||||||
| Lima Provinces | 1187 / 7811 | 15.2 | 73 / 1187 (6.1) | <0.001a | 16 / 1187 (1.3) | <0,001a | 155 / 1187 (13.1) | <0.001a |
| Huánuco | 903 / 7811 | 11.6 | 17 / 903 (1.9) | 17 / 903 (1.9) | 78 / 903 (8.6) | |||
| Junín | 528 / 7811 | 6.8 | 28 / 528 (5.3) | 9 / 528 (1.7) | 29 / 528 (5.5) | |||
| Apurímac | 2047 / 7811 | 26.2 | 67 / 2047 (3.3) | 36 / 2047 (1.8) | 121 / 2047 (5.9) | |||
| Cusco | 1318 / 7811 | 16.9 | 57 / 1318 (4.3) | 50 / 1318 (3.8) | 91 / 1318 (6.9) | |||
| Ayacucho | 969 / 7811 | 12.4 | 78 / 969 (8.0) | 44 / 969 (4.5) | 60 / 969 (6.2) | |||
| Huancavelica | 197 / 7811 | 2.5 | 14 / 197 (7.1) | 1 / 197 (0.5) | 7 / 197 (3.6) | |||
| Cajamarca | 140 / 7811 | 1.8 | 0 / 140 (0.0) | 0 / 140 (0.0) | 28 / 140 (20.0) | |||
| Arequipa | 188 / 7811 | 2.4 | 7 / 188 (3.7) | 2 / 188 (1.1) | 29 / 188 (15.4) | |||
| Moquegua | 14 / 7811 | 0.2 | 0 / 14 (0.0) | 0 / 14 (0.0) | 0 / 14 (0.0) | |||
| Tacna | 133 / 7811 | 1.7 | 1 / 133 (0.8) | 0 / 133 (0.0) | 2 / 133 (1.5) | |||
| Puno | 32 / 7811 | 0.4 | 1 / 32 (3.1) | 0 / 32 (0.0) | 13 / 32 (40.6) | |||
| Cerro de Pasco | 155 / 7811 | 2.0 | 38 / 155 (24.5) | 6 / 155 (3.9) | 2 / 155 (1.3) | |||
| Total | ---- | ---- | 381 / 7811 (4.9) | 181 / 7811 (2.3) | 615 / 7811 (7.9) | |||
a Pearson’s Chi-square test.
The frequency of cases of cystic echinococcosis, T. solium cysticercus infection and fascioliasis was 4.9%, 2.3% and 7.9%, respectively. In addition, the highest number of cases of cystic echinococcosis was found in adults (5.5%), most cases of T. solium cysticercus infection were found in older adults (4.1%), and most cases of fascioliasis were reported in adolescents and older adults (9.7%). The occupational groups most affected by cystic echinococcosis were housewives and farmers (5.7%), housewives had the most cases of T. solium cysticercus infection (4.1%), and farmers had the most cases of fascioliasis (9.7%). Significant positivity for fascioliasis was found predominantly in people with primary and secondary education (8.0%). Likewise, the highest frequency of fascioliasis was found in participants residing in hut dwellings (11.1%), as well as in those who received accessed water by wells (12.3%), and defecated in the open field (13.2%). The highest frequency of cystic echinococcosis was found in Cerro de Pasco (24.5%), of cysticercosis in Ayacucho (4.5%), and of fascioliasis in Puno (40.6%) (Table 1).
In terms of people’s habits and activities, significant positivity for cystic echinococcosis was found in participants who raised pigs (5.4%) and sheep (3.8%); and for fascioliasis, in farmers who raised goats (7.2%), cows (6.2%) and sheep (6.5%). The highest frequency of cysticercosis was found in participants who raised free-range pigs (4.1%), and those who slaughtered their pigs near their homes (2.4%). People with did not deworm their dogs had a higher frequency of cystic echinococcosis (6.0%), while cysticercosis cases were higher in those who sold meat contaminated with T. solium cysticercus (5.7%) (Table 2).
Table 2 Distribution of parasitic zoonoses according to animal husbandry characteristics, slaughtering and risk practices in 13 highland regions of Peru, 2016-2019.
| Animal husbandry, slaughtering and risk practices | Total number of evaluated files | Cystic echinococcosis positive n/N (%) | p-value | Cysticercosis positive n/N (%) | p-value | Fascioliasis positive n/N (%) | p-value | |
|---|---|---|---|---|---|---|---|---|
| n / N | % | |||||||
| Animals raised or bred | ||||||||
| Pigs | 4022 / 7202 | 55.8 | 217/4022 (5.4) | <0.001a | 99 / 4022 (2.5) | 0.415a | 310 / 4022 (7.7) | 0.649a |
| Goats | 6447 / 7121 | 90.5 | 283/6447 (4.4) | 0.543a | 147 / 6447 (2.3) | 0.877a | 462 / 6447 (7.2) | <0.001a |
| Cows | 3583 / 7194 | 49.8 | 164/3583 (4.6) | 0.597a | 77 / 3583 (2.1) | 0.373a | 221 / 3583 (6.2) | <0.001a |
| Sheep | 4054 / 7209 | 56.2 | 153/4054 (3.8) | <0.001a | 84 / 4054 (2.1) | 0.163a | 263 / 4054 (6.5) | <0.001a |
| Dogs | 1793 / 7247 | 24.7 | 83/1793 (4.6) | 0.787a | 47 / 1793 (2.6) | 0.326a | 117 / 1793 (6.5) | 0.069a |
| Type of pig breeding | ||||||||
| At home in a corral | 1452 / 3423 | 42.4 | 82/1452 (2.7) | 0.271a | 27 / 1452 (1.9) | 0.001a | 117 / 1452 (8.1) | 0.617a |
| In a field corral | 1140 / 3423 | 33.3 | 43/1140 (3.8) | 19 / 1140 (1.7) | 92 / 1140 (8.1) | |||
| In the open field | 831 / 3423 | 24.3 | 29/831 (3.5) | 34 / 831 (4.1) | 76 / 831 (9.1) | |||
| Place of pig slaughter | ||||||||
| Peridomicile | 2968 / 3263 | 91.0 | 96/2968 (3.2) | 0.445a | 71 / 2968 (2.4) | 0.022a | 249 / 2968 (8.4) | 0.580a |
| Slaughterhouse | 295 / 3263 | 9.0 | 12/295 (4.1) | 1 / 295 (0.3) | 22 / 295 (7.5) | |||
| Sheep/cow/goat slaughtering place | ||||||||
| Peridomicile | 3558 / 3840 | 92.7 | 149/3558 (4.2) | 0.957† | 97 / 3558 (2.7) | 0.040† | 319 / 3558 (9.0) | 0.204† |
| Slaughterhouse | 282 / 3840 | 7.3 | 12/282 (4.3) | 2 / 282 (0.7) | 19 / 282 (6.7) | |||
| Feeds raw offal to the dogs | ||||||||
| No | 2026 / 4879 | 41.5 | 104/2026 (5.1) | 0.043† | 49 / 2026 (2.4) | 0.516† | 188 / 2026 (9.3) | 0.051† |
| Yes | 2853 / 4879 | 58.5 | 112/2853 (3.9) | 61 / 2853 (2.1) | 220 / 2853 (7.7) | |||
| Dewormed dog | ||||||||
| No | 1451 / 4834 | 30.0 | 87/1451 (6.0) | <0.001a | 39 / 1451 (2.7) | 0.162a | 103 / 1451 (7.1) | 0.092a |
| Yes | 3383 / 4834 | 70.0 | 112/3383 (3.3) | 69 / 3383 (2.0) | 289 / 3383 (8.5) | |||
| Knowledge about the disease: | ||||||||
| Fascioliasis | ||||||||
| No | 2715 / 6579 | 41.3 | 132/2715 (4.9) | 0.027a | 84/2715 (3.1) | 0.001a | 215/2715 (7.9) | 0.939a |
| Yes | 3864 / 6579 | 58.7 | 145/3864 (3.8) | 72 / 3864 (1.9) | 304 / 3864 (7.9) | |||
| Echinococcosis | ||||||||
| No | 1731 / 4959 | 34.9 | 83/1731 (4.8) | 0.035a | 58/1731 (3.4) | <0.001a | 132/1731 (7.6) | 0.082a |
| Yes | 3228 / 4959 | 65.1 | 115/3228 (3.6) | 56 / 3228 (1.7) | 293/3228 (9.1) | |||
| Cysticercosis | ||||||||
| No | 2754 / 5794 | 47.5 | 134/2754 (4.9) | 0.009a | 80/2754 (2.9) | 0.004a | 208/2754 (7.6) | 0.106a |
| Yes | 3040 / 5794 | 52.5 | 106/3040 (3.5) | 54/3040 (1.8) | 265/3040 (8.7) | |||
| What happens with the meat with cysticercosis | ||||||||
| Eats it | 342 / 3238 | 10.6 | 10/342 (2.9) | 0.397a | 12 / 342 (3.5) | 0.019a | 23/342 (6.7) | 0.872a |
| Sells it | 123 / 3238 | 3.8 | 4/123 (3.3) | 7 / 123 (5.7) | 9/123 (7.3) | |||
| Burries it | 2430 / 3238 | 75.0 | 114/2430 (4.7) | 61 / 2430 (2.5) | 192/2430 (7.9) | |||
| Feeds it to the dog | 343 / 3238 | 10.6 | 13/343 (3.8) | 3 / 343 (0.9) | 25/343 (7.3) | |||
a Pearson’s Chi-square test.
Regarding consumption of foods and beverages, most cases of cysticercosis were found among participants who consumed pork (2.9%); however, this difference was not statistically significant. In addition, participants who consumed emollients and vegetable extracts had a higher frequency of fascioliasis and cystic echinococcosis (p<0.05). Additionally, we evidenced a difference in cases of cystic echinococcosis by consumption of vegetables in juices (p<0.05) (Table 3).
Table 3 Distribution of parasitic zoonoses according to consumption of food and beverages at risk for parasitic zoonoses found in 13 highland regions of Peru, 2016-2019.
| Consumption of food and beverages at risk for parasitic zoonosis | Total number of evaluated files | Cystic echinococcosis positive | p-value | Cysticercosis positive | p-value | Fascioliasis positive | p-value | |
|---|---|---|---|---|---|---|---|---|
| n / n | % | n/N (%) | n/N (%) | n/N (%) | ||||
| Food-related risk factors | ||||||||
| Consumes pork meat | 1329 / 4938 | 26.9 | 76/1329 (5.7) | 0.006a | 38 / 1329 (2.9) | 0.295a | 114 / 1329 (8.6) | 0.173a |
| Consumes raw vegetables | 568 / 4938 | 11.5 | 19/568 (3.3) | 0.169a | 14 / 568 (2.5) | 0.815a | 42 / 568 (7.4) | 0.853a |
| Frequency of pork consumption | ||||||||
| One to two times a month | 1849 / 5031 | 36.8 | 67/1849 (3.6) | 0.199a | 31 / 1849 (1.7) | 0.092a | 129 / 1849 (7.0) | 0.169a |
| One to two times a year | 3182 / 5031 | 63.2 | 139/3182 (4.4) | 76 / 3182 (2.4) | 256 / 3182 (8.0) | |||
| Frequency of vegetable consumption | ||||||||
| Every day | 906 / 5441 | 16.7 | 28/906 (3.1) | 0.271a | 15 / 906 (1.7) | 0.397a | 69 / 906 (7.6) | 0.102a |
| One to two times a month | 3076 / 5441 | 56.5 | 134/3076 (4.4) | 79 / 3076 (2,6) | 287 / 3076 (9.3) | |||
| Three to four times a month | 1356 / 5441 | 24.9 | 64/1356 (4.7) | 29 / 1356 (2.1) | 99 / 1356 (7.3) | |||
| One to two times a year | 103 / 5441 | 1.9 | 5/103 (4.9) | 3 / 103 (2.9) | 8 / 103 (7.8) | |||
| Vegetables consumed | ||||||||
| Watercress | 1949 / 5614 | 34.7 | 93/1949 (4.8) | 0.399a | 50 / 1949 (2.6) | 0.401a | 155 / 1949 (8.0) | 0.708a |
| Lettuce | 4275 / 5614 | 76.1 | 194/4275 (4.5) | 0.582a | 102 / 4275 (2.4) | 0.641a | 337 / 4275 (7.9) | 0.208a |
| Dandelion | 112 / 5614 | 2.0 | 7/112 (6.3) | 0.348b | 2 / 112 (1.8) | 1.000b | 7 / 112 (6.3) | 0.460a |
| Alfalfa | 162 / 5614 | 2.9 | 5/162 (3.1) | 0.392a | 1 / 162 (0.6) | 0.186b | 10 / 162 (6.2) | 0.353a |
| Other | 18 / 5614 | 0.3 | 1/18 (5.6) | 0.560b | 1 / 18 (5.6) | 0.347b | 0 / 18 (0.0) | 0.393b |
| Vegetable consumption | ||||||||
| Salads | 5231 / 5614 | 93.2 | 234/5231 (4.5) | 0.786a | 120 / 5231 (2.3) | 0.469a | 429 / 5231 (8.2) | 0.538a |
| Juice | 420 / 5614 | 7.5 | 36/420 (8.6) | <0.001a | 10 / 420 (2.4) | 0.947a | 34 / 420 (8.1) | 0.972a |
| Extracts | 210 / 5614 | 3.7 | 17/210 (8.1) | 0.009a | 1 / 210 (0.5) | 0.096b | 4 / 210 (1.9) | 0.001a |
| Emollients | 235 / 5614 | 4.2 | 4/235 (1.7) | 0.037a | 1 / 235 (0.4) | 0.048a | 6 / 235 (2.6) | 0.001a |
| Other | 66 / 5614 | 1.2 | 3/66 (4.5) | 0.769b | 3 / 66 (4.5) | 0.199b | 4 / 66 (6.1) | 0.534a |
a Pearson’s chi-squared test.
b Fisher’s exact test.
The main symptoms for cystic echinococcosis were weight loss (4.3%), chest pain (4.2%), and abdominal pain (4.4%). For cysticercosis, the main symptoms were headache (1.8%), dizziness (2.0%), and nausea (2.2%), while for fascioliasis they were weight loss (7.6%), abdominal pain (8.0%), fever (7.9%), and jaundice (7.8%). Regarding the assessment of family history, a statistically significant difference was found in the frequency of cases (p<0.05) for the three parasitic zoonoses (Table 4).
Table 4 Clinical and epidemiological characteristics of parasitic zoonoses found in 13 highland regions of Peru, 2016-2019.
| Clinical and epidemiological characteristics | Total number of evaluated files | Cystic echinococcosis positive | p-value | Cysticercosis positive | p-value | Fascioliasis positive | p-value | |
|---|---|---|---|---|---|---|---|---|
| n / n | % | n/N (%) | n/N (%) | n/N (%) | ||||
| Signs and Symptoms | ||||||||
| Weight loss | 5540 / 6246 | 88.7 | 238/5540 (4.3) | 0.005 a | 122 / 5540 (2.2) | 0.047 a | 420 / 5540 (7.6) | 0.010 a |
| Abdominal pain | 3320 / 6235 | 53.2 | 146/3320 (4.4) | 0.374 a | 71 / 3320 (2.1) | 0.224 a | 265 / 3320 (8.0) | 0.792 a |
| Headache | 3306 / 6220 | 53.2 | 133/3306 (4.0) | 0.018 a | 59 / 3306 (1.8) | 0.001 a | 262 / 3306 (7.9) | 0.997 a |
| Chest pain | 5013 / 6184 | 81.1 | 213/5013 (4.2) | 0.008 a | 111 / 5013 (2.2) | 0.161 a | 409 / 5013 (8.2) | 0.223 a |
| Epilepsy | 6189 / 6260 | 98.9 | 272/6189 (4.4) | 0.770 b | 139 / 6189 (2.2) | 0.675 b | 386 / 6189 (6.2) | <0.001 b |
| Fever | 4858 / 6247 | 77.8 | 218/4858 (4.5) | 0.521 a | 108 / 4858 (2.2) | 0.265 a | 384 / 4858 (7.9) | 0.986 a |
| Jaundice | 6049 / 6241 | 96.9 | 277/6049 (4.6) | 0.787 a | 137 / 6049 (2.3) | 0.088 b | 471 / 6049 (7.8) | 0.063 a |
| Dizziness | 4968 / 6252 | 79.5 | 228/4968 (4.6) | 0.912 a | 98 / 4968 (2.0) | <0.001 a | 382 / 4968 (7.7) | 0.298 a |
| Nausea | 4883 / 6200 | 78.8 | 215/4883 (4.4) | 0.129 a | 105 / 4883 (2.2) | 0.028 a | 377 / 4883 (7.7) | 0.228 a |
| Chronic cough | 5417 / 6238 | 86.8 | 237/5417 (4.4) | 0.060 a | 122 / 5417 (2.3) | 0.330 a | 411 / 5417 (7.6) | 0.024 a |
| Vomiting | 5282 / 6247 | 84.6 | 244/5282 (4.6) | 0.612 a | 120 / 5282 (2.3) | 0.322 a | 399 / 5282 (7.6) | 0.027 a |
| Family history | ||||||||
| Echinococcosis | 6289 / 6548 | 96.0 | 272/6289 (4.3) | 0.001 a | 147 / 6289 (2.3) | 0.436 a | 503 / 6289 (8.0) | 0.872 a |
| Cysticercosis | 6100 / 6526 | 93.5 | 274/6100 (4.5) | 0.976 a | 133 / 6100 (2.2) | 0.001 a | 505 / 6100 (8.3) | 0.003 a |
| Fascioliasis | 6574 / 6658 | 98.7 | 287/6574 (4.4) | <0.001 a | 150 / 6574 (2.3) | 0.711 a | 504 / 6574 (7.7) | <0.001 a |
a Pearson’s Chi-Square test.
b Fisher’s Exact Test.
DISCUSSION
The National Referral Laboratory for Parasitic Zoonoses of the National Institute of Health decided to conduct laboratory-based surveillance to determine the extent of infection of fascioliasis, cystic echinococcosis, and T. solium cysticercosis in 7811 samples from 13 regions of Peru. Data from this activity have identified a seropositivity of 4.9% for cystic echinococcosis, 7.9% for human fascioliasis, and 2.3% for T. solium cysticercosis.
Cerro de Pasco (24.5%), Ayacucho (8%), Huancavelica (7.1%), Provinces of Lima (6.1%), Junín (5.3%) and Cusco (4.3%) had the highest cystic echinococcosis seropositivity, this maybe be due to the fact that they are considered endemic areas, as evidenced by other studies conducted in the Peruvian Andes 21-24. In addition, cases of cystic echinococcosis were found in Huánuco (1.9%), Tacna (0.8%), Arequipa (3.7%), Apurímac (3.3%) and Puno (3.1%). It is worth mentioning that we only obtained a small number of samples from the regions of Puno and Moquegua because these regions did not have adequate logistics to obtain a larger number of samples for laboratory-based surveillance of parasitic zoonoses.
The regions of Huánuco (8.6%), Ayacucho (6.2%) and Apurímac (5.9%) had the highest frequency of cases of human fascioliasis; however, we should also highlight the presence of cases in Cerro de Pasco (1.3%), Huancavelica (3.6%) and Tacna (1.5%), which is important because our study is the first report of cases of human fascioliasis in these regions. Therefore, it is of utmost importance to carry out further studies to identify risk areas for the control and prevention of this zoonosis.
The frequency of human fascioliasis was higher in Puno (40.6%), Cajamarca (20.0%), Arequipa (15.4%), Junín (5.5%) and Cusco (6.9%), which have been identified as endemic for this infection, as evidenced by Marcos et al. in their report of human cases between 1995 and 2005 25, and by other studies that identified these areas as endemic 16,26,27. In addition to the aforementioned regions, we also found high seropositivity (13.1%) in Lima provinces. This finding is consistent with previous studies; a prevalence of 12.1% has been previously reported in Vichaycocha, Huancapón and Cajamarquilla, in the highlands of Lima 28. Likewise, the presence of this parasite has also been reported from coprological samples obtained in Huarochirí (16.7%) 29 and Oyón (1.12%) 30.
We found a 2.3% seropositivity rate of T. solium cysticercosis, which is lower than the estimated prevalence in Latin America (4.08%) 3. In addition, we identified cases of this infection in regions where it had not been previously reported, such as Huánuco (1.9%) and Huancavelica (0.5%). A seropositivity rate lower than pre-existing reports was evidenced in some regions, such as Cerro de Pasco which previously reported 4.2%, Cusco with 24.0% in Saylla, Junín with 7.0% in Huancayo, Apurímac with 12.0% in Andahuaylas, Tacna with 1.85% and Puno with 1.64% 7. On the other hand, there were regions with higher seropositivity rates than previously reported, such as Ayacucho, which had reports of 3.3% in Pampa Cangallo, Lima with previous seropositivity of less than 1%, and Arequipa, which previously had 1.01% 19. This variation in results may be due to the number of samples obtained and the sampling areas.
The sociodemographic characteristics that had a higher seropositivity for these parasitic zoonoses were age and occupation. We found a higher frequency of IgG type antibodies against cystic echinococcosis and T. solium cysticercosis in adults and older adults, respectively, compared to human fascioliasis, which was found mainly in adolescents and older adults. The increase in cystic echinococcosis and T. solium cysticercosis seropositivity with age found by our study is consistent with that found by previous studies 31,17. The most affected occupational groups for these zoonoses were housewives and farmers; a higher cystic echinococcosis seropositivity in housewives has been reported by other studies 32. Likewise, the housing material, source of water for human consumption, consumption of unboiled water and defecating outdoors presented a difference in the seropositivity of human fascioliasis, where poverty and deficient sanitary conditions allow the perpetuation of this disease; this has been found by previous studies 8,26,33.
The habits and activities of the settlers in the studied areas that showed a difference in the seropositivity of these zoonoses were the raising of animals such as pigs and sheep for cystic echinococcosis; goats, cows and sheep for human fascioliasis, and the raising of pigs in free range for T. solium cysticercosis. These animals act as hosts in the biological cycle of zoonotic parasites. In this regard, Ghatee et al.34 found that the population density of sheep, cattle and goats significantly influences the distribution of cystic echinococcosis. In addition, there was a relationship between the higher frequency of T. solium cysticercosis and the slaughter of pigs in the peridomicile. This finding could be explained by the fact that raising pigs in unsanitary conditions and consuming their meat without proper inspection may cause greater exposure to T. solium35. On the other hand, dogs are used for raising cattle, sheep and goats in the countryside. This means that non-dewormed dogs that consume raw viscera from animals slaughtered in the peridomicile are a primary source of cystic echinococcosis infection for humans and animals, which has been demonstrated by our study since we found a difference in the frequency of cases between having non-dewormed dogs and the slaughter of animals in the peridomicile with cystic echinococcosis.
Parasitic zoonoses can be acquired by consuming water and plants contaminated with eggs of E. granulosus, T. solium, or metacercariae of F. hepatica. This fact could explain our results, which show that consuming raw vegetables in juices, extracts and emollients had a difference in the seropositivity of cystic echinococcosis and human fascioliasis. This finding has been reported by previous studies with similar results 11,35.
We found a statistically significant difference in the frequency of cases between weight loss and chest pain with cystic echinococcosis seropositivity. Himsawi et al. found that weight loss is associated with cystic echinococcosis 20. In addition, another study found an increased frequency of abdominal pain and chronic cough 36, which is similar to our findings. Symptoms such as headache, dizziness and nausea had higher T. solium cysticercus seropositivity as shown in previous studies 37,38. However, although cysticercosis is associated with epilepsy, we did not identify a difference in case frequency. This finding could be attributed to the fact that we only evaluated data focused on the detection of circulating IgG-type antibodies, which did not allow us to determine neurocysticercosis. A significant difference was found between the frequency of fascioliasis cases and the decrease in weight; which has also been reported by Orfanos et al. 39 in a study carried out in children from three provinces of Cajamarca. On the other hand, abdominal pain and fever were frequent symptoms in cases with seropositivity to fascioliasis, which is consistent with previous research 40,41.
Likewise, we found that participants with a family history had a higher frequency of the three parasitosis, which has been previously reported by Carmona et al42. This finding could be due to the fact that people living together in the same environment and sharing the same food and habits could facilitate the transmission of these zoonoses. Therefore, it is recommended to screen the whole family once a case of these etiologies is confirmed. These findings demonstrate the importance of early detection in order to start effective treatment as well as to avoid complications, thus improving public health.
It is important to point out that the main limitation of our study is the use of secondary data, which was obtained previously as part of surveillance activities that do not have a definition established in any manual or guide related to the collection instrument; however, most of the data are clear and have reduced subjectivity. Also, due to the very nature of the study regarding secondary data, it was not possible to include other variables that could be of epidemiological interest, such as the variable “Occupation”, which was collected in an open form in the instrument, and was categorized by the authors in an ad hoc manner according to affinity and similarity of the responses. Additionally, the data collected through the epidemiological files were used to establish, in an exploratory manner, a difference in the number of cases identified for each of the parasitic infections. Another important limitation is the representativeness of the analyzed data, given the limited number of subjects screened per region, as well as the non-probabilistic selection made. These data collection limitations were caused by logistical difficulties, since the sampling points were located in rural areas far from the city. Due to the low representativeness of the sample and the methodological design of the screening process (aspects that affect the external validity of the data), it was not possible to establish prevalence and/or seroprevalence estimators, but only case frequency estimators. These limitations should be considered during the critical reading of this article. However, despite the limitations of the sample and design of this study, it should be noted that no previous similar study with a such a large sample size has been found. For this reason, our results are very useful to understand the distribution of these infections. It should also be considered that these parasitic zoonoses are underreported in Peru because they are neglected diseases frequently found in rural areas with extreme poverty, and the Peruvian Ministry of Health (MINSA) has not implemented mandatory notification for their surveillance, prevention and control.
In conclusion, we were able to obtain a better overview of the distribution and characteristics of these parasitic zoonoses in 13 regions of Peru, through the serological analysis of 7811 samples obtained through epidemiological surveillance activities. Our findings could be a useful tool for decision-makers in different sectors, such as Health, Agriculture and Environment, to define strategic areas and/or policies with prioritization or differentiated focus for the control and prevention of these zoonoses.
Acknowledgments.
We thank the National Zoonosis Strategy of the Ministry of Health for coordinating with the different Regional Zoonosis Strategies to obtain the serum samples and logistical support. We acknowledge all the workers of the Regional Reference Laboratory of the GERESA Arequipa and the DIRESAS Ayacucho, Cusco, Puno, Apurímac, Lima Provincias, Huánuco, Huancavelica, Cerro de Pasco, Tacna, Junín, Cajamarca, involved in the handling and processing of samples by the ELISA-IgG method.
REFERENCES
1. Naquira C. Las zoonosis parasitarias: problema de salud pública en el Perú. Rev Peru Med Exp Salud Publica. 2010;27(4):494-497. doi: 10.17843/rpmesp.2010.274.1518. [ Links ]
2. Garcia HH, Moro PL, Schantz PM. Zoonotic helminth infections of humans: echinococcosis, cysticercosis and fascioliasis. Curr Opin Infect Dis. 2007;20(5):489-94. doi: 10.1097/QCO.0b013e3282a95e39. [ Links ]
3. Coral-Almeida M, Gabriël S, Abatih EN, Praet N, Benitez W, Dorny P. Taenia solium Human Cysticercosis: A Systematic Review of Sero-epidemiological Data from Endemic Zones around the World. PLoS Negl Trop Dis. 2015;9(7):e0003919. doi: 10.1371/journal.pntd.0003919. [ Links ]
4. Wen H, Vuitton L, Tuxun T, Li J, Vuitton DA, Zhang W, et al. Echinococcosis: Advances in the 21st Century. Clin Microbiol Rev. 2019;32(2):e00075-18. doi: 10.1128/CMR.00075-18. [ Links ]
5. Nyindo M, Lukambagire A-H. Fascioliasis: An Ongoing Zoonotic Trematode Infection. Biomed Res Int. 2015;2015:786195. doi: 10.1155/2015/786195. [ Links ]
6. Gavidia CM, Gonzalez AE, Zhang W, McManus DP, Lopera L, Ninaquispe B, et al. Diagnosis of Cystic Echinococcosis, Central Peruvian Highlands. Emerg Infect Dis. 2008;14(2):260-6. doi: 10.3201/eid1402.061101. [ Links ]
7. Perú. Ministerio de Salud. Teniasis/cisticercosis por Taenia solium, un serio problema de salud pública en el Perú [Internet]. OGE; 2001 [citado el 4 de junio de 2023]. Disponible en: https://www.gob.pe/institucion/minsa/informes-publicaciones/352842-teniasis-cisticercosis-por-taenia-solium-un-serio-problema-de-salud-publica-en-el-peru. [ Links ]
8. Esteban JG, González C, Bargues MD, Angles R, Sánchez C, Náquira C, et al. High fascioliasis infection in children linked to a man-made irrigation zone in Peru. Tropical Medicine & International Health. 2002;7(4):339-48. doi: 10.1046/j.1365-3156.2002.00870.x. [ Links ]
9. Moro PL, Budke CM, Schantz PM, Vasquez J, Santivañez SJ, Villavicencio J. Economic Impact of Cystic Echinococcosis in Peru. PLoS Negl Trop Dis. 2011;5(5):e1179. doi: 10.1371/journal.pntd.0001179. [ Links ]
10. Moro PL, Cavero CA, Tambini M, Briceño Y, Jiménez R, Cabrera L. Identification of risk factors for cystic echinococcosis in a peri-urban population of Peru. Trans R Soc Trop Med Hyg. 2008;102(1):75-8. doi: 10.1016/j.trstmh.2007.09.010. [ Links ]
11. Marcos L, Maco V, Samalvides F, Terashima A, Espinoza JR, Gotuzzo E. Risk factors for Fasciola hepatica infection in children: a case-control study. Trans R Soc Trop Med Hyg. 2006;100(2):158-66. doi: 10.1016/j.trstmh.2005.05.016. [ Links ]
12. Garcia HH, Gilman RH, Tovar MA, Flores E, Jo R, Tsang VCW, et al. Factors Associated with Taenia solium Cysticercosis: Analysis of Nine Hundred Forty-Six Peruvian Neurologic Patients. Am J Trop Med Hyg. 1995;52(2):145-8. doi: 10.4269/ajtmh.1995.52.145. [ Links ]
13. Perú. Instituto Nacional de Estadística e Informática. Mapa de Pobreza Provincial y Distrital 2018 [Internet]. 2020 [citado el 4 de junio de 2023]. Disponible en: https://www.gob.pe/institucion/inei/informes-publicaciones/3204872-mapa-de-pobreza-provincial-y-distrital-2018. [ Links ]
14. Antitupa I, Quispe W, Mayo J, Valverde F, Sanchez E. Purificación de la fracción antigénica 27-28 KDa a partir del antígeno metabólico secretado-excretado de Fasciola hepatica. Rev Peru Med Exp Salud Publica. 2014;31:288-91. doi: 10.17843/rpmesp.2014.312.48. [ Links ]
15. Perú. Ministerio de Salud. Instituto Nacional de Salud. Manual de procedimientos para el diagnóstico serológico de las zoonosis parasitarias. 2da edición. Lima; 2010. (Serie de normas técnicas) http://bvs.minsa.gob.pe/local/minsa/1585.pdf. [ Links ]
16. Cabada MM, Morales ML, Webb CM, Yang L, Bravenec CA, Lopez M, et al. Socioeconomic Factors Associated with Fasciola hepatica Infection Among Children from 26 Communities of the Cusco Region of Peru. Am J Trop Med Hyg. 2018;99(5):1180-5. doi: 10.4269/ajtmh.18-0372. [ Links ]
17. Carabin H, Millogo A, Cissé A, Gabriël S, Sahlu I, Dorny P, et al. Prevalence of and Factors Associated with Human Cysticercosis in 60 Villages in Three Provinces of Burkina Faso. PLoS Negl Trop Dis. 2015;9(11):e0004248. doi: 10.1371/journal.pntd.0004248. [ Links ]
18. Carmona C, Perdomo R, Carbo A, Alvarez C, Monti J, Grauert R, et al. Risk factors associated with human cystic echinococcosis in Florida, Uruguay: results of a mass screening study using ultrasound and serology. Am J Trop Med Hyg. 1998;58(5):599-605. doi: 10.4269/ajtmh.1998.58.599. [ Links ]
19. Ayala ER, Medina SA, Morales JA. Cisticercosis humana y su asociación con factores epidemiológicos y clínicos en los Andes centro y sur de Perú, 2000-2001. Rev Peru Epidemiol. 2014;18(1):1-6. [ Links ]
20. Himsawi N, Hijjawi N, Al-Radaideh A, Al-Tamimi M. Seroprevalence of cystic echinococcosis in a high-risk area (Al-Mafraq Governorate) in Jordan, using indirect hemagglutination test. Parasite Epidemiol Control. 2019;5:e00104. doi: 10.1016/j.parepi.2019.e00104. [ Links ]
21. Núñez E, Calero D, Estares L, Morales A. Prevalencia y factores de riesgo de hidatidosis en población general del distrito de Ninacaca-Pasco, Perú 2001. An Fac med. 2013;64(1):34. doi: 10.15381/anales.v64i1.1419. [ Links ]
22. García-Apaico V, Vargas-Cuba FH, Segovia G, Fernández-Chillce I, Miranda E. Seroprevalencia de hidatidosis humana en población adulta de Sancos, Ayacucho 2005. Rev Peru Med Exp Salud Publica. 2009;26(2):193-7. 10.17843/rpmesp.2009.262.1358. [ Links ]
23. Moro PL, McDonald J, Gilman RH, Silva B, Verastegui M, Malqui V, et al. Epidemiology of Echinococcus granulosus infection in the central Peruvian Andes. Bull World Health Organ. 1997;75(6):553-61. [ Links ]
24. Pérez CR. Proyecto de control de hidatidosis en el Perú por vigilancia epidemiológica [Tesis]. Perú: Universidad Nacional Mayor de San Marcos; 2007. Disponible en: https://cybertesis.unmsm.edu.pe/handle/20.500.12672/1344. [ Links ]
25. Marcos L, Terashima A, Leguia G, Canales M, Espinoza J, Gotuzzo E. La infección por Fasciola hepatica en el Perú: una enfermedad emergente. Rev Gastroenterol Perú. 2007;27(4):389-96. doi: 10.47892/rgp.2007.274.583. [ Links ]
26. Quispe W, Beltran M, Vargas N, Cabanillas J, Sanchez E, Valderrama A. Hiperendemicidad de fasciolosis y factores de riesgo en niños de edad escolar del distrito de Orurillo, Puno. Rev investig vet Perú. 2021;32(5):e19462. doi: 10.15381/rivep.v32i5.19462. [ Links ]
27. León D, Cabanillas O. Factores de riesgo asociados a fasciolosis humana en tres provincias del departamento de Cajamarca, Perú (Periodo 2010). Salud tecnol vet. 2014;2(1):7-13. doi: 10.20453/stv.v2i1.2061. [ Links ]
28. Levano Cáceres GL. Prevalencia y factores de riesgo de fasciola hepática en distritos de la sierra región Lima [Tesis]. Lima: Universidad Nacional Federico Villareal; 2020. Disponible en: https://repositorio.unfv.edu.pe/handle/20.500.13084/4733. [ Links ]
29. Garaycochea MC, Beltran M. Parasitosis intestinal en zonas rurales de cuatro provincias del departamento de Lima. Bol Inst Nac Salud. 2018;24(7-8):89-95. [ Links ]
30. Carpio ISN, Iwashita AT. Prevalencia de infección humana por Fasciola hepatica en pobladores del distrito de Caujul provincia de Oyon, región de Lima, Perú. Acta Med Per. 2008;25(2):77-80. [ Links ]
31. Othieno E, Okwi AL, Mupere E, Zeyhle E, Oba P, Chamai M, et al. Risk factors associated with cystic echinococcosis in humans in selected pastoral and agro-pastoral areas of Uganda. Int J One Health. 2017;3:1-6. doi: 10.14202/IJOH.2017.1-6. [ Links ]
32. Khabisi SA, Marghzari M, Almasi SZ, Khorashad AS, Etemadi S. Seroprevalence of hydatid cyst and related risk factors in humans referred to urban health centers of Zahedan city, southeast Iran. Clin Epidemiol Glob Health. 2021;11:100789. doi: 10.1016/j.cegh.2021.100789. [ Links ]
33. Raymundo LAM, Flores VM, Terashima A, Samalvides F, Miranda E, Tantalean M, et al. Hiperendemicidad de Fasciolosis humana en el Valle del Mantaro, Perú: Factores de riesgo de la infección por Fasciola Hepática. Rev Gastroenterol Peru. 2004;158-64. doi: 10.47892/rgp.2004.242.685. [ Links ]
34. Ghatee MA, Nikaein K, Taylor WR, Karamian M, Alidadi H, Kanannejad Z, et al. Environmental, climatic and host population risk factors of human cystic echinococcosis in southwest of Iran. BMC Public Health. 2020;20(1):1611. doi: 10.1186/s12889-020-09638-w. [ Links ]
35. Meester M, Swart A, Deng H, van Roon A, Trevisan C, Dorny P, et al. A quantitative risk assessment for human Taenia solium exposure from home slaughtered pigs in European countries. Parasit Vectors. 2019;12(1):82. doi: 10.1186/s13071-019-3320-3. [ Links ]
36. Budke CM, Carabin H, Ndimubanzi PC, Nguyen H, Rainwater E, Dickey M, et al. A Systematic Review of the Literature on Cystic Echinococcosis Frequency Worldwide and Its Associated Clinical Manifestations. Am J Trop Med Hyg. 2013;88(6):1011-27. doi: 10.4269/ajtmh.12-0692. [ Links ]
37. Cruz ME, Cruz I, Preux PM, Schantz P, Dumas M. Headache and cysticercosis in Ecuador, South America. Headache. 1995;35(2):93-7. doi: 10.1111/j.1526-4610.1995.hed3502093.x. [ Links ]
38. Sarti E, Schantz PM, Plancarte A, Wilson M, Gutierrez OI, Aguilera J, et al. Epidemiological investigation of Taenia solium taeniasis and cysticercosis in a rural village of Michoacan state, Mexico. Trans R Soc Trop Med Hyg. 1994;88(1):49-52. doi: 10.1016/0035-9203(94)90493-6. [ Links ]
39. Orfanos N, Cabanillas O, León D. Frecuencia relativa de fasciolosis en niños de edad escolar en las provincias de San Marcos, Cajabamba y Celendín, departamento de Cajamarca-2010. Salud tecnol vet. 2015;3(2):78-84. 10.20453/stv.v3i2.2829. [ Links ]
40. Chang MR, Pinto JOA, Guzman P, Terashima A, Samalvides F. Caracterización clínica y epidemiológica de la infección por fasciola hepática entre los años 2003-2010 en el Hospital Nacional Cayetano Heredia, Lima, Perú. Rev Gastroenterol Peru. 2016;36(1):23-8. doi: 10.47892/rgp.2016.361.19. [ Links ]
41. Tas Cengiz Z, Yilmaz H, Dülger AC, Akdeniz H, Karahocagil MK, Çiçek M. Seroprevalence of human fascioliasis in Van province, Turkey. Turk J Gastroenterol. 2015;26(3):259-62. doi: 10.5152/tjg.2015.8001. [ Links ]
42. Carmona C, Perdomo R, Carbo A, Alvarez C, Monti J, Grauert R, et al. Risk factors associated with human cystic echinococcosis in Florida, Uruguay: results of a mass screening study using ultrasound and serology. Am J Trop Med Hyg. 1998;58(5):599-605. doi: 10.4269/ajtmh.1998.58.599. [ Links ]
Funding. National Institute of Health and the National Zoonosis Health Strategy of the Ministry of Health.
Supplementary Material. Available in the digital version of the RPMESP.
Received: December 19, 2022; Accepted: June 21, 2023
 Este es un artículo publicado en acceso abierto bajo una licencia Creative Commons
