


Services on Demand
Journal

Article
 text in
  English (pdf)
 Article in xml format
 Article references
 Send this article by e-mail
Indicators
-
 Cited by SciELO
Related links
-
 Similars in
SciELO
Similars in
SciELO
Share

 Permalink
Horizonte Médico (Lima)
Print version ISSN 1727-558X
Horiz. Med. vol.23 no.4 Lima Oct./Dec. 2023 Epub Dec 18, 2023
http://dx.doi.org/10.24265/horizmed.2023.v23n4.05
ORIGINAL ARTICLE
Use of a preventive app by the Peruvian population: first data collected
*
1
, Doctor of Medicine, master’s degree in Medical Sciences http://orcid.org/0000-0001-8724-3694
2
, Doctor of Medicine, clinical oncologist, master’s degree in Palliative Care for Cancer Patients http://orcid.org/0000-0001-8788-1821
1Universidad de San Martín de Porres, School of Human Medicine. Lima, Peru.
2Hospital Nacional Cayetano Heredia. Lima, Peru.
Objective:
To describe the characteristics of the use of a preventive app by the Peruvian population during its first year of operations between 2019 and 2020.
Materials and methods:
A descriptive, cross-sectional and retrospective study, in which the database of the Salud Total preventive app, concerning the demographic characteristics of and usage by the Peruvian population, was reviewed during its first year of operations. Sociodemographic variables (sex and age) and usage (health data, pathological findings, frequency of use, and type and number of services requested) were analyzed. The analysis and processing of descriptive data were performed using Microsoft Excel
Results:
The number of users who downloaded and registered in the app was 9,737 people. A similar sex ratio was found, and the 21to 50-year-old group prevailed. A total of 2,254 health data voluntarily entered by the users, out of which the most reported were weight and height (45.3 %), blood pressure (20.4 %), hemoglobin (17.1 %) and waist circumference, were collected. Pathological findings such as high blood pressure (25.7 %) and overweight (58.5 %), among others, were found in the recorded data. Likewise, 1,072 different health services were requested through the app, among which medical care (58 %) and laboratory tests (32 %) stood out.
Conclusions:
Users were able to register in and interact with a preventive app in order to monitor their well-being. Moreover, they used it both to add their health data and to request remote medical care. This could be a new intervention tool for taking preventive actions, managing timely care of diseases and offering a new data source for health research.
Keywords: Mobile Applications; Disease Prevention; Health Promotion; Information Technology
Introduction
For some decades now, technological and scientific development has significantly increased the usefulness of information and communication technologies (ICTs) in various professional fields, especially in the medical field, where it has had a positive influence 1,2. According to the World Health Organization (WHO), ICTs have positioned themselves as a means for better transmission of information to benefit people 3. In turn, the support of ICTs in medical practice has given rise to what is currently known as electronic health (eHealth) 4. The Pan American Health Organization (PAHO) proposes the Strategy and Plan of Action on eHealth (2012-2017), whose objective is to ensure the sustainable development of the Member States’s health systems 5. The document highlights the different components of eHealth, including telehealth or telemedicine, electronic medical/health records, mobile health (mHealth), eLearning and standardization and interoperability 4,5.
Currently, mobile technologies are becoming an important resource for health services delivery due to their broad reach, wide acceptance and ease of use 6. According to a report by the International Telecommunication Union (ITU), there are more than 7 billion mobile telephone subscriptions across the world. In many places, people are more likely to have access to a mobile telephone than to clean water, electricity or a bank account 6.
Thanks to this high accessibility and versatility, projects have been developed to provide health information and services through messages, focused on improving quality of life and body care. Examples include heart rate monitoring, quitting harmful habits such as smoking, among others 7.
Around 97,000 health apps are available to the public, most of them for wellness and sports, while approximately 30 % are for patients and health professionals 8. According to "The App Date," almost five million people were using health apps in 2015 9.
In Peru, there are more than 39 million mobile subscribers, including rural and urban areas 9. In urban areas, mobile coverage reaches about 90 % of households 10. There is the task of maximizing the scope of health services in both urban and rural areas, and in both scenarios public health intervention through mobile technology is already possible 1.
The following are authors who have carried out research aimed at finding out the users of health apps, their willingness to use them and the way in which such apps are employed:
Singh et al. 11 conducted a study whose objective was to determine the use of mHealth apps, the attitude and trend among medical students of RajaRajeswari Medical College & Hospital, Bengaluru, Karnataka, India. Out of the 140 students who were studied, 91 % were aware of health apps and 59 % were using them on their smartphones. Most users were females (56 %). "Samsung Health," "Fitbit" and "Healthy Me" were the most commonly used apps. Being fit was the main reason for 58.7 % of them to use a health app.
Shan et al. 12 published a study on the prevalence of access to mHealth technology and its association with cardiovascular disease (CVD) risk. Data were obtained from the 2018 Health Information National Trends Survey, in which 43 % of people reported using their mobile device to achieve a health goal. Nearly 40 % used some digital device for the purpose of making a health decision and monitoring their health. More than 30 % employed a mobile device for advice and to support their points of view when visiting a clinician. A total of 28 % had texted messages to their clinician. In addition, males at risk of CVD were more likely to have a digital device to monitor their health.
Xie et al. 13 conducted a study aimed to examine the extent and demographic correlates of health app use in China and the perceived impacts of using such apps. A total of 38.4 % reported using multiple types of health apps. The most commonly used type of health app was related to healthy living, followed by measuring and recording vital signs. In addition, the authors found that health app users were mostly women from higher social classes. It was also found that those working in education and culture or disciplinary forces were more likely to believe that using health apps could increase their health knowledge and improve their health management.
In 2017, Dolado et al. 14 conducted a study whose objective was to measure the use of mHealth apps in a primary health care center, finding that 68 % of the patients used this type of apps. The most frequently used were exercise, nutrition and health services information apps. The patients learned about the apps mostly from friends or family, the Internet and social networks; and, in a lower percentage, from a health professional. Whether the users were employing these apps or not, they were mostly interested in the information that a health professional could provide them about these mobile apps.
In 2015, Krebs et al. 15 examined the use of health apps among mobile phone owners in the United States and found that 58.23 % had downloaded a health-related mobile app. The most commonly used categories were nutrition and fitness. Those more likely to use the apps were young people who had a higher income, were more educated, were Latino/Hispanic and had a body mass index (BMI) in the obese range.
In 2017, Carroll et al. 16 carried out a study aimed to describe the sociodemographic characteristics associated with health app use nationally in the United States, as well as to assess the attitudinal and behavioral predictors of the use of health apps for health promotion. The research concluded that the main users of health apps were individuals who were younger than 45 years old and females, had more education and had a higher income. Individuals with apps had a serious intention to improve fruit and vegetable consumption, engage in some type of physical activity and lose weight. Likewise, they were more likely to meet the recommendations for physical activity compared to those without a device or health apps.
Among the studies at the national level, Sánchez 17 conducted a study to determine the use and perception of ICTs among people with diabetes in Arequipa. The most used ICT was the cell phone and the mean age of the study subjects was 64 years. Less than 20 % of the participants initiated a search for information about their disease and a large number of them had problems when searching for, understanding and evaluating health-related information. Also, most of them (60 %) preferred to receive information through lectures and 32.2 % by means of ICTs (web pages or blogs).
Rivas-Nieto et al. 18 studied the perceptions and use of ICTs among patients with hypertension (HTN), dyslipidemia or diabetes. They found that more than 40 % of people used their cell phones on a daily basis. Although 48 % of patients considered that they received adequate information, more than 90 % wanted to receive more information about their disease. On the other hand, 70 % reported that they did not comply with the treatment due to forgetfulness, about 70 % would like to participate in programs using cell phones or the Internet, and most of them suggested that they could receive help from their children or grandchildren to train them in their use.
Allen et al. 19 conducted a study aimed at validating a mobile app among contacts exposed to multidrug-resistant tuberculosis in Lima, where an average registration time of four minutes per contact was found. A total of 31 respondents completed an acceptability questionnaire and reported feeling comfortable or very comfortable with the registration of their data, although 10 % expressed discomfort with the confidentiality terms. It was concluded that the app was a viable and acceptable tool for recording such contacts.
For their part, Rojas-Mezarina et al. 20, with the objective of reviewing mHealth apps created, uploaded or used in Peru until May 2019, claimed that out of a total of 66 apps identified, 47 % (n = 31) belonged to government agencies, 47 % (n = 31) were designed for administrative purposes and there was no evidence about their usability or effectiveness. Concerning the 10 most commonly used mHealth apps, approximately half of them collected user information that could be leaked, changed or lost; furthermore, six of these apps did not mention the source of the information they provided. Therefore, the authors concluded that there is an urgent need to develop a regulatory framework based on existing medical devices and health information systems.
As can be seen, the mHealth interventions that have been implemented in Peru range from the use of messages in order to encourage treatment adherence to data recording and epidemiological surveillance 1. However, there is still no published data on the use of preventive mHealth apps aimed at the general public.
At the end of 2019, the updated version of the Salud Total app, a private initiative available on the Google Play Store platform as Salud Total - Prevención, was launched in Peru and developed as a preventive tool for the general public. Through this app, users, subscribed for free, may receive personalized preventive alerts on when to perform their body function controls and preventive check-ups according to their self-reported data. In this way, people have a tool at their fingertips for automated health checks. In addition, the institution Salud Total App allows users to request remote health services from different affiliated providers.
In 2020, due to the arrival of the COVID-19 pandemic, IT platforms—especially platforms that provided health information and health services—and the Internet played a major role for human communication, and in Peru, the use of such platforms has been no exception 21-22.
Taking into account the cultural differences, reactions and idiosyncrasies of human behavior in the different latitudes, having local data regarding the characteristics of the use of ICTs and related devices is an essential component to continue with the timely and correct development of technological tools aimed at improving people’s quality of life and health. Therefore, the objective of this article is to present the first results regarding the uses and characteristics of Peruvian users of the Salud Total app in the second year after its launch.
Materials and methods
Study design and population
A quantitative, observational, descriptive, cross-sectional and retrospective study on users and their self-reported health data in the Salud Total app, during its first year of operations between October 2019 and October 2020, was conducted.
Variables and measurements
The descriptive variables of the information collected from the institution Salud Total App’s records on the characteristics of app users and uses were evaluated. Such variables were age, sex, health data, pathological findings, frequency of use, and type and number of services requested.
Statistical analysis
The analysis and processing of descriptive data, such as frequency distribution, measures of central tendency and variability, were performed using Microsoft Excel 2021.
Ethical considerations
Ethical aspects were considered. First, authorization was obtained from the institution Salud Total App for data access and use. Then, registered users accepted the terms and conditions for using the app at the time of registration, which included the permission to use the data entered for research purposes. Confidentiality of personally identifiable information was maintained at all times. Furthermore, the study protocol was approved by the Institutional Research Ethics Committee of the School of Human Medicine at Universidad de San Martin de Porres.
Results
The current version of the Salud Total app has been available on the Google Play Store platform of the Android operating system since October 2019 23. Since then, a total of 9,737 users registered during the first year, with a slight predominance of males (55.14 %) over females (44.86 %).
In terms of age group, most registered users are between 21 and 35 years of age (44.7 %), followed by the group between 36 and 50 (30 %).
On the other hand, users entered a total of 2,304 health data that were automatically requested. The most frequently reported data were weight and height (43.14 %). With these data, the app automatically calculates first the BMI, then blood pressure (19.44 %) and, thirdly, hemoglobin (16.36 %) (Table 1).
Table 1 Frequency of health data entered by the users according to types
| Frequency of health data according to types | ||
|---|---|---|
| Type | n of data | % of the total |
| Blood pressure | 448 | 19.44 |
| BMI (weight and height) | 994 | 43.14 |
| Hemoglobin | 377 | 16.36 |
| Waist circumference | 127 | 5.51 |
| Glucose | 109 | 4.73 |
| Triglycerides | 86 | 3.73 |
| HDL cholesterol | 66 | 2.86 |
| LDL cholesterol | 76 | 3.29 |
| Glycated hemoglobin (HbA1c) | 21 | 0.91 |
| Total recorded data | 2,304 | 100 |
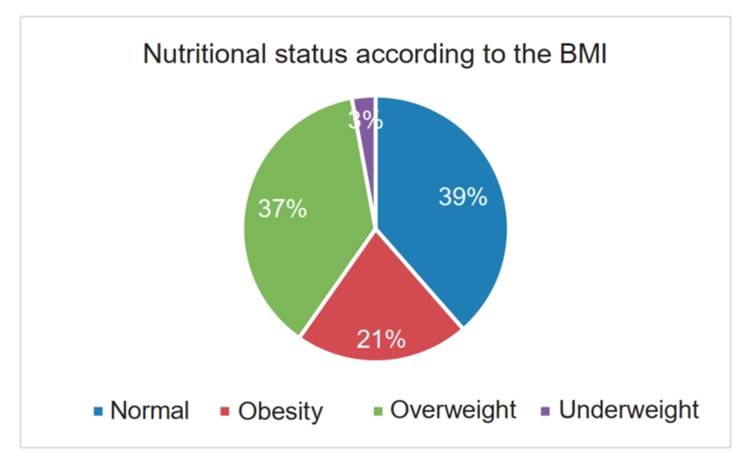
Regarding the nutritional status, based on the data entered by the users, most of them were overweight or obese (58.5 %) and the rest had normal values (38.5 %) according to their BMI. Likewise, concerning the waist circumference, 38.6 % of the users had an inadequate status (normal value: up to 90 cm for males and up to 88 cm for females) (Figure 1).
As for the lipid panel (HDL, LDL, triglycerides), 37.7 % of a total of 228 data entered showed altered values.
Concerning the users who answered the question on having been diagnosed with arterial hypertension, 32.1 % reported having this condition. Likewise, as for the blood pressure values recorded in the app, it was found that 25.7 % of the times the blood pressure was normal-high (systolic blood pressure [SBP] between 130 and 139 mmHg) or high (SBP > 139 mmHg), while 1.3 % showed low values (Table 2).
Table 2 Entered blood pressure values according to categories
| Entered blood pressure values according to categories | ||
|---|---|---|
| Category | n of data | % of the total |
| Normal | 327 | 72.9 |
| Normal-high | 65 | 14.5 |
| High | 50 | 11.7 |
| Low | 6 | 1.3 |
| Total | 448 | 100 |
Out of the total number of users, 18.90 % reported having diabetes mellitus. With regard to fasting blood glucose data, 23.85 % had elevated values (> 126 mg/dL). On the other hand, more than half of the HbA1c values were elevated (61.5 %) (Table 3).
Table 3 Entered fasting blood glucose and HbA1c values
| Entered fasting blood glucose and HbA1c values | ||
|---|---|---|
| Category | n of data | % of the total |
| Fasting glucose | ||
| Normal | 83 | 76.1 |
| Elevated | 26 | 23.8 |
| Total | 109 | 100 |
| HbA1c | ||
| Normal | 8 | 38.1 |
| Elevated | 13 | 61.9 |
| Total | 21 | 100 |
Regarding smoking, 87.28 % (1,545) of a total of 1,770 users were recorded as smokers. Additionally, out of the 71 users who entered the number of cigarettes smoked per day and the smoking time to calculate the estimated risk of lung cancer due to smoking—where the algorithm stratifies patients at risk (PYI ≤ 20)—eight (11.26 %) had some risk.
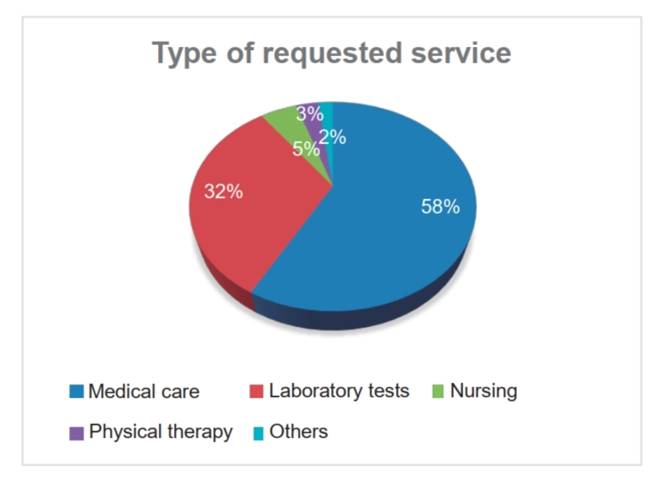
Finally, concerning the use of the Salud Total app to request health services, 5.2 % (502) of the total number of registered users made at least one medical appointment for themselves or for another person. However, a total of 1,072 health services were counted due to the frequency of requests of 39.64 % (Table 4).
Table 4 Frequency of requests for health services through the app
| Use of health services through the app | ||
|---|---|---|
| Frequency of requests | n of users | % of the total |
| Once | 303 | 60.35 |
| Twice | 82 | 16.3 |
| Thrice | 53 | 10.5 |
| > Thrice | 61 | 12.1 |
| Total | 502 | 100 |
The most frequently requested services were at-home medical care (58 %) and at-home laboratory tests (32 %) (Figure 2).
Discussion
The use of ICTs in the field of health over the last 20 years has led to the development of various intervention platforms that have shown their usefulness at different times and contexts. In our country, we still do not have much solid information on the uses and usefulness of ICTs in terms of their medical and preventive health implementation. However, with the arrival of the COVID-19 pandemic, the Internet and remote means of virtual communication have been used in a way never seen before. This has provided the initial evidence to better understand which are the most widely used means, their user population and possible impacts. Consequently, there has been a great development of ICTs and improvement of the existing platforms.
The present work is the first in our country to describe health information entered by a Peruvian population through a free-access health app. In addition, this research has allowed us to evaluate the different algorithms used to obtain health information specific to each individual, so that the recommendations resulting from such information have an impact on the decision-making of app users.
As for the number of registrations in the Salud Total app by sex, a slight majority of males has been found. This agrees with the 2020 report by the Instituto Nacional de Estadística e Informática del Perú (INEI - National Institute of Statistics and Informatics of Peru), which states that 63.4 % of males and 57.2 % of females use the Internet 24. However, it should be noted that it is well known from experience that females are more interested in preventive health issues and in seeking health care than males.
Regarding the age groups registered, people between 21 and 35 years and up to 50 years of age prevailed, probably due to the means of communication used (mobile phone), since the use of the Internet and, above all, the use of cell phones and apps is higher among young people, as claimed in the aforementioned INEI 2020 report. Such report stated that the 19 to 59 year old age group uses mobile phones more than (above 90 %) adolescents between 12 and 18 years old (82.4 %), older adults aged 60 and over (78.2 %) and children between 6 and 11 years old (43.5 %). Currently, the use of cell phones by people over 50 is increasing.
Since young people is the largest group of app users, it can be inferred that it is possible to positively influence their preventive practices through the use of ICTs.
Out of the health data automatically requested to the users, they mostly recorded their weight and height, followed by their blood pressure and hemoglobin levels. Perhaps this is explained by the traditional popularity of these parameters for the general community, i.e., an information widely disseminated by the media. Also, people often have a scale and know their height before they can measure their blood pressure or undergo laboratory tests. Next, they entered their waist circumference measurement, possibly because of the factors mentioned above. The fifth place is the recording of the fasting glucose, another data widely disseminated as an important parameter for health control. This information should be taken into account to design education strategies in order to massively use the current terms in preventive health.
The high prevalence of overweight (37.3 %) and obesity (21.2 %) found among registered users agrees with the data reported by the Instituto Nacional de Salud (INS - National Health Institute), where the prevalence of overweight in Peruvians over 15 years of age is 37.8 % and that of obesity 22.3 %. Such results are probably due to sedentary lifestyles and poor nutritional habits. Furthermore, waist circumference is considered a parameter related to cardiovascular risk 25, finding a high prevalence among users who registered this data in the app (38.6 %). This value is close to that found by Pajuelo et al. 26 among the adult Peruvian population (33.6 %) in 2019.
In conclusion, the potential of ICTs to benefit people’s health, both in terms of health promotion and disease prevention, was evident. Likewise, users of the preventive app have been able to voluntarily register their basic health data for the follow-up and control of their well-being. It can be seen that the general health data were similar to those obtained in prevalence studies. Thus, it is possible to direct the preventive actions of users who voluntarily enter their basic health data in a preventive app: a first evidence of its use in our country that also provides a new way of obtaining health data for research.
REFERENCES
1. Ruiz EF, Proano A, Ponce OJ, Curioso WH. Tecnologias moviles para la salud publica en el Peru: lecciones aprendidas. Rev Peru Med Exp Salud Publica [Internet]. 2015 ; 32( 2 ):264-72. [ Links ]
2. Prado-Cucho S, Bendezu-Quispe G. Uso de tecnologias de la informacion y comunicacion (TIC) para mejorar la adherencia al tratamiento en pacientes con enfermedades cronicas. Rev Medica Hered [Internet]. 2013 ;24(1):82-83. [ Links ]
3. Garcia-Garces H, Navarro-Aguirre L, Lopez-Perez M, RodriguezOrizondo MF. Tecnologias de la Informacion y la Comunicacion en salud y educacion medica. Rev EDUMECENTRO [Internet]. 2014;6(1):253-65. [ Links ]
4. Organizacion Panamericana de la Salud. La eSalud en la Region de las Americas: derribando las barreras a la implementacion. Resultados de la Tercera Encuesta Global de eSalud de la Organizacion Mundial de la Salud [Internet]. Organizacion Panamericana de la Salud; 2016. Disponible en: https://iris.paho.org/handle/10665.2/31287 [ Links ]
5. Pan American Health Organization. Strategy and plan of action on eHealth [Internet]. Pan American Health Organization; 2011. Disponible en: https://iris.paho.org/handle/10665.2/7663 [ Links ]
6. Organizacion Mundial de la Salud. mSalud: uso de las tecnologias moviles inalambricas en la salud publica [Internet]. Organizacion Mundial de la Salud; 2016. Disponible en: https://apps.who.int/gb/ebwha/pdf_files/EB139/B139_8-sp.pdf [ Links ]
7. Infobae. Aplicaciones tecno de salud que empoderan al paciente [Internet]. Infobae; 2015. Disponible en: https://www.infobae.com/2015/06/18/1735475-aplicaciones-tecno-salud-queempoderan-al-paciente/ [ Links ]
8. ehCOS. La revolucion del mHealth: de las apps a la gestion del dato de salud [Internet]. ehCOS; 2018. Disponible en: https://www.ehcos.com/la-revolucion-del-mhealth-en-salud/ [ Links ]
9. Guevara J. Estadisticas de consumo digital Peru 2019 [Internet]. LuJhon; 2019. Disponible en: https://lujhon.com/estadisticasconsumo-digital-peru-2019/ [ Links ]
10. Mendoza Riofrio M. Osiptel: en zona rural tres de cada diez acceden a Internet [Internet]. El Comercio; 2017. Disponible en: https://elcomercio.pe/economia/peru/osiptel-tres-diez-area-rural-accedeinternet-noticia-466446-noticia/ [ Links ]
11. Singh G, Alva S. A survey on usage of mobile health apps among medical undergraduates. Community Med Public Health Care [Internet]. 2019;6(3):1-6. [ Links ]
12. Shan R, Ding J, Plante TB, Martin SS. Mobile health access and use among individuals with or at risk for cardiovascular disease: 2018 Health Information National Trends Survey (HINTS). J Am Heart Assoc [Internet]. 2019;8(24):e014390. [ Links ]
13. Xie Z, Nacioglu A, Or C. Prevalence, demographic correlates, and perceived impacts of mobile health app use amongst chinese adults: Cross-sectional survey study. JMIR MHealth UHealth [Internet]. 2018;6(4):e103. [ Links ]
14. Dolado Martin C, Berlanga Fernandez S, Fabrellas Padres N. Uso de aplicaciones moviles de salud en usuarios de Atencion Primaria. Revista Rol de Enfermeria [Internet]. 2017;40(2):96-101. [ Links ]
15. Krebs P, Duncan DT. Health app use among US mobile phone owners: a national survey. JMIR MHealth UHealth [Internet]. 2015;3(4):e101. [ Links ]
16. Carroll JK, Moorhead A, Bond R, LeBlanc WG, Petrella RJ, Fiscella K. Who uses mobile phone health apps and does use matter? A secondary data analytics approach. J Med Internet Res [Internet]. 2017;19(4):e125. [ Links ]
17. Sanchez Rueda H. Uso y percepciones de utilidad de las tecnologias de informacion y comunicacion de pacientes diabeticos en tres establecimientos de salud Arequipa [Tesis de pregrado]. Arequipa: Universidad Nacional de San Agustin de Arequipa; 2019. Recuperado a partir de: http://repositorio.unsa.edu.pe/bitstream/handle/UNSA/8244/MDsarub.pdf?sequence=1&isAllowed=y [ Links ]
18. Rivas-Nieto A, Malaga G, Ruiz-Grosso P, Huayanay-Espinoza C, Curioso W. Uso y percepciones de las tecnologias de informacion y comunicacion en pacientes con hipertension arterial, dislipidemia o diabetes de un hospital nacional de Lima, Peru. Rev Peru Med Exp Salud Publica [Internet]. 2015;32(2):283-8. [ Links ]
19. Allen R, Calderon M, Moore DAJ, Gaskell KM, Curisinche-Rojas M, Lopez S. Factibilidad de una aplicacion movil para el monitoreo de contactos de tuberculosis multidrogorresistente en Peru. Rev Peru Med Exp Salud Publica [Internet]. 2021;38(2):272-7. [ Links ]
20. Rojas-Mezarina L, Silva-Valencia J, Escobar-Agreda S, Espinoza Herrera DH, Egoavil MS, Maceda Kuljich M, et al. Mobile Health Applications in Peru: Its necessary the develop of a specific regulatory framework? JMIR MHealth UHealth [Internet]. 2020;8(7):e16753. [ Links ]
21. Curioso WH, Galan-Rodas E. El rol de la telesalud en la lucha contra el COVID-19 y la evolucion del marco normativo peruano. Acta medica peru [Internet]. 2020;37(3):366-75. [ Links ]
22. Wilcamango-Rios D, Castillo-Narvaez G, Mamani-Urrutia V, IngaBerrospi F, Revilla-Velasquez ME. Usabilidad del proceso de atencion de salud virtual en el periodo de cuarentena en los meses de mayo a julio 2020 por COVID-19 en el Instituto Nacional de Salud del Nino de Peru. Rev Cuerpo Med HNAAA [Internet]. 2022;15(3):342-8. [ Links ]
23. Salud Total App. Salud Total App - Peru, la app para cuidar tu salud, reservar tus citas y mucho mas. Disponible en: https://www.saludtotalapp.com/ [ Links ]
24. INEI. Informe tecnico: Estadisticas de las tecnologias de informacion y comunicacion en los hogares [Internet]. INEI; 2020. Disponible en: https://www.inei.gob.pe/media/MenuRecursivo/boletines/01informe-tecnico-tic-iv-trimestre-2020.pdf [ Links ]
25. Tarqui-Mamani C, Alvarez-Dongo D, Espinoza-Oriundo P. Riesgo cardiovascular segun circunferencia abdominal en peruanos. An Fac Med [Internet]. 2017;78(3):287-91. [ Links ]
26. Pajuelo Ramirez J, Torres Aparcana L, Aguero Zamora R, Bernui Leo El sobrepeso, la obesidad y la obesidad abdominal en la poblacion adulta del Peru. An Fac Med [Internet]. 2019;80(1):21-7 [ Links ]
Received: May 16, 2023; Revised: June 09, 2023; Accepted: June 21, 2023
 Este es un artículo publicado en acceso abierto bajo una licencia Creative Commons
