


Services on Demand
Journal

Article
 Spanish (pdf)
 Article in xml format
 Article references
 Send this article by e-mail
Indicators
-
 Cited by SciELO
Related links
-
 Similars in
SciELO
Similars in
SciELO  uBio
uBio
Share

 Permalink
Revista Peruana de Biología
On-line version ISSN 1727-9933
Rev. peru biol. vol.14 no.2 Lima Dec. 2007
Javier Barrio
Department of Wildlife Ecology and Conservation, University of Florida, Gainesville, EEUU. & Centro de Ornitología y Biodiversidad (CORBIDI) , Lima , Perú .
Resumen
Se analiza las probabilidades de supervivencia de una población de tarukas (Cervidae: Hippocamelus antisensis) en el sur del Perú usando datos obtenidos en el campo, datos de otros estudios y el programa informático de simulación Vortex. Un total de 900 km2 de la sección norte de la Zona Reservada Aymara Lupaca fueron evaluados en 1997. El análisis de viabilidad poblacional mostró que esta población de tarukas es altamente sensible a cambios en la mortalidad del primer año, inmigración y fragmentación de la población. El tamaño de la población y las probabilidades de supervivencia no mostraron sensibilidad a cambios en la capacidad de carga del área o en la variación medioambiental. Los resultados de este estudio están abiertos a otras alternativas de interpretación, sin embargo la conservación y manejo de la población de tarukas en la Zona Reservada Aymara Lupaca pueden ser asistidos por los resultados del análisis de viabilidad poblacional. El análisis de viabilidad de población es una herramienta muy efectiva de bajo costo para identificar los factores que pueden afectar la supervivencia de las tarukas en el sur del Perú.
Palabras clave: análisis de viabilidad, ciervo andino, ecología de venados, manejo de fauna, supervivencia de venados.
Abstract
This study analyzes the probabilities of survival for a population of tarukas (Cervidae: Hippocamelus antisensis) in southern Peru using data gathered in the field, data from other studies and the computer-based Vortex simulation program. A total of 900km2 of the northern part of the Aymara-Lupaca Reserved Zone were evaluated in 1997. The population viability analysis showed that this taruka population exhibited a high sensitivity to changes in first-year mortality, immigration and fragmentation of the population. Taruka population size and survival probabilities did not exhibit sensitivity to changes in the carrying capacity of the area or to changes in environmental variation. Although the results of this study are open to alternative interpretation, the conservation and management of taruka in the Aymara-Lupaca Reserved Zone may be helped by the findings of the viability analysis. Population viability analysis is a cost-effective tool in identifying factors that might affect the survival of taruka in southern Peru.
Keywords: Andean deer, deer ecology, deer survival, viability analysis, wildlife management.
Introduction
The taruka, Hippocamelus antisensis (D'Órbigny, 1834), is a medium-sized deer that lives in the high Andes from northern Peru to northern Argentina and Chile (Grimwood 1969; Thornback and Jenkins 1982; Merkt 1987). Tarukas are usually found in groups above the treeline, on mountain slopes characterized by rock and cliff-like outcrops amid grassland vegetation with nearby water sources—usually a small ravine, lagoon or marsh (Jungius, 1974; Roe and Rees, 1976; Merkt, 1987; APECO, 1996; Barrio, 2004). In Peru, the taruka is categorized as Vulnerable on the threatened species list (Perú 2004). The World Conservation Union - IUCN has defined the taruka in its endangered species list as Data Deficient since 1996 (IUCN, 2007). In addition, the Convention on International Trade in Endangered Species of Wild Fauna and Flora (CITES) lists taruka in Appendix 1 (Nowak, 1991).
Taruka has a widespread distribution; however, it has low local densities (Merkt, 1987; APECO, 1996; Barrio, 1999, 2004). Low local densities make a species rare throughout its range (Rabinowitz et al., 1986; Arita et al., 1990). The rarity of a species relates to the probability of its extinction (Terborgh and Winter, 1980; Burke and Humphrey, 1987; Arita et al., 1990; Thomas and Taylor, 1990). The situation worsens if populations are fragmented (Terborgh and Winter, 1980) as with taruka. In heavily fragmented populations the vulnerability to extinction depends upon the level of isolation of each sub-population (McCullough, 1996a; Wiens, 1996). While taruka populations remain in several portions of the Andes they were already fragmented in the 1980s (Thornback and Jenkins, 1982; Cajal, 1983; Sielfeld et al., 1988; Barrio, 1999, 2004).
Population Viability Analysis
Although the survival of any species (Soulé, 1987) cannot be guaranteed, its chances in long-term persistence can be enhanced. The survival of a species can be assisted by analyzing the causes that bring about its decline and eventually extinction. Population Viability Analyses (PVA) procedures have been developed to assess and estimate species populations' vulnerability to extinction (Gilpin and Soulé, 1986; Shaffer, 1990; Lacy, 1993).
Most PVAs are currently estimated by computer simulated models (Lacy 1993; Lindenmayer et al., 1993; Lacy, 1993-4; Strier, 1993-4; Song, 1996; Marmontel et al., 1997). PVA estimates the probability of extinction by using only a small number of parameters; however, its predictions have been validated to be accurate for populations with simple structure and in constant habitats (Brook et al., 2000). It excludes variables such as social and ecological determinants of dispersal, complex social processes, and interactions with other species (Lacy, 1993-4). While PVA is speculative and predictive in a probabilistic sense (Shaffer, 1990), it is the most useful tool to address species conservation goals (Lindenmayer et al., 1993). Therefore, PVA's techniques are favored in the assessment of populations vulnerable to extinction (Mace and Lande, 1991). Population and Habitat Viability Analyses (PHVA), developed by the Conservation Breeding Specialist Group of the IUCN Species Survival Commission, fill some conservation gaps of the PVA (Lacy, 1993n4). PHVA usually indicates a collaborative workshop centered on a PVA that incorporates critical components that a PVA lacks (Brockelman, 1993-4; Lacy, 1993-4). PHVA includes conservation planning, information (subjective and objective) from experts, values obtained from related species, use of Geographic Information Systems (GIS), and sensitivity testing for uncertain parameters in a PVA (Lacy, 1993-4). PHVA has already been used for the assessment of wildlife populations and to help in their conservation and management (Brockelman, 1993-4; Rylands, 1993-4). The analysis on the taruka was developed as a PVA, with very few data turning it into a PHVA.
Study site
This study was carried out in the northern portion of the Aymara - Lupaca Reserved Zone (ALRZ), located in the southern Peruvian Andes. The ALRZ lies between 16º20' and 17º30'S and 69º40' and 69º00' W. It has an area of 323,027 ha (PELT, 1995). Biogeographically, the ALRZ is in the Puna Biome, which is characterized by cold weather, seasonal rain from December to March, and high altitudes dominated by grassland vegetation (Brack, 1986). Altitudes in the ALRZ range from 3820 to over 5000 m.
Material and methods
Fieldwork was conducted in 1997, from June to November. Taruka distribution was first determined using the areas identified by Proyecto Especial Binacional Lago Titicaca (PELT, 1995) and accounts of local people. In addition, regions that had appropriate habitat for taruka were also surveyed.
The area was surveyed by walking and searching for taruka signs (i.e., tracks or pellet-groups). All taruka signs, new and old, were recorded to determine current or past use. When very recent signs (tracks or pellet-groups from the same day) were found, they were followed until tarukas were observed. Most observations occurred within 200 m from the investigator since regularly the mountainous and rocky terrain did not permit a full view of the area. Encounters generally caused an immediate flush of the individuals involved. On areas with milder slopes, tarukas were observed from greater distances and for longer periods, but rarely for more than 20 minutes. Taruka groups were located on maps using a Trimble GPS and 1/100,000 scale maps.
Areas used by tarukas were mapped and measured, and were defined as the minimum area used based on observed distribution of tracks. For that purpose, the area was encircled taking into account geographical features and the limits to where tracks extended. Data gathered in the field on habitat and population, here used in the population viability analysis, are presented elsewhere (i.e. Barrio, 1999).
The population viability analysis for taruka was conducted using the old Vortex program version 6.40 (Lacy, 1993) using the population data obtained in the field. A newer version can be downloaded from www.vortex9.org.One thousand simulations were run to test taruka population sensitivity to each different parameter. The values used in the simulation and the rationales behind each value are as follows:
1. Number of Years: 100
Rationale: Most conservation actions are short term and even 100 years is a much longer duration than the legislative system in Peru would allow. Moreover, events more than 100 years in the future are difficult to foresee (Mace and Lande, 1991).
2. Number of populations: varied (5 and 1 populations).
Rationale: The five patches that were found in the ALRZ can be considered as individual subpopulations or as one main regional subpopulation. For analytical purposes, the Vortex program was run using the two options to test the sensitivity of the subpopulations to isolation. During the study, I did not record any taruka from one patch in a different subpopulation; indicating that the subpopulations were more or less stable. If any movement from one patch to another did occur, it was not recorded. However, migration between patches was included when five subpopulations were simulated. Then, it was assumed that 5% of the population of a patch migrated to adjacent patches each year. A single continuous population is based on movements that might occur seasonally and were not detected during the length of the study.
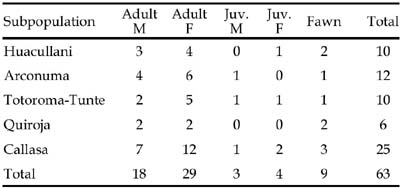
Population age and sex structure, collected June to November 1997:
3. Inbreeding depression: Heterosis model, with 3,14 lethal equivalents.
Rationale: The heterosis model selects against homozygotes without removing the genetic load. Ralls et al. (1988) used this model to show that the cost of inbreeding varied broadly among different species. According to Ralls et al. (1988), 3,14 was the median value of lethal equivalents for mammal species. Cervid species in captive populations ranged from 1,2 to 15,1 lethal equivalents. A small population size usually leads to low heterozygosity (Hedrick, 1996). The impact of low heterozygosity on the taruka population is unknown. Hedrick (1996) found that high heterozygosity levels does not always lead to high-fitness individuals, nor does low heterozygosity levels lead to low-fitness individuals. Also, a metapopulation structure could result in a low probability of extinction despite the fact that metapopulations should lead to a loss of genetic variation (Hedrick, 1996; Pimm et al., 1989).
4. Number of types of catastrophes: varied (0 and 1 type of catastrophe).
Rationale: The only known natural catastrophes for the area are droughts. Fires, another potential catastrophe, occasionally occur, but usually do not affect any of the subpopulations. Taruka in the area appear to be habituated to controlled fires used to burn old grasses to favor the growth of new ones. These fires are not large enough to threaten taruka. While a large fire could threaten individual patches, there are no records of large fires in the area. Another potential catastrophe is an epidemic. Since taruka have lived alongside livestock for hundreds of years, an epidemic threat from domestic animals is low. However, the exchange of livestock between regions could start an epidemic that would affect both local livestock and taruka. This catastrophe has yet to happen in the area. The worst recorded disease outbreaks result in the death of 40% of the individuals in a group, but at the population level, a maximum of 20% of individuals are affected (Mackintosh, 1992). These values are from farmed deer which are more susceptible to disease than wild ranging populations (Mackintosh and Beatson, 1985). Under natural conditions, deer are not efficient at propagating disease and when infected, they are usually final hosts (Mackintosh and Beatson, 1985).
5. Probabilities of droughts: 6,67%.
Rationale: Large droughts occur approximately every 15 years (Peruvian Weather Service data, in PELT, 1995). The effect of droughts on the taruka population was assumed as 80% survival of the population and 60% of the normal reproduction.
Rationale: Based on data for Cervus eldi (Song, 1996).
7. Breeding system: Polygynous.
Rationale: Based on data from Merkt (1985).
8. Age females begin breeding: Yearlings (Age class 2).
Rationale: One yearling female was pregnant from observations on captive animals in the city of Puno. Yearlings are one year-old individuals, which is age class 2 in Vortex (age class 1 is from newborn to first year). However, yearling females will give birth by the time they move into the next age class. Vortex models reproduction through the age of senescence. Taruka appear to still reproduce at an old age. One captive 9 year-old female was pregnant in the city of Puno.
9. Age males begin breeding: Two years (Age class 3).
Rationale: Male yearlings are not known to reproduce in Cervidae (Clutton-Brock and Albon, 1989). They reproduce only after two years of age, or age class 3 in Vortex.
10. Age of senescence: 12 years.
Rationale: Based on data from the Berlin Zoo, a captive taruka lived more than 10 years (Nowak, 1991). The oldest individual among the captives in the city of Puno was a healthy 9 year-old pregnant female. For the simulation the age of senescence is the age when all animals die, therefore if some tarukas might reach 11 years the age of senescence selected should be 12.
11. Proportion of males at birth: 50%.
Rationale: Based on the usual proportion found in Cervids (Boulay, 1992). The ratio of female to male taruka yearlings was 4:3, even though all four captives born in the city of Puno from 1995 to 1997 were females. In both cases the sample is too small, so it was assumed to be 1:1.
12. Maximum litter size: 1 fawn.
Rationale: The author has seen taruka twins only once, in Rio Abiseo highlands, where humid weather gives better feeding opportunities year round. While Whitehead (1972) already mentioned that twins are occasionally born, year round studies on taruka (Merkt, 1985; Sielfeld et al., 1988) have shown no evidence of twinning. Given the dry puna covering the area, it is reasonable to think that twins would be a very rare event in the area.
13. Is reproduction density dependent? : No
Rationale: Tarukas are not known to be affected by density or by group size, but studies on this species have not been of long enough duration to test density dependence. Data from Cervus elaphus does show reproduction density dependence (Clutton-Brock and Albon 1989). No density-dependence was included in the simulations because the population structure allows for emigration before any carrying capacity is reached. Also, in sample Vortex simulation runs, taruka population was always below half of carrying capacity.
14. Percent of females reproducing: Varied (96,5% and 31%).
Rationale: Two values were selected. One of them, 96,5% reproducing females, was based on 25% first year survival and backed by Sielfeld et al. (1988) findings. The other one, 31% reproducing females, was based on the ratio of fawns/females during the field work (9/29 or 31%). The values were chosen so that the number of surviving offspring per female would match the numbers that had been observed in the field. The first number used (96,5%) is based in that 7 yearlings were found, and if there was 25% first year mortality, then 28 females (or 96,5% of the total) gave birth. The birth season was four months before the study was carried out, therefore much fawn mortality was missed. That would increase the percentage of females reproducing and decrease the survival of fawns. Some of the simulations were run twice to compare the effects generated by this difference. One with 96,5% reproducing females and 25% first year survival, and another with 31% reproducing females and the observed yearling/fawn ratio (7/9, 0,778 or 77,8%) as first year survival.
15. Age specific mortality
Taruka's age specific mortality used in Vortex simulations was the following:
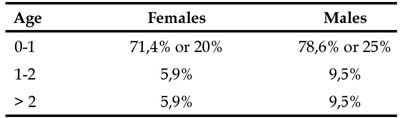
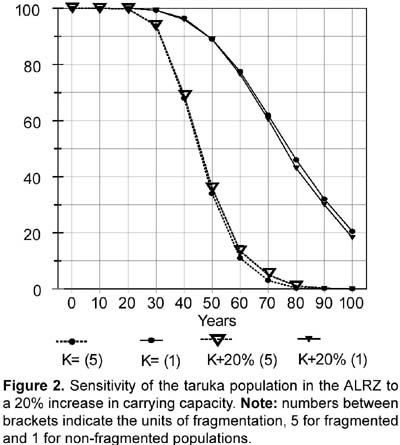
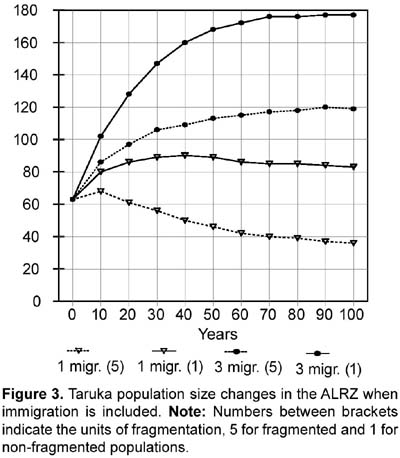
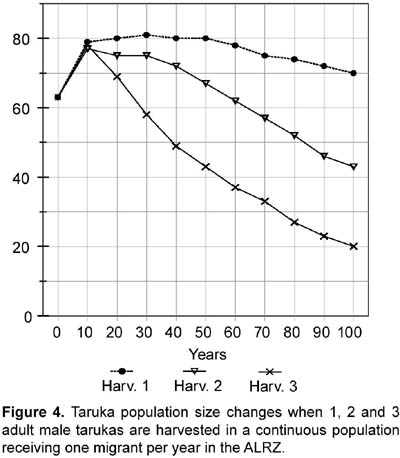
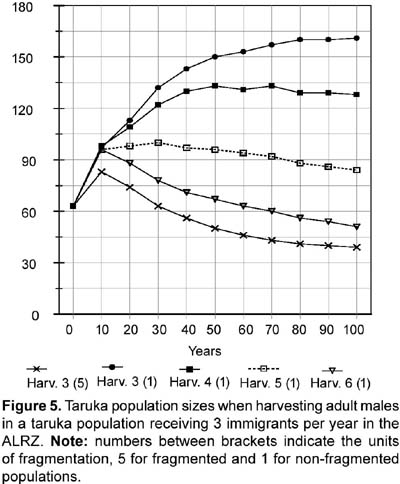
Rationale: Two values were tested for Age 0-1 mortality or first-year mortality. One value follows an overall 75% first-year mortality (i.e., 25% survival; see also above under 14. Percentage of females reproducing). First year mortality would be different for males and females assuming a 1:1 male/female ratio at birth and following the number of yearling females and yearling males present in the study (four and three). Reproductive and census data from Sielfeld et al. (1988) suggest around 75% first year mortality, a percentage also mentioned for white-tailed deer (Asher and Langridge, 1992; Boulay, 1992). Assuming 28 fawns were born (96,5% reproducing females) the specific mortality for female and male first year would be 71,4% and 78,6% respectively. The other first year mortality value tested in the simulations, 22,2%, is based on the proportion of yearlings/fawns found during the study (7/9 or 77,8% survival). Differences in female and male specific mortality (20% and 25%) are also based on a 1:1 male/female ratio at birth and the number of yearling females and yearling males present in the study. When not testing the effects caused by the different values of first year mortality, 71,4% and 78,6% were used as the first year mortality default for females and males respectively. High fecundity (see above under 14. Percentage of females reproducing) and high fawn mortality have been found for taruka (Sielfeld et al., 1988). The mortality rate for the second year (Age 1-2 or age class 2) and for the adult years were set at 5,9% for females and 9,5% for males to mathematically fit the number of female and male adults found in the study. Data for Cervus elaphus (Clutton-Brock and Albon, 1989), C. eldi (Song, 1996), and Odocoileus virginianus (Boulay, 1992) corroborate that deer mortality rate is higher in males than in females. The standard deviation on mortality caused by environmental variation (EV) was arbitrarily set at 10% (e.g., if the mortality is 5,9% the sd will be 0,59). For the simulations, the Vortex program was also run with 5 and 20% EV. The Vortex program was also used to test sensitivity to 10 and 20% decreases in first year mortality. Some fawn mortality might be caused by feral or shepherd dogs. Feral dogs are known to kill fawns and even adult tarukas (Merkt, 1985). A decrease in mortality might be achieved by controlling shepherd dogs and eradicating feral dogs. 16. Percentage of adult males breeding: 50%. Rationale: Based on data from Song (1996). Following the social structure described by Merkt (1985) it seems that in taruka groups there are a limited number of breeding males. However, in Rio Abiseo (Barrio, 2004) the three females found with fawns were seen accompanied by an adult male. Therefore, it is also probable that more than 50% of the males breed each year. 17. Stable age distribution? : No. Data gathered in the field will be used for fawns and juveniles. All adults will be assumed to be five years old. Rationale: Studies on taruka populations have been short (up to a year) and there are few data on age distribution. Five years is slightly less than the mid-age for taruka if 12 years is the maximum age reached. To test the efficiency of using the same age for all unknown individual ages in a PVA, Strier (1993-4) simulated a population of muriqui monkeys (Brachyteles arachnoides) assuming all adults to be same age. The simulation proved similar to the observed population dynamics for 12 years. 18. Carrying capacity Carrying capacity was defined for each patch: Huacullani (10), Arconuma (18), Totoroma-Tunte (30), Quiroja (61), Callasa (134), Total: 253. Rationale: Carrying capacity was estimated based on the highest density found for any patch during the study (1,76 tarukas/km2), which is also the highest density reported for the species (see APECO, 1996; Merkt, 1987). Robinson and Redford (1986) and Strier (1993-4) used the maximum density found for a species to calculate the carrying capacity of an area. The size of the area for each patch is assumed as the potential area described in the habitat analysis. The areas are added when considering the population as a whole. 19. Standard deviation in carrying capacity due to environmental variation: 10% of carrying capacity. Rationale: This variation has been set arbitrarily following Marmontel et al. (1997), Song (1996), and Strier (1993-4). In Song (1996) and Strier (1993-4) the variation in carrying capacity was set as 10% of the assumed carrying capacity, whereas in Marmontel et al. (1997) it was set as 10% of the initial population. 20. Trend in carrying capacity? Varied (None and 20% increase at the end of the tenth year, which was modeled as a 1,82% yearly increase for ten years). Rationale: Some patches are surrounded by fields of crops and others by open land. It would seem that the areas surrounded by crops might threaten taruka if they increase, but the agricultural area in the ALRZ has not changed in the past ten years. Also, there are no more potential areas for crops in the ALRZ (PELT, 1995). An increase in livestock could be harmful for taruka population and might decrease the carrying capacity of the area. However, livestock have been stable since 1982 (PELT, 1995). The 20% increase was used to test if carrying capacity was a limiting factor for the taruka population in the area. 21. Harvesting Varied (Not at all; None for the first 10 years, then 6 adult males each year, which is 10% of the initial population, or 3 adult males each year, 5% of the initial population). Rationale: Before any harvesting is done, the taruka population has to increase to near the calculated carrying capacity. After that, an unknown number of years may be necessary to change the Peruvian legislation that forbids taruka harvesting. The rationale for harvesting is that taruka conservation might be successful if local people profit from the species. A metapopulation structure of the population would decrease the potential for harvest as the harvest would endanger the survival of individual patches (McCullough, 1996b). Small, limited harvest in some metapopulations is possible, but the approach should be very cautious (McCullough, 1996b). 22. Immigration or supplementation Varied (simulations included a closed population without immigration and an open population where 1 and 3 immigrants per year were added, dividing them among the following three patches: Totoroma-Tunte, Quiroja and Callasa). Rationale: Immigration is possible and most probably does occur from outside the ALRZ to three of the patches. Young individuals (two-years olds) of both sexes were assumed to migrate between populations. The study area was considered as a sink where no emigration occurred. Simulation of the same number of emigrants as immigrants was assumed to increase heterozygosity, but not the actual population numbers; therefore, it was not included in the analyses. A closed population without immigration is explained by the likelihood that human population and land use practices do not allow taruka immigration from outside the studied area. Results Population survival probabilities of taruka obtained from the Vortex program ranged from extinct in 80 years to 100% probability to survive 100 years. With no immigration (treating the population as closed), and no decrease in first year mortality, taruka population survival probabilities in the study area varied from 0,1% probability to reach 80 years to 78% probability to survive 100 years. Taruka populations in the simulations did not exhibit sensitivity to an increase in carrying capacity or to changes in environmental variation. Taruka populations did, however, exhibit sensitivity to fragmentation, to the presence of catastrophes and to a decrease in first year mortality. The highest population survival, when neither immigration nor decrease in first year mortality were included, was 78% and occurred when the taruka population in the study area was assumed to be one continuous population and did not include any type of catastrophes. Sensitivity to fragmentation was analyzed in all possible scenarios. When sensitivity to environmental variation was not specifically tested, 10% environmental variation was used as a default for the analyses and no immigration was included. For high fecundity and high first year mortality, the probability of population survival was 21% in 100 years for a non-fragmented population and 0,2% in 90 years for a population fragmented in five units. For low fecundity and low first year mortality, the probability of population survival was 4,1% in 100 years for a non-fragmented population and 0,1% in 80 years for a population fragmented in five units (Figure 1). Taruka exhibited high sensitivity to decreases of 10 and 20% in first year mortality. If the actual population is fragmented, a 10% decrease in fawn mortality increases the probability of population survival from extinct in 90 years to 41% survival probability in 100 years. A 20% decrease in fawn mortality in a fragmented population would almost assure survival for the next 100 years, increasing survival probability to 98%. In a non-fragmented population a 10% decrease in fawn mortality increases the probability of survival to 94,2% in 100 years. If the decrease in fawn mortality is 20%, the population survival probability increases to 100%. Population sizes at the end of the 100th year when a 20% decrease in fawn mortality was tested were the highest of all simulations for both fragmented and non-fragmented populations. Population size oscillated around 175 when the population was considered fragmented and around 223 when the population was considered continuous. In the latter simulation, population size increased dramatically to 220 in the first 30 years, while a fragmented population needed 50 years to reach 175 individuals. Taruka population showed sensitivity to the presence of catastrophes. Sensitivity to catastrophes was analyzed for a non-fragmented or continuous population and for a population fragmented in five units. The analysis included 10% environmental variation and no immigration. Catastrophic events every 15 years would extinguish a fragmented population in 80 years. When no catastrophe was included, a fragmented population results in 2,6% probability to survive 100 years. Catastrophic events every 15 years decrease the probability for a non-fragmented population to survive 100 years to 22%. For a non-fragmented population, a scenario without catastrophes results in 78% probability to survive 100 years. Taruka population did not exhibit sensitivity to changes in environmental variation. Environmental variation of 5, 10, and 20% were tested including droughts as the only catastrophe and without including outside migration. Results from different levels of environmental variation overlapped each other. For a non-fragmented population all levels of environmental variation resulted in values around 20% probability to survive 100 years and for a fragmented population resulted in extinction in 90 years. Likewise, the taruka population did not exhibit sensitivity to a 20% increase in the carrying capacity of the area. Results from the established (253 individuals) and the increased carrying capacities overlapped each other (Fig. 2). For a non-fragmented population the two levels of carrying capacity resulted in values around 20% probability to survive 100 years, and for a fragmented population resulted in extinction in 90 years. Taruka populations, fragmented and non-fragmented, demonstrated high sensitivity to immigration. The simulations did not include emigration, therefore, the study area was treated as a sink. The survival probability for fragmented and non-fragmented populations in the two scenarios (one and three migrants per year) was 100% in 100 years. However, population size was notably different in all cases (Fig. 3). Taruka population size dropped below the initial population when only one immigrant per year was added to the fragmented population. Simulation of harvesting was tested on the scenarios that had at least 99% survival probability for 100 years. The scenarios that fulfilled these requirements were (1) fragmented and non-fragmented populations where one and three immigrants per year were included and (2) closed non-fragmented populations where a 20% decrease in first-year mortality was included. In all scenarios, the carrying capacity was set at 253, environmental variation was set at 10%, droughts were included, and no emigration was included. A ten year harvesting restriction was included at the beginning of the simulations. Harvesting was increasingly added until final population size dropped below 50% of the initial population (63 individuals) or survival probability dropped below 99%. A fragmented population with one immigrant per year went extinct when harvesting one adult male per year. A non-fragmented population with one migrant per year still had 100% survival probability if up to three adult males were hunted per year. However, population size would decrease to less than 70% of the starting size when hunting two adult males and to less than a third when hunting three. Hunting when only one individual is assumed to immigrate would slowly decrease the total population (Fig. 4). When three immigrants per year were included, a fragmented population might tolerate the harvesting of up to three adult males, but population size would decrease to almost 60% of the initial population (Fig. 5). A non-fragmented population would tolerate the harvesting of up to six adult males (Fig. 5). Harvesting of up to two individuals was also feasible when testing a closed continuous population with a 20% decrease in first-year mortality. Population size after 100 years in the simulations did not differ (around 220 individuals) when compared to the simulation without harvesting, but survival probability dropped to 99,5% when two individuals were harvested and to 98,8% with three. Heterozygosity levels dropped in all simulations. However, in the simulations that included immigrants, heterozygosity was always above 90% of the initial level. Simulations that included a 20% decrease in first-year mortality in a continuous population also maintained a heterozygosity level above 90%. Discussion and conclusions Many of the input values were obtained from data on other cervid species, and this lack of data on the taruka could be a major source of uncertainty in these analyses. However, most social cervid species have similar population data, and that is a good reason to expect that the values for taruka will be very similar to the other species that have been studied. Using the available data, the simulations contain most of the possible processes that act on the taruka population in the ALRZ and also some potential management practices. PVA sensitivity testing, as used in the PHVA (Lacy, 1993-4), was useful in detecting the influence of each factor on the probability of survival for taruka. Population fragmentation, even though the available habitat might be larger than the one exploited by taruka, proved to be one of the important factors in the survival of taruka. Migration from an outside source is unknown, but it proved to be an important factor for the survival of the taruka population. Migration might depend on the distance to taruka populations outside the ALRZ and will be affected by fragmentation of the habitats used by taruka outside the ALRZ. However, the most crucial factor that affected the survival of the taruka population in the simulations was first-year mortality. It will be very important to manage feral dogs or any other cause that decreases first-year survival if taruka long-term survival in the study area is desired; a decrease in first-year mortality dramatically increases survival probability and population numbers, even when taruka population is tested as fragmented. Droughts, an environmental phenomenon, should be included in all survival testing as they are unavoidable. The taruka population in the ALRZ, modeled as fragmented in five units like it was found during the study, exhibits a low survival probability. The studied taruka population might not exhibit a typical metapopulation structure where habitat is stable and there is a balance between local extinctions and patch recolonization. Although fragmentation is not explicit in the taruka population of the ALRZ, results from the PVA help understand what might be occurring if the taruka population is fragmented or what may happen if the patches that are currently used by taruka are isolated. Connections to an outside larger population and movements among the patches may help taruka to persist in the ALRZ. Connectivity induce patches to behave as a continuous population and increases the probability of survival (Wiens, 1996). Immigration dramatically increased the survival probabilities for taruka. The taruka population in the ALRZ may be non-viable if considered in isolation from other taruka populations but that does not indicate that the population in study is non-viable (Soulé, 1987). Migration should be considered as a possibility even though it has not been observed. Immigration was simulated as a similar group of migrants every same amount of years; however, a real rate of immigration might be variable. A study longer than this one is needed to evaluate migration between groups and from outside sources. Decreases in first-year mortality were crucial for the long term survival of taruka in the ALRZ. The high first-year mortality used might be common for most taruka populations (see Sielfeld et al., 1988), but it can be lowered if the unnatural factors affecting first-year mortality are identified and targeted. The only factor that currently affects the survival of the fawns that was recognized by local people was the presence of feral dogs. Andean foxes and shepherd dogs may also be included among the causes for high fawn mortality. Andean foxes are native predators and should not be exterminated in favor of taruka fawns' survival. An increase in carrying capacity was not crucial for the survival of taruka. The carrying capacity tested was more than four times the initial population and the area for potential use might be as much as twice the area currently used. However, livestock use taruka habitat and might compete with taruka mainly for space, decreasing the available area and displacing the deer (Barrio, 2004). Heterozygosity levels and the response of taruka to differences in heterozygosity are not known. Studies on heterozygosity levels on several mammal species established that responses to different heterozygosity levels vary among species (Ralls et al. 1988). Vortex always incorporates heterozygosity in the simulations as inbreeding increases with small populations causing deleterious effects (Lacy, 1993). If the deleterious effects of inbreeding in taruka are larger than the resulting from the number of lethal alleles used in the simulations, then we should expect a larger vulnerability to extinction when the population decreases. Harvesting practices are not encouraged for this small population. However, harvesting may be part of the solution to help the taruka live side by side with humans. In the simulations harvesting only proved to be successful in the best scenarios, when first-year mortality was decreased and when the population was considered as a sink receiving immigrants, but not allowing emigration. The current size of the taruka population in the study area will only allow harvesting if the population receives immigrants. Otherwise, harvesting would only be possible with management practices that will allow the taruka population to grow. Acknowledgements The author thanks the Lincoln Park Zoo _ Scott Neotropical Fund and the University of Florida Center for Latin American Studies' Tinker field grants for providing funding for the fieldwork. Richard Bodmer greatly help with his advise. Leonardo Borda was invaluable in the field as a guide. 
Cited literature
Asociación Peruana para la Conservación de la Naturaleza (APECO). 1996. Evaluación preliminar del estado de la población de tarucas Hippocamelus antisensis en el Parque Nacional del Río Abiseo (PNRA) y de sus requerimientos de conservación. APECO, Cooperación Técnica Holandesa - Embajada de los Países Bajos. Perú.
Arita, H., J. Robinson & K. Redford. 1990. Rarity in Neotropical forest mammals and its ecological correlates. Conservation Biology 4: 181-192.
Asher, G. W. & M. Langridge. 1992. Seasonal patterns of births, female reproductive success and causes of neonate mortality of farmed red deer and fallow deer in northern New Zealand. In: R. D. Brown, ed. The biology of deer. Springer-Verlag, New York. Pp 217.
Barrio, J. 1999. Población y hábitat de la taruka en la Zona Reservada Aymara-Lupaca, Perú. In: T. Fang, O. Montenegro, and R. Bodmer, eds. Manejo y Conservación de Fauna Silvestre en América Latina. La Paz, Bolivia. Pp. 453-460
Barrio, J. 2004. Possible cattle influence on the population of two deer species at the highlands of Rio Abiseo National Park, Peru. IUCN Deer Specialist Group News 19: 6-9.
Boulay, M. 1992. Mortality and recruitment of white-tailed deer fawns in the wet prairie/tree island habitat of the everglades. Master Thesis. Wildlife Ecology and Conservation. Gainesville, University of Florida.
Brack, A. 1986. La Fauna. En: Gran Geografía del Peru, Vol. 3. Manfer-Mejía Baca Ed. Barcelona, España.
Brockelman, W. Y. 1993-4. PHVA workshop: learning to help the gibbons of Thailand. Primate Conservation 14-15: 58-63.
Brook, B., J. O'Grady, A. Chapman, M. Burgman, H. Akçakaya & R. Frankham. 2000. Predictive accuracy of population viability analysis in conservation biology. Nature 404: 385-387.
Burke, R. & S. Humphrey. 1987. Rarity as a criterion for endangerment in Florida's fauna. Oryx 21: 97-102.
Clutton-Brock, T. & S. Albon. 1989. Red deer in the highlands. BSP Professional Books. Oxford, U.K.
Cajal, J. L. 1983. La situación del taruka en la provincia de La Rioja, República Argentina. Programa Nacional de Recursos Naturales Renovables. Buenos Aires, Argentina.
Gilpin, M. & M. Soulé. 1986. Minimum viable populations: processes of species extinction. In: M. Soulé, ed. Conservation biology: The science of scarcity and diversity. Sinauer Associates, Sunderland, Mass. Pp. 19-34.
Grimwood, I. 1969. Notes on the distribution and status of some Peruvian mammals. American Committee for International Wildlife Protection and New York Zoological Society. New York.
Hedrick, P. 1996. Genetics of metapopulations: aspects of a comprehensive perspective. In: D. McCullough, ed. Metapopulations and wildlife conservation. Island Press, Washington, D.C., and Covelo, California. Pp. 29-51.
Jungius, H. 1974. Beobachtungen am Weißwedelhirsch und an anderen Cerviden in Bolivien. Zeitschrift für Säugertierkunde 39: 373-383.
Lacy, R. 1993. VORTEX: A computer simulation model for Population Viability Analysis. Wildlife Research 20: 45-65.
Lacy, R. 1993-4. What is Population (and Habitat) Viability Analysis? Primate Conservation 14-15: 27-33.
Lindenmayer, D., T. Clark, R. Lacy & V. Thomas. 1993. Population Viability Analysis as a tool in wildlife conservation policy with reference to Australia. Environmental Management 17: 745-758.
Mace, G. & R. Lande. 1991. Assessing extinction threats: Toward a reevaluation of IUCN threatened species categories. Conservation Biology 5: 148-157.
Mackintosh, C. G. 1992. Observations on the relative susceptibility to disease of different species of deer farmed in New Zealand. In: R. Brown, ed. The biology of deer. Springer-Verlag, New York. Pp. 113-119.
Mackintosh, C. G. & N. S. Beatson. 1985. Relationships between diseases of deer and those of other animals. The Royal Society of New Zealand Bulletin 22: 77-82.
Marmontel, M., S. Humphrey & T. O'Shea. 1997. Population Viability Analysis of the Florida Manatee (Trichechus manatus latirostris), 1976-1991. Conservation Biology 11: 467-481.
McCullough, D. 1996a. Metapopulations and wildlife conservation. Washington, D.C. and Covelo, California: Island Press.
McCullough, D. 1996b. Spatially structured populations and harvest theory. Journal of Wildlife Management 60: 1-9.
Merkt, J. 1985. Social structure of Andean deer (Hippocamelus antisensis) in southern Peru. Masters Thesis. University of British Columbia, Vancouver, Canada.
Merkt, J. 1987. Reproductive seasonality and grouping patterns of the north Andean deer or taruca (Hippocamelus antisensis) in southern Peru. In: C. Wemmer, ed. Biology and management of the Cervidae. Smithsonian Institution Press, Washington, D.C. Pp 388-401.
Nowak, R. 1991. Walker's mammals of the World. The Johns Hopkins University Press, Baltimore, Maryland, and London, U.K.
Perú. 2004. Decreto Supremo Nº 034-2004-AG, Ministerio de Agricultura. Aprueban categorización de especies amenazadas de fauna silvestre y prohíben su caza, captura, tenencia, transporte o exportación con fines comerciales, publicado en El Peruano: normas legales, el 22 de setiembre del 2004.
Pimm, S., J. Gittleman, G. McCracken & M. Gilpin. 1989. Plausible alternatives to bottlenecks to explain reduced genetic diversity. TREE 4: 46-48.
Programa Especial Lago Titicaca (PELT). 1995. Diagnóstico socioeconómico de la Zona Reservada Aymara - Lupaca. Puno, Perú: Convenio PELT - CEDAFOR.
Rabinowitz, D., S. Cairns & T. Dillon. 1986. Seven forms of rarity and their frequency in the flora of the British Isles. In: M. Soulé, ed. Conservation biology: The science of scarcity and diversity. Sinauer Press, Sunderland, Massachusetts. Pp 182-204.
Ralls, K., J. Ballou & A. Templeton. 1988. Estimates of lethal equivalents and the cost of inbreeding in mammals. Conservation Biology 2: 185-193.
Robinson, J. & K. Redford. 1986. Body size, diet and population density of Neotropical forest mammals. American Naturalist, 128: 665-680.
Roe, N. & W. Rees. 1976. Preliminary observations of the taruca (Hippocamelus antisensis: Cervidae) in southern Peru. Journal of Mammalogy 57: 722-730.
Rylands, A. 1993-4. Population viability analysis and the conservation of the lion tamarins, Leontopithecus, of South-East Brazil. Primate Conservation 14-15: 34-42.
Shaffer, M. 1990. Population Viability Analysis. Conservation Biology 4: 39-40.
Sielfeld, W., C. Carrasco, G. González, J. Torres, A. Carevic & I. Lanino. 1988. Estudio de la taruca (Hippocamelus antisensis) en Chile. Universidad Arturo Prat. Proyecto CONAF/PNUD/FAO-CHI/83/017.
Song, Y. 1996. Population Viability Analysis for two isolated populations of Hainan Eld's deer. Conservation Biology 10: 1467-1472.
Soulé, M. 1987. Viable populations for conservation. Cambridge University Press, Cambridge, U.K.
Strier, K. 1993-4. Viability analyses of an isolated population of muriqui monkeys (Brachyteles arachnoides): implications for primate conservation and demography. Primate Conservation 14-15: 43-52.
Terborgh, J. & B. Winter. 1980. Some causes of extinction. In: M. Soulé and B. Wilcox, eds. Conservation biology: an evolutionary-ecological perspective. Sinauer, Sunderland, Massachusetts. Pp 119-133
Thomas, D. L. & E. J. Taylor. 1990. Study designs and tests for comparing resource use and availability. Journal of Wildlife Management 54: 322-330.
Thornback, J. & M. Jenkins. 1982. The IUCN Mammal Red Data Book. Part 1: Threatened mammalian taxa of the Americas and the Australasian zoogeographic region (excluding Cetacea). IUCN, Gland, Switzerland.
Whitehead, K. 1972. Deer of the World. The Viking Press. New York.
Wiens, J. 1996. Wildlife in patchy environments: metapopulations, mosaics, and management. In: D. McCullough, ed. Metapopulations and wildlife conservation. Island Press, Washington, D.C. and Covelo, California. Pp. 53-84.
World Conservation Union - IUCN. 2007. The 2007 IUCN Red List of Threatened Animals. IUCN. Gland, Switzerland.
Correspondencia
Department of Wildlife Ecology and Conservation, 303 Newins-Ziegler Hall, University of Florida, Gainesville, FL 32611, EEUU. &
Centro de Ornitología y Biodiversidad (CORBIDI) Santa Rita 105, Dpto. 202, Urb. Huertos de San Antonio, Lima 33, Perú.
Email Javier Barrio: javbar@gmail.com
Presentado: 29/11/2006
Aceptado: 10/11/2007
