


 Inglés (pdf)
 Articulo en XML
 Referencias del artículo
 Enviar articulo por email
 Citado por SciELO
  Similares en
SciELO
Similares en
SciELO  uBio
uBio 
 Permalink
Introduction
X- and Y-chromosomes have two regions, the pseudoautosomal region (PAR) which is the recombining region and, the X-specific and Y-specific (MSY) regions that do not paired and therefore do not recombine during meiosis (Graves 2006). Absence of recombination at meiosis characterizes the MSY region that is poorly conserved. The MSY contains X-transposed genes (99% sequence similarity with X), X-degenerate genes (60 to 96% similarity with the X), ampliconic genes and sequences, and centromere repetitive sequences (Skaletsky et al. 2003). X-degenerate Y-chromosome genes are single copy genes (SRY, RPS4Y1, ZFY, TBL1Y, PRKY, USP9Y, DDX3Y, UTY, TMSB4Y, NLGN4Y, CYorf15A and 15B, JARID1D, EIF1AY, and RPS4Y2), have an X-chromosome homolog, are described as housekeeping genes and have broad expression profiles. However, expression profile studies of these genes have not been oriented to assess differences of expression of transcript isoforms. Similarly, evaluation of expression patterns of the Y-encoded vs. X-encoded copies of the genes in males and their effect on maleness and male fertility has not been done. The underlying reasons for the latter is the paucity of sequence information available for bovine Y-chromosome genes and the difficulties inherent in generating complete gene sequences with short next generation sequencing reads. It has only recently been possible to generate long complete single molecule reads with acceptable sequencing error levels that allow transcript sequence comparisons and detection of possible isoforms.
Objectives
Characterize X-degenerate Y-chromosome genes by comparing Iso-seq data to the available bovine genomic BTAY and BTAX and other available vertebrate transcriptomic sequences.
Identify specific sequence priming sites to distinguish Y-encoded from X- encoded expression of X-degenerate genes in male tissues.
Characterize the expression of these genes in somatic and gonadal tissues.
Material and methods
Animals and tissue samples: 14 tissue samples per animal including liver, kidney, spleen, cerebellum, hypothalamus, pituitary, adrenal gland, heart, longisimus dorsi, semitendenous, lymph node, spinal cord, lung, testis and ovary were collected from four (two male and two females) one-week-old sire half-sibs Holstein calves. After collection, tissues were immersed in liquid nitrogen and transferred to -80 °C storage.
Single molecule IsoSeq sequencing: The protocol as described by Minoche et al. (2015) was used with some modifications. RNA was extracted with Trizol reagent followed by ethanol precipitation. RNA preparation was dissolved in water, and treated with DNase I to remove contaminating DNA. Treated preparation were purified using MinElute columns (Qiagen). RNA was converted to cDNA using the Clontech SMRTer cDNA synthesis kit that includes a polyA purification step. cDNA was amplified by 8 ‒ 12 cycles of PCR using primers for the polyA-end and the switching oligonucleotide to enrich for full-length transcripts. Amplified cDNA was separated into size fractions using an ELF device (Sage), with fractions combined into four pools of 1 ‒ 2, 2 ‒ 3, 3 ‒ 5, and >5 kb. Individual size fractions were re-amplified as before, and the amplification products were transformed into standard libraries for sequencing using the SMRTbell Template Prep Kit 1.0 (Pacific Biosciences, CA) as directed. For the 3 ‒ 5 and >5 kb size fractions, the finished libraries were size selected via ELF a second time, to remove PCR-generated non-full-length molecules that were observed to interfere with efficient production of full-length sequence in these size classes.
Four size classes of transcripts in library form for each tissue were sequenced on the RSII platform using P6/C4 chemistry (Pacific Biosciences). Sixteen sequencing cells, four per size fraction, were used to generate sequencing reads. Average polymerase read lengths were 12 ‒ 21 kb per library. Data was analyzed with the SMRT v2.3 software that uses the RS_IsoSeq.1 module to predict consensus isoforms followed by the use of the Quiver module to polish the isoforms.
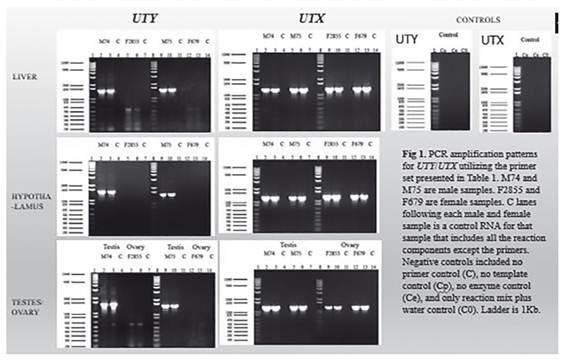
Reverse transcription and PCR amplifications: Specific primer pairs (not shown) were designed for each Y-encoded and X-encoded gene. The Reverse Transcript Polymerase Chain Reaction (RT-PCR SuperScript III one-step RT-PCR System with Platinum Taq DNA polymerase, Invitrogen, CA) was used to generate the first strand cDNA according to manufacturer’s protocol. Gene expression analysis followed the protocol for SuperScript III one-step RT-PCR System with Platinum Taq DNA polymerase (Invitrogen, CA). PCR was performed in 20 μL reaction mixtures with 60 ng of RNA, 10 μM of each primer, 10 μL of 2X Reaction Mix, 0.8 μL of SuperScript III RT/Platinum Taq Mix and water to a total volume to 20 μL. RT-PCR conditions were an initial 30 min at 55 ℃ for cDNA synthesis, followed by 2 min at 94 ℃ denaturation and 40 cycles of: 15 sec at 94 ℃, 30 sec at proper annealing temperature, based on primer melting temperature, 1 min per kilobase (kb) at 68 ℃, followed by 5 min at 68 ℃ and a final hold at 4 ℃. Beta-actin primers were used for positive control reactions. Negative controls included no primer control (C), no template control (Cp), no enzyme control (Ce), or only reaction mix plus water control (C0). PCR products were separated in 1% agarose gels run at 100 volts for 1 hour with 1 Kb plus DNA ladder marker (Invitrogen, CA).
Bioinformatics: Polished isoforms were aligned to bosTau7 (contains Y-chromosome sequences) for male tissues and bosTau8 (does not contain Y-chromosome sequences) for female tissues to identify all possible gene transcript locations and generate sorted SAM files. All unmapped reads/transcripts were added back to the SAM file. For genes for which there are bovine sequences available a FASTA file of those sequences was generated to search for similar genes in the transcriptome files with the Module FASTA36. For genes for which there is no bovine sequence available an amino acid FASTA file of orthologous (human, mouse, etc.) sequences were created to search the transcriptome files with the tFASTx36 module. Multiple sequence alignments were carried out with Clustal Omega software (http://www.ebi.ac.uk/Tools/msa/clustalo/). These alignments along with data visualization using IGV or IGB browsers facilitated the identification of gene isoforms.
Results
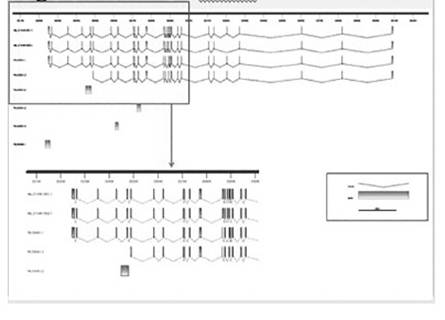
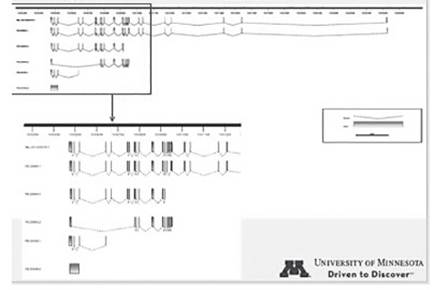
Sequence comparisons allowed the development of specific primers pairs (not shown) targeting gene sequence sites that differ between the Y encoded and the X encoded copies of these genes. Specific amplification of the X-degenerate Y-chromosome and X encoded copies was possible for 40% of the genes. Figure 1 shows the amplification observed for UTY and UTX in three different tissues. Similarly, based on the sequence transcript information we have identified the existence of four isoforms, two that were already predicted and two that are new for UTY (Fig. 2). Similarly, three new isoforms and two already predicted isoforms were identified for UTX (Fig. 3).
Conclusions
The use of single molecule sequencing in real time generated sequence reads between 1000 bp and greater than 7000 bp. The latter allowed the identification of mRNA isoforms for the genes under study and facilitated reliable sequence comparisons among them. For some of the X-degenerate Y-chromosome genes it has been possible to generate PCR primers that specifically amplify Y-encoded and X-encoded transcripts in male tissues. An assessment of differential amplification of those transcripts and their isoforms across somatic and gonadal tissues will be possible in the future, opening up the possibility to evaluate the effect of these genes in maleness and male fertility.

