


 Inglés (pdf)
 Articulo en XML
 Referencias del artículo
 Enviar articulo por email
 Citado por SciELO
  Similares en
SciELO
Similares en
SciELO  uBio
uBio 
 Permalink
Introduction
Puya raimondii Harms is an emblematic species, endemic to the high elevation Andes of Peru and Bolivia (Smith & Downs 1974), commonly known as Chara, Ccara, Titanka, Santon, Keshke, Púa, Tica and Jjatun kisa in different localities of Peru. It is a giant plant reaching an average height of 15 m, having the largest inflorescence in the plant world (Villiger 1981; Rivera 1985). The species blooms after dozens of years (ca. 100 years) and once it does, it dies, characteristic of monocarpic plants (Benzing 2000). Puya raimondii plays an important role in the ecosystem as a refuge, food source and nesting place for birds (Dorst 1956; Salinas et al. 2007). It inhabits acid and rocky or stony soils with moderate to very strong slopes (Villiger 1981), with low relative air humidity, high radiation, extreme temperatures and strong winds, conditions typical of the Puna.
The distribution of P. raimondii ranges from the department of La Libertad in northern Peru, to the departments of Puno and Moquegua in the south, between 3600 and 4800 m of altitude (Raimondi 1874; Venero & Hosting 1986), and from 8.068501°S to 16.180580°S. Although the species extends to Bolivia (latitude 19.666045°S. In Peru, P. raimondii has its largest widespread, and the most numerous populations.
The main threats to their survival are anthropogenic disturbances, such as mining, road construction, cattle grazing, expansion of agricultural lands, and burning, which occurs as part of traditional activities, or due to accidental causes (Hartman 1981; Rivera 1985; De La Cruz 1999; Vadillo et al. 2007). Therefore, the species is threatened and classified as Endangered, according to Supreme Decree N⁰ 043-2006-AG and the Red List of Threatened Species of the International Union for Conservation of Nature (IUCN). Currently, there are four conservation areas centered in populations of P. raimondii located in northern and central Peru: the Huascarán National Park (Ancash), the Calipuy National Sanctuary (La Libertad), the Nor Yauyos Cocha Landscape Reserve (Junin-Lima) and the Titankayocc Regional Conservation Area (Ayacucho). However, it is unknown whether these conservation areas are protecting the existing genetic diversity, thus there is the need for including its southern range and for the establishment of a National Conservation Plan for the species.
Is currently known that the molecular research level allows the quantification of genetic diversity and genetic relationships among populations (Godefroid et al. 2011, Weeks et al. 2011, Shapcott et al. 2017). Therefore, understanding the genetic diversity of populations provide us with the scientific bases to make decisions on conservation issues, as well as to improve in situ conservation strategies.
Previous genetic studies of P. raimondii retrieved contrasting results. Sgorbati et al. (2004), using Amplified Fragment Length Polymorphism (AFLP) and Random Amplified Polymorphic DNA (RAPD) markers, found that the genome of P. raimondii was extremely uniform, with high levels of genetic similarity among populations, suggesting that the species probably will not have enough genetic variability to survive anthropogenic pressure and climate change, even though the species thrives in a hostile environment. Later, a study by Hormung-Leoni et al. (2013), compared populations from the Huascarán National Park and its neighbouring areas, using AFLP markers, finding that 136 out of 172 loci (79.1%) were polymorphic, showing high genetic variation among populations. However, the markers used in both studies have certain disadvantages, such as dominance, reproducibility, and medium levels of polymorphis (Lower et al. 2004).
Therefore, there is not a conclusive answer regarding levels of genetic variability in Puya raimondii, information that is essential if we want to conserve its genetic diversity in its entirety.
On the other hand, Vadillo (2011) studied the morphological variability of 15 Peruvian populations and reported the presence of two morphotypes. She found variation in number of spines and leaf apex, being able to distinguish populations from central and southern Peru. But genetic differentiation between both morphotypes has not yet been corroborated.
In this study, we used microsatellite markers (SSRs) designed by Tumi et al. (2020), specific for P. raimondii, to evaluate genetic diversity and genetic structure among sampled populations of P. raimondii in correspondence with the previously reported morphotypes of central and southern Peru.
Material and methods
Three populations of P. raimondii were sampled: (1) Pachapaqui, located in the Aquia District, Province of Bolognesi, Department of Ancash; (2) Yanacancha, District of Yanacancha, with both the Huascar and Cachi sectors located in the Province of Chupaca, Department of Junin; and (3) Lampa - Choconchaca sector, located in the District of Lampa, Province of Lampa, Department of Puno (Fig. 1 and Table 1). These populations were spatially delimited from detectable individuals in high-resolution satellite images obtained from Google Earth.
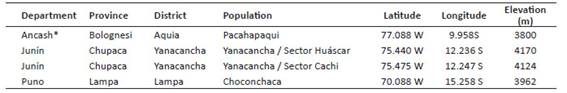
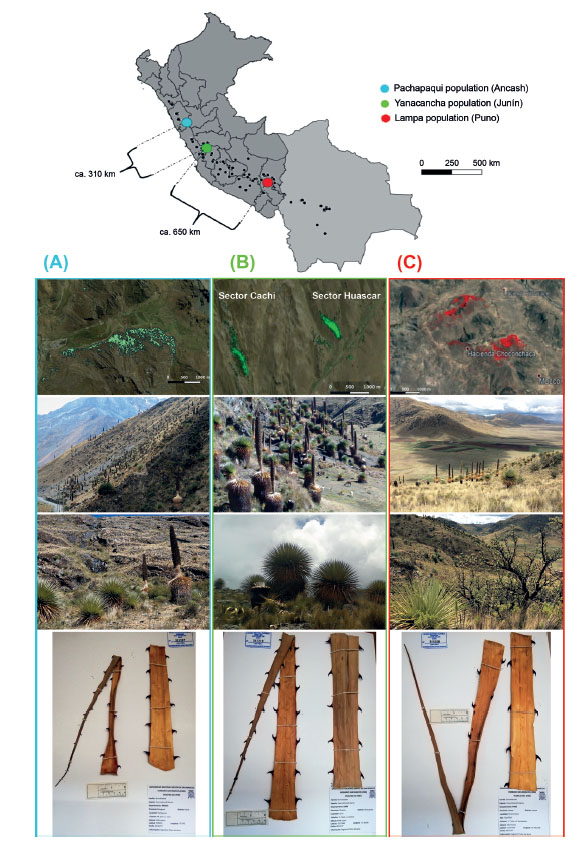
Figure 1 Distribution of Puya raimondii populations in Peru and Bolivia, and study area: (A) Google Earth view of the Pachapaqui population (Ancash) at a scale of 1:60,000, landscape view, individuals of P. raimondii, and herbarium specimen; (B) Google Earth view of the Cachi and Huascar sector of the Yanacancha population (Junín) at a scale of 1:60,000, landscape view, individuals of P. raimondii, and herbarium specimen; (C) Google Earth view of the Choconchaca sector of the Lampa population (Puno) at a scale of 1:60,000, landscape view, individuals of P. raimondii, and herbarium specimen.
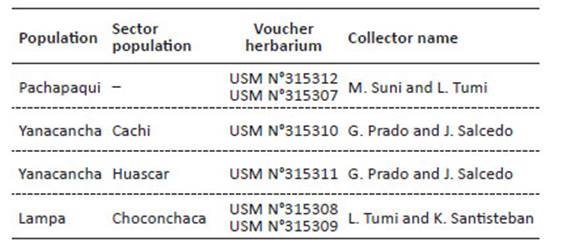
Sample collections. Leaves were collected from 28 individuals from the Pachapaqui population, 15 individuals from the Cachi sector, 14 individuals from the Huascar sector of the Yanacancha population and 27 individuals from the Choconchaca sector of the Lampa population. Individuals of P. raimondii sampled had an average height of 1.50 m (juvenile stage) and were chosen at a minimum distance of 10 m between them to avoid the collection of clones or close relatives. Six samples of ca. 4x5 cm2 were taken close to the apex of two young leaves located at the top of the foliage. Leaves near the apex had tender leaves while those at the base were thick and hard. Leaf fragments obtained were free of pathogens and mechanical damage, and did not include the midrib. They were deposited in Ziploc plastic bags with a proportion of 10:1 silica gel and sample. Leaf samples were deposited in the USM herbarium of the Museo de Historia Natural (MHN), Universidad Nacional Mayor de San Marcos (UNMSM) (Table 2).
DNA extraction and microsatellite genotyping. Total genomic DNA was isolated from silica-gel dried leaf tissue using the CTAB method (Doyle & Doyle 1989) at the Molecular Ecology Laboratory, South China Botanical Garden - UCAS. Initial DNA isolations were not of good quality, but the use of tender leaves and quick tissue disruption with liquid nitrogen provided optimal results. For DNA quality verification, a 1% agarose gel was run, and quality scanned by an ABI PRISM 3100 Genetic Analyzer using GeneScan 500 LIZ.
Twelve microsatellite (SSR) primers pairs developed for P. raimondii by Tumi et al. (2019) were used. These markers proved to be polymorphic and were successfully tested in the population of Pachapaqui, Yanacancha and Choconchaca (Tumi et al. 2019).
Amplification of microsatellite markers. For the SSR amplifications, PCR reactions were performed with three primers, a sequence-specific forward primer with an M13 (-21) tail at its 5 'end, a second sequence-specific reverse primer, and a universal M13 (-21) primer labeled with one of the following fluorophores: FAM, ROX, HEX and TAMRA; obtained from Invitrogen, Guangzhou, Guangdong, China (Yuan et al. 2017).
The PCR amplifications were carried out with Primer Takara Star HS DNA polymerase (Takara BIO INC), with a mixture that included 2 µL of 5X Takara buffer mix, 0.08 µL of dNTP, 0.1 µL of Primer F-M13, 1 µL of Primer R, 1 µL of X -M13 (FAM, ROX, HEX, TAMRA), 1µ L of DNA and 4.2 µL of H2O, for a final volume of 10 µL. The amplification program had the following conditions: an initial denaturation phase at 94 °C for 3 minutes, followed by 35 cycles of denaturation at 94 °C for 30 seconds, annealing at 60 °C for 30 seconds, extension at 72 °C for 1 minute and a final extension at 72 °C for 5 minutes. The multiplex PCR products were electrophoresed in a DNA sequencer to MAJORBIO, Shanghai Majorbio Bio-pharm Technology Co. Ltd. Guangzhou Branch.
Data analysis. The electropherograms obtained were analyzed with the GeneMarker V.1.5 (Val) program (State College, PA 16803, USA) to assign the molecular weights for the alleles obtained. The alleles represented as peaks in the electropherograms are measured in URF (fluorescence units) and they must exceed 100 URF (Acuña 2016) to be considered true alleles (not noise). Once the molecular weights were obtained, the data was exported to Excel format for genotype data analyses.
The genetic diversity was quantified through the number of alleles per locus (A), allelic frequencies, observed heterozygosity (Ho), expected heterozygosity (He) and average heterozygosity with GenAlEX 6.5 (Peakall & Smouse 2012). The Polymorphic Contet Index (PIC) was calculated with Cervus 3.0.7 (Marshall et al. 1998). The Hardy-Weinberg Equilibrium (EHW) was evaluated with the Genepop 4.7.5 program (Raymond & Rousset 1995), for the AMOVA test (Meirmans 2012) the Genepop program and the Arlequin program version 3.5 (Excoffier & Lischer, 2010) were also used two groups were assigned with number of permutations of 1000, both corroborated with the GenAlEX program. On the other hand, the population genetic structuring was evaluated first with the Genetix program and later with the STRUCTURE v.2.3 program (Pritchard et al. 2010) with parameter set such as Length of burnin period of 10000, number of MCMC of 10000, using Admixture Model and number of iterations was three, where we worked with a grouping range from K = 1 to K = 4 and with the Structure Harverster Web program v0.6.94 (Earl & VonHoldt 2012), where the files of the generated likelihood probabilities were used; finally with the Delta K method (Evanno et al. 2005) the optimal K value was obtained based on the logarithmic probability method.
Results
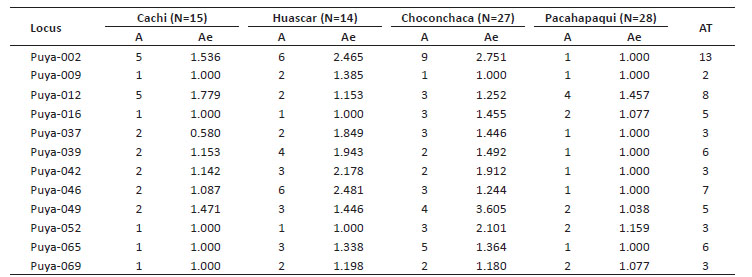
Measurement of genetic diversity. The allele number (A) per locus was 1 - 9, and loci Puya-002, Puya-012 and Puya-046 presented the highest values (Table 3). Regarding allele frequencies per population, there were alleles with high and low frequencies; some of them presented exclusive alleles and alleles in common, resulting in a total of 8 common alleles for the three populations, loci Puya-002, Puya-065, Puya-009, Puya-037, Puya-042, Puya-046, Puya-052, and Puya-069. The Choconchaca sector of the Lampa population presented the highest number of exclusive alleles (18), followed by the Yanacancha population (13) and the town of Pachapaqui (4).
Table 3 Number of alleles for Puya raimondii populations from Yanacancha (Cachi and Huascar sectors), Choconchaca and Pachapaqui.
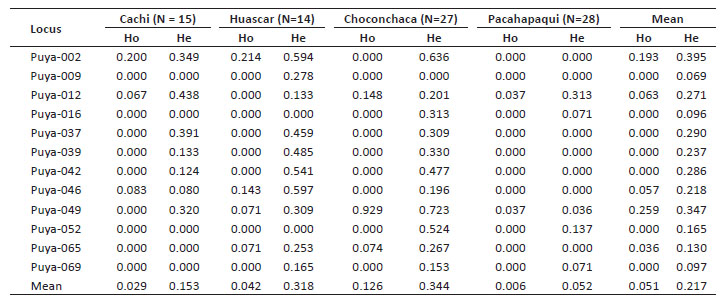
The expected heterozygosity (He) values in the populations ranged from 0 to 0.723, and values of observed heterozygosity (Ho) ranged from 0 to 0.929. The populations showed an average He of 0.344, 0.318, 0.153, and 0.052 for Choconchaca, Huáscar, Cachi, and Pachapaqui respectively.
The analysis did not show a perfect correspondence between He and Ho, given that for certain loci the value of Ho was greater than He and viceversa. For the analysis by study location, the Cachi sector of the Yanacancha population presented a He of 0 to 0.438, while the Huascar sector of the Yanacancha population presented a He of 0 to 0.597. For the Pachapaqui population, the He was 0 to 0.313, and for the Choconchaca sector of the Lampa population, the He was 0 to 0.723 (Table 4).
Table 4 Heterozygosity estimates calculated for populations of Puya raimondii included in this study, using twelve microsatellite loci.
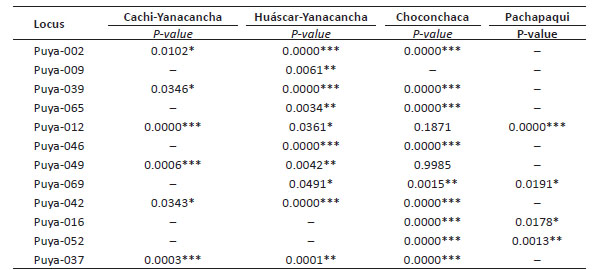
The evaluation of HWE assumed as a null hypothesis that there was equilibrium of H-W. When performing the analysis by population, the population of Yanacancha, Cachi sector, showed significant values for 6 loci with deviation from HWE; unlike 6 loci that did not show results because they were monomorphic. For the Huascar sector of the same population, 10 loci resulted in deviations from HWE and only 2 loci were monomorphic. For the Choconchaca sector of the Lampa population, there were 2 loci without deviation of HWE, the others showed significant values; it was also found that only 1 locus was monomorphic. Finally, the Pachapaqui population showed 4 loci with deviation from HWE, and 8 loci were monomorphic (Table 5).
Table 5 Evaluation of HWE for the twelve loci in the Yanacancha (Cachi and Huascar sectors), Lampa (Choconchaca sector), and Pachapaqui populations.
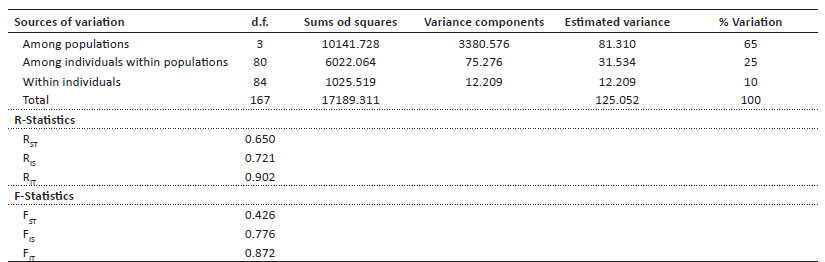
Analysis of the population structure. AMOVA test showed that 65% of the genetic variation occurs at the population level; in other words, the genetic variation is high among each one of the evaluated populations, unlike genetic variation within individuals, where a low value (10%) was obtained. Using AMOVA, the F and R statistics were also obtained, under the random variance and stepwise mutation models respectively. For the FST fixation coefficient, it was 0.426 that according to the range of 0 to1 indicates a very high FST value; the FIS value was 0.776, a value that according to the range of -1 to 1, would indicate deficiencies of heterozygotes. On the other hand, the RST value was 0.650, also a very high value (Table 6).
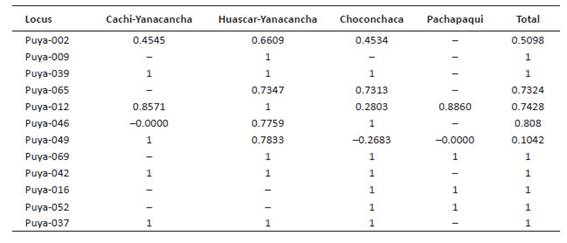
The results obtained from the inbreeding coefficient (FIS) showed positive and high values for each population in 10 loci; while for the populations of Yanacancha, Pachapaqui and the Choconchaca sector of the Lampa population, it showed a locus with a negative and low value, indicating an excess of heterozygotes. The total FIS shows a high value, indicating the possibility of inbreeding (Table 7).
Group assignment analysis. The assignment of groups was carried out first with a frequentist approach, in other words, frequencies were compared in order to determine the possible existence of population structure and to know which locality is genetically different from other sites in terms of allelic frequencies. A graph was generated, with the Genetix program, in multivariate space, where we can see the existence of two groups: the first group composed of the Cachi-Yanacancha sector, Huascar-Yanacancha and Pachapaqui; and the second group composed of the Choconchaca sector of the Lampa population (Fig. 2).
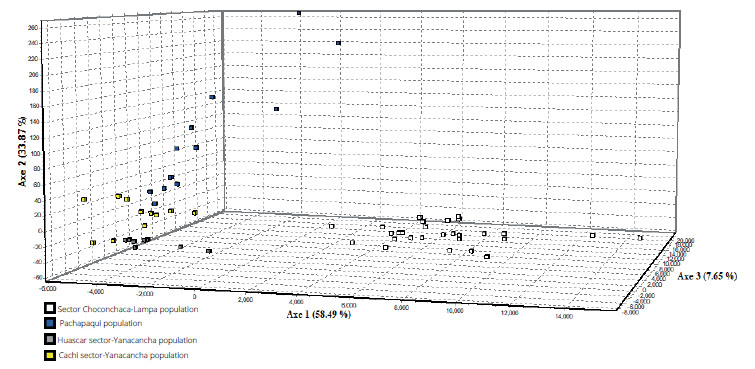
Figure 2 Group assignment in the multivariate space of the study populations of Puya raimondii. Squares correspond to: blue (Pachapaqui population), yellow (sector Cachi, Yanacancha population), gray (sector Huascar, Yanacancha population), white (sector Choconchaca, Lampa population).
Furthermore, it can be observed that there is some degree of genetic structuring. The calculation of FST was 0.4813, a very high value, where the null hypothesis considered was Ho: FST = 0, thus, according to our result, we rejected the null hypothesis that the four locations form a panmitic unit.
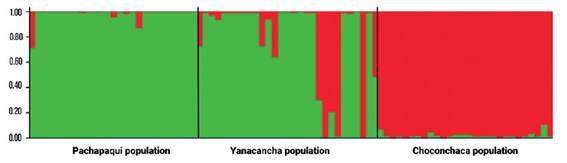
The second analysis of group assignment was carried out using Bayesian probabilities analyzed with the STRUCTURE program (Pritchard et al. 2000), which takes as criteria for grouping the maximization of HWE and minimization of linkage disequilibrium for all genotypes. For the analysis, we considered the number of assumed populations (K) to vary from 1 to 4, resulting in K=2, two genetic groups or two genetically differentiated populations. The first group or genetic population is made up of the sectors of Cachi and Huascar from the town of Yanacancha and the town of Pachapaqui, and the second differentiated genetic population is made up of the Choconchaca sector of the Lampa population (Fig. 3). Also, the second genetic population presented some mixed individuals, for the other K no logical groupings are shown.
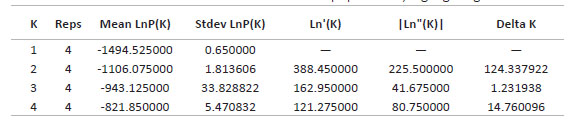
Finally, the analysis with STRUCTURE Harverster (Earl et al. 2012), an extension of the STRUCTURE program, turned out that the highest value for Delta K is equal to two, the other values show lower Delta K; that is, there is the probability that there are two genetic groups or two genetically differentiated populations (Table 8).
Discussion
The quality of DNA obtained from leaf fragments of Puya raimondii improves when very young (tender) leaves are used, otherwise the quality of DNA is not adequate as was the case of Rivadeneira (2016) who isolated DNA from seeds when working with Puya hamata. These results coincide with other genera in the family (Schulte et al. 2010). Porebski et al. (1997) suggested the interference in DNA extraction being by compounds that the plant produces to resist extreme environmental conditions or by the sexual maturity of the plant (Murray 1980).
Genetic diversity parameters. The allelic diversity of the Choconchaca sector, Lampa population, is the highest. This type of trend is observed in certain markers and can be due to the high rate of mutation of microsatellites (Oliveira et al. 2006), as well as the rare alleles (RA, with frequencies <0.05), which would be common in microsatellite studies (Hale et al. 2012). However, very rare alleles (AmR, with frequencies <0.01), usually provide almost no useful information in most population analyses, since their presence may be due merely to recurrent mutations and not to historical factors or gene flow. The hightest genetic diversity observed in the Choconchaca sector of the Lampa population could be attributed to low frequency burning of individuals, compared with what is observed in other populations, besides the protection provided by locals. Moreover, in the Choconchaca sector there is a higher density of hummingbirds (personal observations), that would favor pollination and outcrossing; and consequently, gene flow into the area.
In our study, the Cachi sector of the Yanacancha population presented 2 RA, the Huáscar sector of the Yanacancha population, 1 RA and 1 AmR, the Choconchaca sector of the Lampa population, 8 RA, and the Pachapaqui population 4 RA, having the Choconchaca sector of the Lampa population the greater number of RA. The presence of Rare alleles is mainly due to the high mutation rate of microsatellites, being responsible for the change in number, frequency and even emergence of new alleles (Oliveira et al. 2006), they can be useful in conservation programs (Acuña 2016). Here, RA will be characteristic of most of the exclusive alleles for the Cachi and Choconchaca sectors, as well as the Pachapaqui population. Although many of these exclusive alleles are not useful for population analyzes (He and FST).
Regarding the heterozygosity levels of the populations, the Ho ranged from 0 to 0.929; while the He varied from 0 to 0.723, being 0.051 the average Ho, a lower value compared to the average He of 0.217. In cases like this one, where the Ho is lower than the He, an excess of homozygous is suspected (Toro et al. 2011), due to inbreeding in the population; however, a closer analysis for each study population is important. We also found that the total heterozygosity was 0.217, a value that could not be compared with other populations of P. raimondii, since no other study using the same type of marker is available for the species. Studies in the genus Corybas showed ranges of observed and expected heterozygosity of 0-1 and 0-0.859 respectively (Etten et al. 2018) and for the species Psammosilene tunicoides, ranges of 0-1 were found for Ho and 0-0.615 for He (Zhang et al. 2018); as well as for Plagiorhegma dubium, where the He ranged from 0-0.594, 0-1 and 0-0.744 for the three populations under study (Kim et al. 2018).
Values of He obtained for P. raimondii in this work could be produced by crossbreeding systems that result in greater genetic variation than self-fertilization (Sosa et al. 2002), which would mean that P. raimondii has a combined pollination system by hummingbirds (Salinas et al. 2007) and self-pollination.
In addition, taking as a reference the values obtained from close relatives of P. raimondii used during the development of the SSR markers, the He values obtained were 0.4026, 0.4002 and 0.1905 for P. macrura, P. macropoda and P. hutchisonii respectively (Tumi et al. 2020); these values are not very far from those found in this study; therefore, it would be thought that the studied populations have moderate to high genetic diversity, but care needs to be taken in interpreting or generalizing the genetic diversity for all populations.
Analyzing the localities, we can observe differences from the average He: 0.153 in the Cachi sector, 0.318 in Huáscar sector, 0.344 in Choconchaca sector and 0.052 for the Pachapaqui population. According to these results, the Choconchaca sector of the Lampa population presents a greater genetic diversity than the other populations. We also found that the Huascar sector presents greater genetic diversity compared to with the Cachi sector, both beloging to the same population of Yanacancha. These differences of genetic diversity may be explained by the impacts on the ecosystem where the species thrives. As observed in the Pachapaqui population, P. raimondii individuals are impacted by anthropic factors; since a greater number of burned and cut individuals were observed, in addition to a road at one edge of the population.
The Choconchaca-sector of the Lampa population was very different, because it presented greater genetic diversity than the other populations, this is explained by the fact that part of the area with P. raimondii was private and protected, a place with low anthropic impact, where the local inhabitants have lived harmoniously with the plants for many years (according to the villagers' information). It is important to remark that P. raimondii coexist with a species of "queñua" (Polylepis sp.) (Fig. 1C), and a diverse local fauna, that includes birds, mammals, etc. (Miller et al. 1991; García-Meneses et al. 2012), all this allows us to point out that a very relevant aspect in the conservation of P. raimondii is not only conserving the species itself, but the entire ecosystem where it thrives.
The results obtained mostly agree, in terms of genetic variation, with the study by Hornung-Leoni et al. (2013) evaluating P. raimondii from the Huascaran National Park. They found high levels of polymorphism, using AFLP markers, highlighting the meaning of these results for the conservation of the area. Quite the opposite, the study by Sgorbati et al. (2004), reported monomorphic populations, with 98.3% genetic similarity. We can note that populations studied by Sgorbati et al. (2004) were representative from the distribution area of P. raimondii, however they were in unprotected areas with high human impact. Unlike Hournung-Leoni et al. (2013), who studied two nearby populations, one of them within a protected area. It should also be noted that both studies did not use specific markers for the species, which did not allow them to make a good genetic differentiation of the populations.
Results obtained in the present study can be explained by the specificity of the markers, and maybe also the fact that the individuals sampled corresponded to juveniles. In the study by Sgorbati et al. (2004) and Hornung-Leoni (2013) the size and age of individuals is not specified. Also, the Pachapaqui, Yanacancha and the Lampa-Choconchaca populations analyzed here were not included in those studies. It should be noted that the populations showing the greatest genetic variability were in natural areas protected by the state (Huascaran National Park, Hornung-Leoni et al. 2013) or private areas (Lampa population in the Choconchaca sector, this study).
The HWE test showed that most of the evaluated loci presented significant deviation, that is, they showed to be in H-W imbalance for this study population (P-value 0.05). This could mean that P. raimondii increases its heterozygosity as a response of adaptation to the extreme conditions of its habitat.
The Cachi sector presented 6 loci that were not in H-W equilibrium; in the same way, there were 10 loci in the Huascar sector, 9 loci in the Choconchaca sector of the Lampa population, and 4 loci for the Pachapaqui population. The Huascar sector and the Choconchaca sector of the Lampa population presented a greater number of loci that were not in H-W equilibrium, associated with the deficiency of heterozygotes that could be due to evolutionary forces, inbreeding and life history of the species, causing the break of the assumptions of the HWE. Furthermore, the heterozygosity results obtained correlate with those obtained with the HWE test, showing that the sectors of Choconchaca and Huascar have differences in terms of genetic variability; and that the Pachapaqui population shows a tendency to lose its genetic variability, due to the factors mentioned above, and because the levels of genetic variability in a population can be eroded when populations drastically decrease in size or are isolated from other populations, due to destruction and fragmentation of their habitat (López-Gallego 2015), as well as the lack of conservation measures.
Population structure analysis. AMOVA test showed high genetic differentiation among populations, with 65% differentiation; added to this are the values from FST (0.426) and RST (0.650). When analyzing the value of FST including all localities, a high genetic differentiation among the populations is shown, a result that support the presence of morphological differentiation (morphotypes) between populations in the north and south of the country (Vadillo 2011). These results could be produced by the considerable geographic separation among the localities. Other factor could be the pollinators of P. raimondii, mostly hummingbirds, however, they would be not specific, but there are records for the genus Puya as provider of nectar for hummingbirds and as a food source for the spectacled bear (Hornung-Leoni et al. 2013; Jabaily & Sytsma 2013). Hornung-Leoni et al. (2013a) and Salinas et al. (2007) studied P. raimondii pollinators and showed that the high Andean hummingbirds seem to play an important role as transporters of pollen. Understanding their behavior could inform us about genetic flow among P. raimondii populations, however, Salinas et al. (2007) points out the P. raimondii polen would be an impredecible resource in time. Another (less studied) aspect that could also influence gene flow is seed shape, although it is true that P. raimondii seeds are easily transported by wind, due to their winged shape, it is still unknown whether the wind direction and speed allows long-distance dispersion among localities.
On the other hand, the RST analysis shows high values, which would be interpreted as panmixia and a high genetic differentiation among localities. This statistic (RST) is used to reinforce or refute the value of the FST , due to its ability to reject the high and complex mutation rate that characterizes microsatellites and therefore avoid overestimating the degree of genetic differentiation by homoplasia (Balloux & Lugon 2002, Estoup et al. 2002, Hardy et al. 2003). Our results coincide with the study carried out in Bromelia antiacantha, a polyploid species, where a high inbreeding coefficient was reported (FIS = 0.431), indicating excess of homozygotes and a high level of genetic differentiation (FST = 0.224). A high genetic structure could also be related with populations with different morphotypes, aspects that should be considered for conservation issues (Zanella et al. 2011).
The genetic structuring analysis with a frequentist approach resulted from comparing the allelic frequencies, where two genetically different groups were determined in a multivariate space, the first group corresponds to the Yanacancha populations (Cachi sector and Huáscar sector) and the Pachapaqui population, and the second group corresponds to the Choconchaca sector of the Lampa population. With this analysis, we were able to find population genetic structuring. Reinforcing this is the value of FST (0.4813), where the idea that the localities were taken from a panmictic unit and that there is genetic differentiation among localities is rejected. In addition, the AMOVA analysis performed among groups, resulted in a moderate variation (19.02%), while the percent of variation within localities among the groups resulted in a higher value (31.48%) that coincides with the P-value (0.00000), significant to FSC. However, the P-value of the FCT (0.25513) was not significant, indicating that there is no differentiation between groups 1 and 2. It may be because when analyzing which population is genetically different in terms of allele frequencies with respect to the other populations, many a more extensive sampling would be needed; however, the multivariate graph shows us that there is some degree of genetic structuring. Another important consideration is the life history of the species, P. raimondii that according to evolution is explained under two models, the reproductive effort model and the demographic model, the first model compares the number of pollinators and the number of flowers in terms of reward and investment; the second model explains, according to the habitat, where the climates are harsh and future reproduction is less likely (Jabaily & Sytsma, 2013).
Finally, another analysis was performed to complement the genetic structuring among populations, with the STRUCTURE program (Pritchard et al. 2000, 2010). The clusters (K) ranged from 1 to 4; but the value of K = 2 showed greater agreement; therefore, the existence of two genetic groups or populations (center and southern Peru). This seems to agree with results obtained by Vadillo et al. (2007) when analyzing the morphological variation in 14 populations. They found differences between the populations of the north and center, and the populations in the south (Yauri, Capaya, Totora and Putina), for example, they found significant morphological variability in the number of spines, percent of spines facing outward and percent of leaf apexes without spine.
The structure found in the study could be explained by the geographical distance that separates each of the populations. Also, characteristics of individuals and their habitats are important factors related to the genetic differentiation among populations. Our results coincide with a study on three natural populations of Pitcairnia flammea (Bromeliaceae) using ISSR markers. Here, Domingues et al. (2011) found the existence of two genetic groups (K = 2) with a moderate genetic differentiation of 0.0974 between the populations. These values could be used to establish a better strategy in conservation programs.
Furthermore, the Evanno method corroborated the probability values obtained in the structuring test, the value of K = 2 being the ideal number of populations, where the Choconchaca sector of the Lampa population was shown to be genetically different from the Yanacancha population (Cachi sector and Huascar sector) and the Pachapaqui population. These results have a scientific basis for the conservation of the different populations of P. raimondii, including their habitats.
It is urgent to take conservation actions on the southern P. raimondii populations, like those realized in Ayacucho, with the creation of the Titankayocc Regional Conservation Area, which includes scientific research, and education and awareness involving the community (Rozzi, 2011). The information generated here will contribute to the development of conservation plans for P. raimondii in Peru, since according to the IUCN report in 2009, the species is threatened. Now, with the advancement of genetics and the use of specific molecular markers for the species, it is possible to generate more up-to-date information considering the wide distribution of the species in Peru, and thus involve not only the scientific community, but the regional leaders in each locality. Therefore, the results found in the present study serve as a base and incentive to continue with the studies of P. raimondii at the molecular level. There is a need to increase sampling including all populations to establish future conservation areas that hold the greatest genetic diversity, particularly in the southern populations, either at a private or regional level, and that are registered by the Servicio Nacional de Áreas Naturales Protegidas por el Estado (SERNANP).
Conclusions
The Puya raimondii populations presented a moderate to high genetic diversity. The Choconchaca-sector of the Lampa population (Puno) was the one with the highest genetic diversity, unlike the Pachapaqui population (Ancash), which shows a tendency to lose its genetic variability.
The populations studied show a high genetic structure, revealing two genetically distinct groups: the first group corresponds to the Yanacancha populations (Cachi and Huascar sectors) and the Pachapaqui population, from north and central Peru respectively; the second group corresponds to the Choconchaca sector of the Lampa population (Puno), the south of Peru. These results are coherent with the existence and distribution of the two morphotypes previously reported.
The genetic diversity and genetic structure found in the Choconchaca sector, of the Lampa population, were the highest in this study and provides information to establish conservation strategies for the species. Our results promote the creation of an additional conservation area for the southern populations, thus protecting the genetic diversity and genetic distinctiveness of P. raimondii present in this area.

