


 English (pdf)
 Article in xml format
 Article references
 Send this article by e-mail
 Cited by SciELO
  Similars in
SciELO
Similars in
SciELO 
 Permalink
Introduction
For people who suffer from emotional disorders, dwelling on the ‘quicksand of thought’ is an all-toocommon experience. Indeed, researchers have long acknowledged the fact that repetitive negative thinking (RNT) is a core feature of human emotional suffering (Ehring & Watkins, 2008; Harvey et al., 2004). RNT is characterised by the predominance of verbal processing (as opposed to imagery), negative affective valence, and abstractness (as opposed to concreteness) (Ehring & Watkins, 2008; Watkins, 2008). This thinking style hence promotes and prolongs states of discomfort, while also impairing problem-solving and interpersonal relations (Erickson et al., 2020).
Traditionally, RNT has been studied as different, diagnosis-specific constructs (Erickson et al., 2020). For example, in relation to depressive disorders, RNT has been mostly studied as rumination, which is characterised by thinking repetitively and passively about the symptoms of distress, as well as the possible causes and consequences of such symptoms (Nolen-Hoeksema et al., 2008). Rumination, as conceptualised in such a way, is usually measured using the Ruminative Response Scale (RRS), which consists of two subscales: brooding and reflection, the latter arguably being a more adaptive form of rumination (Treynor et al., 2003). Similarly, RNT in the context of generalised anxiety disorder has frequently been studied as worry, which is defined as ‘an issue whose outcome is uncertain but contains the possibility of one or more negative outcomes’ (Borkovec et al., 1983, p. 10). In the same vein as rumination, most research on worry has been conducted using a specific measure: the Penn State Worry Questionnaire (PSWQ; Meyer et al., 1990).
Despite the extensive evidence of RNT in specific diagnoses, researchers have begun to argue for a broader, transdiagnostic approach to RNT (Ehring et al., 2011; Ehring & Watkins, 2008). It has been shown, for example, that the RRS and the PSWQ largely overlap, and their items show better fit when modelled as part of a global RNT factor in addition to the specific rumination and worry factors (Hur et al., 2016; Topper et al., 2014). Moreover, this global factor shows robust associations with various forms of depression and anxiety (Arditte et al., 2016; Hur et al., 2016; McEvoy & Brans, 2013; Spinhoven et al., 2015; Topper et al., 2014). Some studies have found that the specific factors (i.e., rumination and worry controlling for global RNT) also predict depression and anxiety: Rumination is more associated with depression (Arditte et al., 2016; McEvoy & Brans, 2013; Spinhoven et al., 2015), and worry with anxiety (Hur et al., 2016; Spinhoven et al., 2015). However, these specific factors do not predict depressive symptoms when studied longitudinally (Topper et al., 2014). From a slightly different perspective, it has also been shown that RNT accounts for the overlap between depression and anxiety, both at the symptom (McLaughlin & Nolen-Hoeksema, 2011) and at the diagnosis level (Drost et al., 2014). This suggests that one possible reason why many psychological disorders overlap is their sharing of RNT as a common process.
RNT has also been studied in different populations, one of them being university students. There is increasing interest in identifying mental health predictors in this population (Auerbach et al., 2018; Duffy et al., 2019). RNT, studied as worry, predicts anxiety, depression and insomnia in students (Zvolensky et al., 2019). It is also considered as a significant mediator of the relationship between exposure to stressors and emotional distress (Bauer et al., 2020). Furthermore, when studied as rumination, RNT mediates the relationship between cyberbullying victimisation and depression (Liu et al., 2020). It can be appreciated, then, that RNT is an important variable for contemporary research on students’ mental health.
One important aspect related to the transdiagnostic approach to psychopathology is that of discriminant validity. That is, it is important to test whether RNT is distinguishable from other psychological variables. If RNT has very strong correlations with these variables (say, around .90 or higher), it could be that they are all part of a broader, overarching construct (Hong & Cheung, 2015; Mansell & McEvoy, 2017). A relevant construct for testing discriminant validity of RNT measures is cognitive fusion. It is defined as the tendency to engage in thoughts as if they were actual (direct, contingent) stimuli, so that behaviour ends up being governed by such verbal rules (Blackledge, 2015; Hayes et al., 2012). Theoretically, RNT and cognitive fusion are related yet distinct constructs, because somebody’s engaging in RNT implies that their overt behaviour is being inflexibly affected by their verbal behaviour (Ruiz et al., 2016). Thus, we should expect a moderate to strong correlation between these constructs, but no so high that they become indistinguishable.
Due to the importance of RNT research, there is a need to go beyond diagnosis-specific measures (e.g., RRS, PSWQ), and consider others that conceptualise RNT as a whole. Based on the existing evidence, Ehring et al., (2011) developed a measure that encompassed the common features rather than the differences between RNT types. They defined RNT as
a style of thinking about one’s problems (current, past, or future) or negative experiences (past or anticipated) that shows three key characteristics: (1a) the thinking is repetitive, (1b) it is at least partly intrusive, and (1c) it is difficult to disengage from. Two additional features of RNT are that (2) individuals perceive it as unproductive and (3) it captures mental capacity. (Ehring et al., 2011, p. 226)
Thus, the Perseverative Thinking Questionnaire (PTQ) contained items that covered the full scope of this definition. The original validation study showed that the best factor structure of the PTQ was that of a second-order RNT factor and three first-order factors corresponding to the three features described before: (1) Core RNT Features, (2) Perceived Unproductiveness of RNT, and (3) RNT Capturing Mental Capacity (CFI = .950 - .980, RMSEA = .038 - .057; Ehring et al., 2011). This second-order structure was also replicated in Dutch-speaking undergraduates (Ehring et al., 2012), British patients with persecutory delusions (Cernis et al., 2016), Turkish non-clinical adults (Altan-Atalay & Saritas- Atalar, 2018), and Iranian clinical and non-clinical samples (Kami et al., 2019).
It should be noted that the structure proposed by Ehring et al. (2011) was developed theoretically, not with empirical (i.e., exploratory) methods. Therefore, it is still possible that less factors are needed to explain the inter-item correlations. Take, for example, the results of Kornacka et al. (2016). Although they extracted three factors that approximately resembled the original PTQ factors, the fact that only two eigenvalues were larger than one suggests that less than three factors are needed for the sake of parsimony. Indeed, using data from a Portuguese student sample, Chaves et al. (2013) extracted only two components in their study: (1) Repetitive Thought, and (2) Cognitive Interference and Unproductiveness. This two-dimensional structure was later replicated with acceptable fit in both student and community samples (CFIstudent = .958, RMSEAstudent = .075, CFIcommunity = .955, RMSEAcommunity = .072; Azevedo et al., 2017).
In spite of the evidence that supports a multidimensional structure for the PTQ (be it with two or three lower-order factors), some additional data suggest that this measure is essentially unidimensional. That is, only the general RNT factor seems to be important and interpretable. For instance, the sum scores of the two components identified by Chaves et al. (2013) had a large correlation (rs = .67), suggesting that there is one general factor which underlies both dimensions. Moreover, when the strictly unidimensional model was tested in some studies, its fit was only marginally unacceptable (CFI = .920 - .960, RMSEA = .061 - .130; Altan-Atalay & Saritas-Atalar, 2018; Ehring et al., 2011). It is possible that the additional factors needed to achieve acceptable fit are of residual nature, and therefore non-substantial. Models that are composed of one general factor and several group factors are called bifactor models, and they have become widespread in recent years (Reise, 2012; Reise et al., 2010). To the best of my knowledge, only one study has applied bifactor modelling to the PTQ, which showed that, as hypothesised, this questionnaire is essentially unidimensional (Devynck et al., 2017). However, one limitation of this study is that the PTQ was shortened before being analysed with bifactor modelling. For this reason, Devynck et al. (2017) results cannot be directly extrapolated to the full PTQ.
The aim of the present study was to assess three competing models of the PTQ’s factor structure. First, I tested a bifactor model with one general RNT and three specific factors based on the original structure proposed by Ehring et al. (2011). The second model tested was also a bifactor model, but with only two specific factors as suggested by Chaves et al. (2013). For completion, a strictly unidimensional model was also tested. In case none of these models achieved acceptable fit, theoretically coherent respecifications based on modification indices would be added in an exploratory way. Finally, in order to examine associative validity, the latent correlation between the final RNT factor and a cognitive fusion latent variable was assessed. From a methodological point of view, this study’s novel approach to unidimensionality should help better understand the factor structure of the PTQ. Also, from a practical perspective, this should set the path for more sophisticated studies that, in the long run, will provide researchers and practitioners with better measures of global RNT.
Method
Participants
The sample comprised 240 psychology students (59% female) from one large public university in Lima, Peru. Ages ranged from 17 to 29 (M = 20.33, SD = 1.85). Thirty-one students (13%) came from San Juan de Lurigancho, the most populated district in Lima City. Two hundred and eleven people (89%) said that they had lived in this city for the greater part of their lives. Most participants were second (43%) or third (53%) year students. Even though this was a convenience sample whose size was not determined a priori, it was larger than the minimum sample size of 200 suggested by some popular rules of thumb (Kline, 2016).
Measures
Perseverative Thinking Questionnaire (PTQ; Ehring et al., 2011). As already mentioned, the PTQ was created as a disorder-independent measure of RNT. It comprises 15 items; however, items 2 (Thoughts intrude into my mind) and 12 (Thoughts just pop up into my mind) had almost identical phrasings when translated into Spanish. For this reason, I decided to exclude item 2 from this study, even though the original numeration was maintained to facilitate comparison. Each item is answered using a 5-point Likert scale, which ranges from 0 (never) to 4 (almost always). An existing Spanish version was used, which was developed in Colombia (F. J. Ruiz, personal communication, October 16, 2017). Since the wording of this translation was very clear and comparable to the Spanish spoken in Peru, no modification was made to the items. Details about the psychometric properties of the PTQ are presented throughout this article.
Cognitive Fusion Questionnaire (CFQ; Gillanders et al., 2014). This questionnaire was constructed as a unidimensional measure of cognitive fusion. It consists of seven items that are measured on a 7-point Likert scale (1 = never true, 7 = always true). There are no reversed items, so that all of them are averaged in order to get a total score. An existing Spanish version (Ruiz et al., 2017), which had been previously tested in Peruvian undergraduates (Valencia & Falcón, 2019), was used in this study. Reliability was high in the present data (ω = .922).
Procedure
Participants were approached collectively in their classrooms. They were given a questionnaire booklet, at the start of which an informed consent note was included. Both orally and in written form, it was stated that their participation was voluntary and anonymous, and that there would be no negative consequences in case they decided not to participate. After they finished, the booklets were collected, and participants were thanked for their time. No financial or academic reward was delivered.
Data analysis
Data were analysed in R 4.0.3 using the following packages: psych 2.0.8 (Revelle, 2020), lavaan .6-7 (Rosseel, 2012), semTools .5-3 (Jorgensen et al., 2020), semPlot 1.1.2 (Epskamp, 2019), and boot 1.3- 25 (Canty & Ripley, 2020). The operating system of the computer used for the analyses was Ubuntu 18.04.5 LTS 64-bit.
All items were treated as continuous variables even when, strictly speaking, they are categorical. This is justified by the fact that the PTQ’s items have five response options, which is the minimum number suggested for treating a categorical variable as continuous (Rhemtulla et al., 2012). Moreover, as will be shown in the Results section, all items had low skewness and kurtosis (< 1 in absolute values). This supports the decision to analyse them as continuous variables using linear factor analysis (Ferrando & Anguiano-Carrasco, 2010).
The first step of the analysis was to examine the descriptive statistics of each item. Specifically, the mean, standard deviation, skewness, and kurtosis were calculated. Also, since a global RNT dimension is hypothesised, the corrected item-total correlations were also computed. Next, the factor structure of the PTQ was examined via confirmatory factor analysis (CFA). The three competing models (bifactor with three specific factors, bifactor with two specific factors, and strictly unidimensional) were compared to one another. Since multivariate normality cannot be expected from Likert variables, a robust modification of the maximum likelihood estimator (MLR; Yuan & Bentler, 2000) was used for the CFA.
Apart from the χ² statistic, which is usually considered overly conservative (Byrne, 2012), two approximate fit indices were used to evaluate the model (criteria for good fit are presented in brackets): The comparative fit index (CFI > .95), and the root mean square error of approximation (RMSEA < .06; Hu & Bentler, 1999). In both cases, special formulae were used to account for the fact that they were based on a modified, robust estimator (Brosseau- Liard et al., 2012; Brosseau-Liard & Savalei, 2014). Since none of the three models was able to achieve good fit, modification indices (MI) were examined to alter the model in an exploratory way. Each modified model was compared to the previous one (Δχ²) using Satorra and Bentler’s (2001) method.
Even though internal consistency reliability has traditionally been estimated using coefficient alpha, several critics have pointed out the limitations of this approach (McNeish, 2018; Viladrich et al., 2017; Yang & Green, 2011). Instead, model-based coefficients (most prominently, coefficient omega; Dunn et al., 2014) have been proposed, which can be estimated from the results of a CFA (Savalei & Reise, 2019; Viladrich et al., 2017). Importantly, a correction is routinely applied to coefficient omega whenever there are correlated errors in the CFA model (McNeish, 2018; Viladrich et al., 2017). In this study, I calculated both a point-estimate of coefficient omega, and 95% bias-corrected and accelerated confidence intervals (BCa CI). Since correlated errors were included, the reliability coefficient was corrected accordingly.
Next, evidence of associative validity was sought. Starting from the final CFA model of the PTQ, I added a cognitive fusion latent variable measured by the CFQ’s indicators and allowed it to correlate with the RNT latent variable. Model fit was assessed as before, and the correlation between both latent variables (RNT and cognitive fusion) was examined.
Two additional procedures were performed to further analyse discriminant validity. First, I calculated the average variance extracted (AVE) of both the PTQ and the CFQ and compared these values with the squared factor correlation. Each AVE had to be larger than the squared factor correlation to assume discriminant validity (Hair et al., 2019). The second procedure I did consisted of a bifactor model with one general factor (comprising all items) and two specific factors (corresponding to the PTQ and the CFQ). The strength of the general factor was evaluated using the explained common variance (ECV) index. It has been suggested that values larger than .60 (Reise et al., 2013), .70 or .80 (Rodriguez et al., 2016 b) are evidence of essential unidimensionality. Finally, the three factors were evaluated estimating their construct reliability (H) and factor determinacy (FD). Only factors with H > .70 ((Rodriguez et al., 2016a) or FD > .90 (Brown, 2015; Grice, 2001) are considered important enough to be included in a structural equation model. If the ECV was large, and the specific factors’ H and FD were small, then discriminant validity could not be supported.
Results
Descriptive statistics
Table 1 presents the descriptive statistics of the items. Taking into consideration the fact that the minimum and maximum scores of each item are 0 and 4, respectively, it can be noticed that all items’ means are around the theoretical central value (i.e., 2). Also, all items have similar standard deviations, as well as low skewness and kurtosis values. Table 1 also presents the corrected item-total correlations, all of which are higher than .60.
Table 1 Descriptive statistics of the items of the Perseverative Thinking Questionnaire
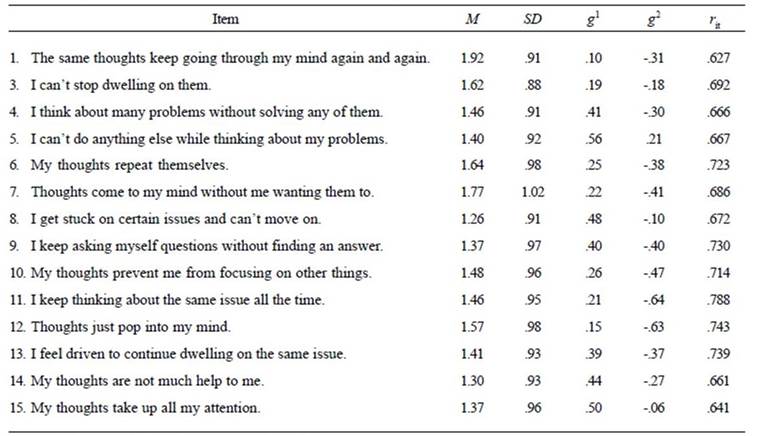
Note: g1 = skewness, g2 = kurtosis, rit = item-total correlation.
Factor structure
I intended to test the first bifactor model (i.e., one RNT factor and the three specific factors). However, this model presented an improper solution (negative estimated variances). Similarly, the second bifactor model (i.e., one RNT factor and two specific factors) did not converge and, consequently, it was not possible to assess its fit. Given these problems, I focused on the strictly unidimensional model and modified it in an exploratory way.
The strictly unidimensional model showed mediocre fit: MLRχ²(77) = 273.55, p < .001.; Robust CFI = .892; Robust RMSEA = .109. Thus, I explored the MI and concluded that adding the correlation between the errors of items 7 (Thoughts come to my mind without me wanting them to) and 12 (Thoughts just pop into my mind) was theoretically defensible. After adding this correlation, the fit of the model improved significantly: MLRχ²(76) = 215.67, p < .001; Robust CFI = .923; Robust RMSEA = .092; Δχ²(1) = 50.01, p < .001.
Next, I examined the MI again and decided to add yet another correlation between errors—those of items 1 (The same thoughts keep going through my mind again and again) and 3 (I can’t stop dwelling on them). This is justified by the fact that item 3 refers to item 1; therefore, these items become functionally dependent. The new model thus derived again had significantly better fit: MLRχ²(75) = 196.49, p < .001; Robust CFI = .934; Robust RMSEA = .086; Δχ²(1) = 14.12, p < .001.
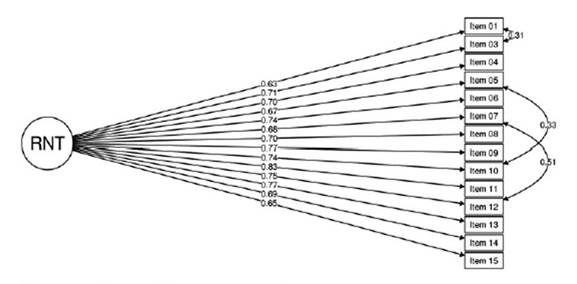
Even though the previous modification improved model fit to an important degree, examination of the MI suggested that there was still room for improvement. Specifically, I added the correlation between the errors of items 5 (I can’t do anything else while thinking about my problems) and 10 (My thoughts prevent me from focusing on other things). This decision made sense because both items contained words related to not being able to do things because of RNT. After this modification, model fit again showed a significant improvement: MLRχ²(74) = 175.92, p < .001; Robust CFI = .945; Robust RMSEA = .079; Δχ²(1) = 14.30, p < .001. No further modifications could be theoretically supported; therefore, the final model is the one presented in Figure 1.
Reliability estimation
Model-based internal consistency reliability was first estimated for the full 14-item PTQ. This model, which was depicted in Figure 1, presents correlated errors; thus, the formula of coefficient omega was corrected accordingly. Using this modified formula, reliability was very high for the PTQ: ω = .927, 95% BCa CI (.909, .941).
Evidence of associative validity
In order to examine associative validity, I extended the model presented in Figure 1 to include a cognitive fusion factor using the CFQ’s items as indicators. This extended model had acceptable fit: MLRχ²(185) = 311.37, p < .001; Robust CFI = .958; Robust RMSEA = .056. Of special interest was the correlation between both latent variables (RNT and cognitive fusion), which was very large: ϕ = .876.
Further examination of discriminant validity
Given the large factor correlation, further inquiry into the PTQ’s discriminant validity was needed. The AVEs of the PTQ and the CFQ’s latent variables were .518 and .628, respectively. Both values were smaller than the squared factor correlation ϕ² = .876² = .767. Thus, there was not sufficient evidence of discriminant validity.
Similarly, when a bifactor model was examined, evidence for essential unidimensionality was found (ECV = .865). Moreover, construct reliability and factor determinacy were low for specific factors (HPTQ = .387, FDPTQ = .752, HCFQ = .571, FDCFQ = .825) but high for the general factor (H = .957, FD = .975).
Discussion
This study examined the factor structure of the PTQ, a general measure of RNT. None of the three hypothesised models showed good fit, either because they did not converge, presented impossible values, or because the fit itself was mediocre. However when the strictly unidimensional model was modified in an exploratory way, marginally acceptable fit was achieved after adding three correlations between errors. Moreover, the PTQ had a large latent correlation with cognitive fusion.
The fact that none of the two bifactor models achieved realistic solutions suggests two possible explanations. First, it could be that the sample size was not large enough for such complex models (Morgan et al., 2015). Second, it could also be that they were indeed wrong models, so it was impossible for the implied covariance matrix not to show unrealistic values (e.g., negative variances) (Chen et al., 2001). In any case, essential unidimensionality could not be tested through bifactor models. Therefore, I turned to the strictly unidimensional model and made modifications upon it. Specifically, I added error correlations, which is akin to modelling residual factors in a bifactor approach (Rodriguez et al., 2016 a). The three error correlations added to the model were all theoretically justified.
One possible implication of the results is that, although the original lower-order (here treated as residual) factors do not hold in this sample, the global RNT factor is still predominant, just as was proposed by the PTQ’s creators (Ehring et al., 2011). Furthermore, this aligns well with the fact that, even when different factors are extracted, the large overlap between them hints at the existence of a general RNT factor (e.g., Chaves et al., 2013). Similarly, the only existing study that applied bifactor modelling to the PTQ showed that this measure is essentially unidimensional (Devynck et al., 2017). From a conceptual perspective, this implies that RNT may be best understood as a single latent variable, which goes beyond intricate distinctions between constructs such as brooding, reflection, and worry (Ehring & Watkins, 2008). In practical terms, this means that, when modelling a latent variable or computing a composite score of the PTQ, it makes more sense to focus on global RNT rather than on any specific ‘component’.
Acknowledging the fact that the PTQ is essentially unidimensional allows for further refinement. For instance, it is possible to select the items that have larger loadings on the global RNT factor and use them to create a short version of the PTQ that is clearly (strictly) unidimensional. Using shorter scales has not only the advantage of reduced administration time but also helps to define more clearly the variable being measured (Hayduk & Littvay, 2012). However, this was not done in this study due to the limited sample size, which would not have allowed cross-validation of the brief version.
One result that warrants attention is the large correlation between the PTQ (which, admittedly, measures RNT) and the CFQ (a cognitive fusion measure). Even though a large correlation was expected, the one observed (> .85) does seem to pose a threat to the discriminant validity of the PTQ. It is possible, then, that the PTQ and the CFQ are both measuring a broader construct that goes beyond the specific variables for which they were developed (Hong & Cheung, 2015; Mansell & McEvoy, 2017). This is also supported by the fact that both factors’ AVEs were lower than the squared correlation, a finding that indicates lack of discriminant validity (Hair et al., 2019). Moreover, when both latent variables were included in a bifactor model, it was observed that a global factor was the only construct of practical importance. Future studies should examine the conceptual limits of this overarching construct, being personality factors like neuroticism plausible focus for analysis (Barlow et al., 2014; Kotov et al., 2010).
This study has several limitations. First, even though RNT is a relevant variable associated to students’ well-being (Bauer et al., 2020; Liu et al., 2020; Zvolensky et al., 2019), the fact that this study did not address a more diverse sample limits the generalisability of the results. In fact, all the data collected came from psychology undergraduates only, which can lead to biased inferences if the PTQ is to be used with students from other academic fields. Second, even though the sample size was ‘large enough’ according to popular rules o thumb (Kline, 2016), it should be larger in future studies in order to obtain more stable estimates. Moreover, a larger sample size would allow tests of measurement invariance (e.g., with regard to gender), which were not possible in this study due to the limited sample size. Third, evidence of associative validity was limited to the CFQ. Future studies that examine the psychometric properties of the PTQ in Peruvian population should consider including well-known measures of disorder-specific RNT (i.e., the RRS for rumination, and the PSWQ for worry). Fourth, I want to emphasise the fact that these results are exploratory, since I did not include a confirmation sample. The final model was based on the data, not on a priori hypotheses. Thus, it is necessary that these results be replicated before use of the PTQ can be recommended.
These limitations notwithstanding, this study has some potential practical implications. First, it is expected that the PTQ will eventually help practitioners monitor changes in psychological interventions focused on RNT (e.g., Ruiz et al., 2018). Second, the PTQ should also help researchers study a global RNT construct, rather than disorder-specific constructs such as rumination and worry. This aligns well with the transdiagnostic approach to psychopathology, which seeks to identify etiological or maintaining variables that are common across disorders (Dalgleish et al., 2020).
This study has several limitations. First, even though RNT is a relevant variable associated to students’ well-being (Bauer et al., 2020; Liu et al., 2020; Zvolensky et al., 2019), the fact that this study did not address a more diverse sample limits the generalisability of the results. In fact, all the data collected came from psychology undergraduates only, which can lead to biased inferences if the PTQ is to be used with students from other academic fields. Second, even though the sample size was ‘large enough’ according to popular rules o thumb (Kline, 2016), it should be larger in future studies in order to obtain more stable estimates. Moreover, a larger sample size would allow tests of measurement invariance (e.g., with regard to gender), which were not possible in this study due to the limited sample size. Third, evidence of associative validity was limited to the CFQ. Future studies that examine the psychometric properties of the PTQ in Peruvian population should consider including well-known measures of disorder-specific RNT (i.e., the RRS for rumination, and the PSWQ for worry). Fourth, I want to emphasise the fact that these results are exploratory, since I did not include a confirmation sample. The final model was based on the data, not on a priori hypotheses. Thus, it is necessary that these results be replicated before use of the PTQ can be recommended. These limitations notwithstanding, this study has some potential practical implications. First, it is expected that the PTQ will eventually help practitioners monitor changes in psychological interventions focused on RNT (e.g., Ruiz et al., 2018). Second, the PTQ should also help researchers study a global RNT construct, rather than disorder-specific constructs such as rumination and worry. This aligns well with the transdiagnostic approach to psychopathology, which seeks to identify etiological or maintaining variables that are common across disorders (Dalgleish et al., 2020). In conclusion, these results suggest that the PTQ in essentially unidimensional, so that only a global RNT score is justified. The large correlation between the PTQ and the CFQ may point to problems regarding discriminant validity. Consequently, future studies should examine in greater detail what inferences can be made based on the PTQ (i.e., can we really interpret the PTQ’s scores as being RNT measures?)
Conflict of interest
The author declares that there are no existing or potential conflicts of interest that could affect the present study.
Ethical responsibility
This non-experimental study was conducted on a sample of human subjects. It was explained to the that the data would be used for research on ‘human emotions and thoughts’, as well as for the improvement of psychological tests. Participants read an informed consent form before answering the questionnaires. All the data were collected anonymously and voluntarily.

