


Servicios Personalizados
Revista

Articulo
 Inglés (pdf)
 Articulo en XML
 Referencias del artículo
 Enviar articulo por email
Indicadores
-
 Citado por SciELO
Links relacionados
-
 Similares en
SciELO
Similares en
SciELO
Compartir

 Permalink
Revista de la Sociedad Química del Perú
versión impresa ISSN 1810-634X
Rev. Soc. Quím. Perú v.76 n.4 Lima oct./dic. 2010
TRABAJOS ORIGINALES
Use of basic Methylene Blue Dye for specific surface area measurement of metal hexacyanoferrate(II) complexes
Brij Bhushan Tewari1* and Clint Ostwald Thornton1
1 Department of Chemistry, Faculty of Natural Sciences, University of Guyana, P.O. Box 101110, Georgetown, Guyana, S. America
ABSTRACT
A method of measuring the external specific surface area of bismuth, lead and manganese ferrocyanides is described. Basic methylene blue dye in a range of concentration in dilute aqueous solution is applied at room temperature and adsorption isotherms are determined by spectrophotometric analysis of solutions. The percentage uptake of dye was found to be maximum and minimum for manganese and lead ferrocyanides, respectively. The mode of adsorption is indicated by the type of isotherms. Methylene blue dye adsorption on these metal ferrocyanides follows Langmuir adsorption isotherm. Methylene blue appears to be adsorbed flatwise from water with an effective surface area of 130Ǻ2. The specific surface area (SSA) has been calculated. The SSA was found to be 86.67, 115.69 and 144.45 m2 g-1 for bismuth, lead and manganese ferrocyanides, respectively.
Key words: methylene blue dye; adsorption; metal ferrocyanides; Langmuir constants; specific surface area.
INTRODUCTION
The measurement of SSA of finally divided solids is becoming of increasing importance in many branches of technology and in the laboratory. Solute adsorption however offers several advantages over vapour phase adsorption for the determination of specific surface area of solids. Insoluble double metal ferrocyanides of general formula M2[Fe(CN)6]· xH2O where M could be Zn2+, Cu2+, Bi2+, Pb2+, Mn2+ etc. are very important class of inorganic compounds. These metal ferrocyanides have long been known to act as adsorbents1-3 and ion-exchangers4-6. Due to their various applications, it become vital importance to have an determination of specific surface area of such compounds. Dye adsorption, has been used as substitute for BET measurement for determining the total surface of such compounds7,8.
A search of literature indicated that some reports are available on determination of specific surface area of various solids by dyes9-12 and substituted phenols13,14 adsorption, but no report available on determination of SSA of bismuth, lead and manganese ferrocyanides by methylene blue dye adsorption. In view of this attempt has been made to determine the specific surface area of these metal ferrocyanides. In addition, present paper describes an basic methylene blue dye adsorption method for the determination of specific surface area of bismuth, lead and manganese ferrocyanides.
EXPERIMENTAL SECTION
Chemicals
All chemicals used were of analytical-reagent grade. Potassium ferrocyanides K4Fe(CN)6·3H20, bismuth(III) nitrate Bi(NO3)3·5H2O, lead(II) nitrate Pb(NO3)2, manganese(II) chloride MnCl2 ·4H2O were obtained from BDH, Poole, UK. Methylene blue dye was obtained from E. Merck, Darmstadt, Germany. All chemicals used without further purification. Solutions were prepared in doubly distilled water.
Synthesis and characterization of metal ferrocyanides
Synthesis of metal ferrocyanides were carried out similar to the methods reported in chemical literature15,16. Bismuth, lead and manganese ferrocyanides were prepared by adding potassium ferrocyanide (167 ml; 0.1 M) solution slowly to each bismuth(III) nitrate, lead(II) nitrate and manganese(II) chloride (500 ml; 0.1 M) solutions with constant stirring. Reaction mixture was heated on water bath for 2-3 hours and then cured for 24 hours. The precipitates were filtered washed with distilled water and dried in an air oven at 60 ºC. The dried product was ground and sieved to 125 µm mesh size.
Bismuth, lead and manganese ferrocyanides were characterized on the basis of elemental analysis and spectral studies. Bismuth, lead, manganese and iron were estimated by atomic absorption spectrophotometry on IL-751 spectrophotometer. Carbon, hydrogen and nitrogen analysis was performed on CEST – 118, CHN analyzer. The analytical data for all three compounds are as follows: bismuth compound [Found (%): C - 10.80, H – 0.90, N – 12.75, Bi – 60.61, Fe – 8.50. C6H6N6O3Bi2Fe1. Calculated (%): C – 10.87, H – 0.83, N – 12.97, Bi – 59.79, Fe 9.10. Yield – 100.00 %], lead compound [Found (%): C – 9.80, H – 1.27, N – 12.32, Pb – 58.02, Fe – 7.80. C6H9N6O5Pb2Fe1. Calculated (%): C – 9.15, H – 1.30, N – 12.60, Pb – 60.18, Fe – 7.48. Yield – 98.50 %], manganese compound [Found (%): C – 16.30, H – 2.80, N – 18.60, Mn – 26.90, Fe 13.12. C6H12N6O6Mn2Fe1. Calculated (%): C – 15.90, H – 2.88, N – 19.29, Mn – 28.70, Fe – 14.25. Yield – 96.70 %].
Infrared spectra of compounds, M2 [Fe(CN) 6] · xH 2O [where M = Bi, x = 6; M = Pb, x = 5; M = Mn, x = 3] were recorded in KBr disc on Beckmann IR-20 spectrophotometer. A broad band at around 3700 cm-1 in all three metal ferrocyanides is due to interstitial water molecules and OH groups, while the characteristic HOH bending appears at around 1600 cm-1 in all complexes. Two sharp bands at around 2080 cm-1 and 580 cm-1 are characteristics of cyanide and Fe-C stretching respectively. Another sharp band at around 490 cm-1 in all three metal ferrocyanides probable shows the presence of metal-nitrogen band due to polymerization.
Bismuth, lead and manganese ferrocyanides are found to have light blue, light green and gray colours, respectively. These complexes are amorphous solid and shows no X-ray pattern. Bismuth ferrocyanide is found to be more stable in acids (HCl, HNO3, CH3COOH, H2SO4) at concentration 0.1 – 2.0 M in comparison to lead and manganese ferrocyanides. All three metal ferrocyanides are slightly unstable in base (NaOH, KOH and NH4OH) solutions in the concentration range 0.1 – 2.0 M. Bismuth, lead and manganese ferrocyanides were also found to be stable in salt (NaCl,LiCl,KCl,NH4Cl,RbCl,CsCl,BaCl2,CaCl2 and MgCl2) solutions in the concentration 1.0 – 2.0 M.
Adsorption studies
The adsorption of methylene blue on metal ferrocyanides as a function pH (2.0 – 10.0) and concentration (10-5 – 10-6 M) of adsorbates, was observed by adding 10 ml of methylene blue solution to 25 mg of metal ferrocyanide each time at room temperature 31 0C. The suspension were centrifused after 6 h. The methylene blue concentration was determined spectrophotometrically at λmax, 665 nm. The amount of methylene blue adsorbed was calculated by difference in methylene blue concentration before and after adsorption.
RESULTS
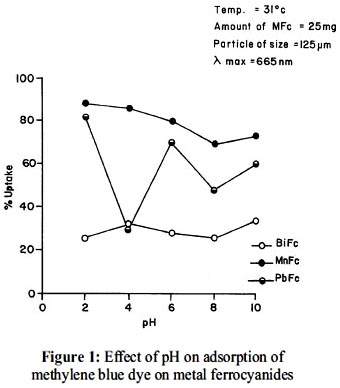
A wide range of pH (2.0 – 10.0) were selected for adsorption studies of methylene blue dye on bismuth, lead and manganese hexacyanoferrate(II) complexes (figure 1). Lead and manganese ferrocyanides revealed maximum adsorption at pH 2.0 while bismuth ferrocyanide at pH 4.0. A neutral pH (7.0 ± 0.01) was chosen to run the sorption isotherms of the dye in a wide concentration range. The neutral pH is physiologically significant as most of the reactions in living systems takes place in neutral medium.
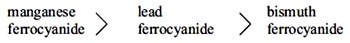
Adsorption isotherms for adsorption of methylene blue dye on bismuth, lead and manganese ferrocyanides are shown in figure 2. The isotherms are positive and concave to the concentration axis. For each adsorption process duplicate experiments were carried out. In duplicate adsorptions the difference in the concentration of methylene blue after adsorption was observed to be in the range of ± 1 %. The following order of uptake of methylene blue on metal ferrocyanides was observed.
The data of adsorption isotherms for methylene blue have been analyzed in terms of Langmuir adsorption equation 17.

where Ceq is equilibrium concentration of methylene blue, b is the constant related to the equilibrium constant or bonding energy (b α e ∆H/RT, the parameter b reflects the steepness of the approach to saturation, more precisely, the b value is the reciprocal of concentration at which half saturation of adsorbent is attained), qeq is the amount (mg) of adsorbate adsorbed per gram of adsorbent and Q0 is the adsorption maxima, i.e. mg of methylene blue required per gram of metal ferrocyanides for forming a complete monolayer on the surface.
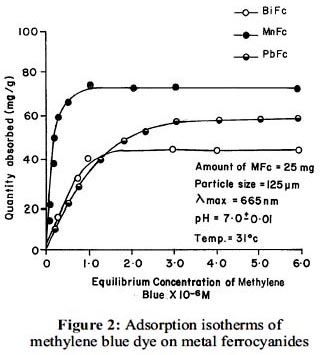
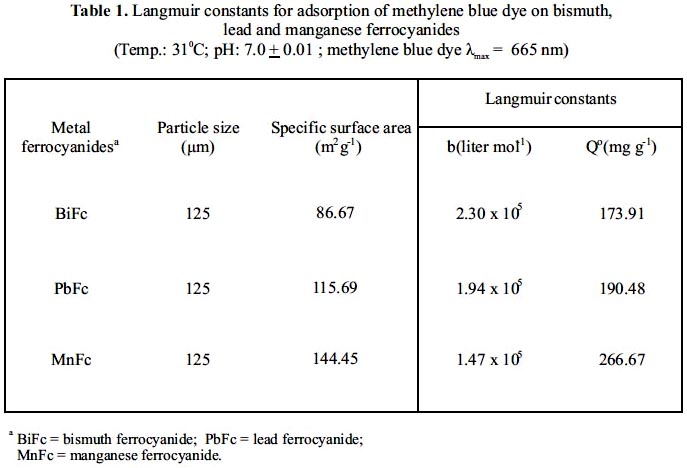
Plot of (1/qeq) versus (1/Ceq) in the concentration range (10-5 – 10-6 M) of methylene blue are shown in figure 3. The straight lines shows the Langmuir type of adsorption in general. The liniar nature of Langmuir plots confirm the formation of a monolayer of methylene blue molecules on the metal ferrocyanides. The values of Langmuir constants b and Q0 were obtained from the slope and the intercept of the plot. The value of the Q0 interpreted as a measure of the accessibility of the adsorption sites and b may be regarded as measure of the affinity of the metal ferrocyanides for the adsorbed methylene blue. The calculated values of the Langmuir constants are given in table 1.
The specific surface area of bismuth, lead and manganese ferrocyanides have been calculated with the help of following equation18

Where Xm is the monolayers capacity in moles per gram; N is Avagadro number (6.019 x 10²³) and A is area per molecule on the surface. Under the condition of optimum flocculation, the area adsorbed by per molecule of methylene blue is taken as 130 Ǻ2, which corresponds to the molecule lying flat on the adsorbent surface. The value of Xm was obtained from the adsorption isotherm corresponding to the point of inflexion. The values of SSA of bismuth, lead and manganese ferrocyanides are given in table 1.
DISCUSSION
It is observed from adsorption isotherms (figure 1) that adsorption is fast at lower concentration but at higher adsorbate concentration it becomes slow which indicates saturation and maximum possible uptake of dye. At higher adsorbate concentration (greater than 10-3 M) Langmuir plots (figure 3) deviate from their linear behaviour, this may be possible due to formation of multilayers19.
It is clear from the table 1 that manganese and bismuth ferrocyanides have greater and lesser specific surface area, respectively, therefore manganese ferrocyanide is considered to be the most porous in comparison to other two metal ferrocyanides studied. Present order of specific surface area values are justified by order of maximum uptake of methylene blue on metal ferrocyanides.
The average standard deviation for the determination of specific surface area of bismuth, lead and manganese ferrocyanides is found to be 0.0275. The correlation coefficient (R) calculated by regression analysis are given in figure 3. The overall statistics are excellent, with an average correlation coefficient of 0.9963. The high correlation coefficient indicates high affinity between the metal ferrocyanides surfaces and methylene blue dye.
Methylene blue dye has often been used for surface area measurements20 and has the advantages of very rapid adsorption on most solids. Determination of SSA of solids by methylene blue dye adsorption is simple and has been shown to give reliable results with a wide variety of solids, therefore present method has significant advantages over other methods reported in chemical literature for the determination of specific surface area of solids.
REFERENCES
1. B. B. Tewari, D. Mohan and Kamaluddin, Colloids Surf. A: Physiochem. Eng. Aspects 131, 89 (1998).
2. B. B. Tewari Rev. Anal. Chem. 1 9, 491 (2000).
3. Kamaluddin, M. Nath, S. W. Deopujari and A. Sharma, Origins Life Evol. Biosphere 20, 259(1990).
4. M. Qurreshi, R. Kumar and H.S. Rathor, Talanta 19, 1377(1972).
5. J. F. Walton, Anal. Chem. 5 2, 15(1980).
6. I. P. Saraswat, S. K. Srivastava, S. K. Verma and A. K. Sharma, Can. J. Chem. 5 8, 2250 (1980).
7. R. Brina and A. D. Battisti, J. Chem. Edu. 6 4, 175(1987).
8. J. H. Potgieter, J. Chem. Edu. 6 8, 349 (1991).
9. V. P. Vinod and T. S.Anirudhan, Water, Air, Solid Pollut. 150, 153 (2003).
10. E. S. Ribeiro, S. S. Rossato, Y. Gushikem and L. T. Kubota, J. Solid State Electrochem 7, 665 (2003).
11. D. Palit and S. P. Moulik, Colloid J. 65, 350 (2003).
12. M. S. Kim, S. I. Seok, B. Y. Ahan, S. M. Koo and S. U. Paik, J. Sol-Gel Sci. Technol. 27, 355 (2003).
13. A. Garcia-Mendieta, M. Solache-Rios and M. T. Olguin, Sep. Sci. Technol. 38, 2549 (2003).
14. R. -S. Juang, R.-L. Tseng and F. C. Wu, Adsorption 7, 65 (2004).
15. B. B. Tewari, D. Mohan Kamaluddin and S. K. Srivastava, Ind. J. Chem. Technol. 2, 113 (1995).
16. V. Kourim, J. Rais and B. Million, J. Inorg. Nucl. Chem. 26, 1111(1964).
17. I. Langmuir, J. Am. Chem. Soc. 40, 1361 (1918).
18. C. H. Gill and S. N. Nakhawa, J. Appl. Chem. 1 2, 266 (1962).
19. M. A. Rahaman and A. K. Ghosh, J. Colloid Interface Sci. 1 7 7, 50 (1980).
20. J. J. Kipling and R. N. Wilson, J. Appl. Chem. 10,109 (1960).
* Corresponding author:
Tel: 592-222-6004;
Fax:592-222-3596;
E-mail: brijtew@yahoo.com
