


 Inglés (pdf)
 Articulo en XML
 Referencias del artículo
 Enviar articulo por email
 Citado por SciELO
  Similares en
SciELO
Similares en
SciELO 
 Permalink
INTRODUCTION
For the physicochemical study of tangible cultural heritage, there are different techniques for non-destructive or minimally invasive surface elemental analysis such as Fourier transform infrared spectroscopy (FTIR)1, Raman spectroscopy2,3, electron microscopy (SEM or TEM), X-ray fluorescence (XRF) and X-ray diffraction (XRD)4, nuclear magnetic resonance (NMR) among others. However, none of them perform elemental analysis through the different layers of the material in a minimally invasive fast way and without sample preparation as the Laser Induced Breakdown Ablation Spectroscopy (LIBS) does4,5,6,7,8,9,10.
LIBS is based on the generation of a plasma composed of the ablated matter as a consequence of the impact of a laser pulse on the surface of the study material11. The plasma contains chemical elements of the material. The excited neutral species and ions have characteristic emission energies that, during their decay, can be detected.
The sensitivity of the method depends, among others, on the chemical element, the parameters of detection, the environmental conditions, and the selection of the area to be analyzed in the sample.12
There are several free-access spectroscopic databases for the qualitative verification of a chemical element. The most common and complete is the National Institute of Standards and Technology (NIST)13 one, which is also used by the LIBS software for the processing of LIBS spectra.
Among the advantages of LIBS in the study of tangible cultural heritage materials is that it does not require sample preparation, its simplicity in the analysis procedure, which can be in- situ, its micro-destructive character by generating a micro crater of even 60 µm (something imperceptible to human eye), the ability to analyze several chemical elements quickly and simultaneously such as Na, Mg, Al, Si, P, S, K, Ca, Ti, Ba and others that make up the clays and the pigments that cover them , as well as the identification of light elements like C, N and O, and even rare elements like lithium.
A good part of the studies of Peruvian archaeological ceramics and pottery (Inca and pre-Inca) as well as the colonial era, is based on the observation of archaeologist who characterizes the ceramic based on the form, decoration, finish, and use. Also, there are studies related to elemental composition determination of clays, pigments, and raw material which used destructive or minimally invasive analysis.
In the literature, we did not find spectroscopic studies of the potter's elaboration process, neither spectroscopic characterization of sequential stages as engobe application, glaze, decoration, enameled coloration, and final painting of Peruvian archaeological pottery. This work aims to find indications of how a contemporary commercial ceramic would have been elaborated, based on LIBS's stratigraphic analysis, to have the basis for subsequent studies with Peruvian archaeological pieces.
EXPERIMENTAL PART
Contemporary Peruvian Commercial Pottery Sample
A contemporary decorative commercial ceramic piece with the shape of a concave plate (Figure 1), diameter of 5.5 cm, was selected because it has a blue coating finish on the front face that is easily differentiated from the matrix paste. Five points of analysis were selected for each color (Figure 2): blue (b1-b5), white (w1-w5), base (bs1-bs5, front side) and the master paste (back).
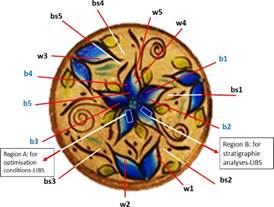
In the blue area, 3 type of tests were carried out: 1) identification of the elements, especially Cu and Ti; 2) optimization of the LIBS analysis parameters for detection of Cu; and 3) differentiation of stratigraphic layers based on elemental composition.
Laser Induced Ablation Spectrometry
A MOBILIBS (IVEA Co.)14 laser-induced ablation spectrometer was used, with a pulsed Nd: YAG laser at 266 nm, a maximum energy available of 10 mJ , a repetition rate of 20 Hz, a pulse duration of approximately 4 ns. The embedded spectrometer is the ANDOR Mechelle covering 200 to 900 nm with an ICCD ANDOR Istar detector. The second system was a TX1000 (IUMTEK)15 laser-induced ablation spectrometer, with a pulsed Nd: YAG laser at 1064nm, maximum energy available of 30 mJ, a repetition rate of 20 Hz, a pulse duration of approximately 10 ns. The embedded spectrometer is the ANDOR Mechelle covering 200 to 980 nm with an ICCD ANDOR Istar detector. Both systems were previously calibrated with a Hg: Ar lamp (Ocean Optics). All analyzes were performed at environmental conditions, under normal atmosphere.
The AnaLIBS software v.6.3 was used to control the focusing of the laser at the point of impact through an optical system and an automatic XYZ positioning system; to change the experimental parameters for optimization of the signal (laser frequency and energy, delay time, exposure time, gain and others); to acquire the individual spectra; to identify the chemical elements emission lines; and finally, to do some mathematical operation on spectra like sum and average, as well as subtraction of the background.
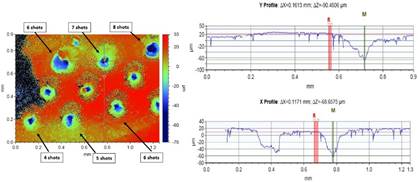
The depth of the craters was measured using an optical Profilometer (Bruker) with the Vision 64 software v.4.1.
RESULTS AND DISCUSSION
Identification of Cu and Ti in the blue pigment
To verify the presence of Copper in the blue region, a set of 3x2 sequential spots (vertical x horizontal in mm) spaced by 2 mm intervals was executed with 10 consecutive shots at each point, making a total of 60 shots. The parameters of detection were: delay time 500 ns, gate 2 µs, gain 200. The following lines were identified for Cu I: 324.75; 327.389, and 515.307 nm (Figure 2). The most intense is at 324.775 nm. For Titanium, several neighboring lines were identified in the regions of 320 to 230 nm; 497.5 to 504.5 nm and 517.2 to 521.3 nm. We have selected the Ti I lines at 517.78 and 519.298 nm.
Optimization of LIBS analysis parameters for qualitative Cu detection
The values (Table 1) correspond to the best experimental conditions for analysis in the blue region, which allowed the identification of Cu lines (324.75 nm), with a more intense signal, less noise, good S/B ratio, minimal damage to the ceramic surface, and that allowed to differentiate the first ceramic finish coat.
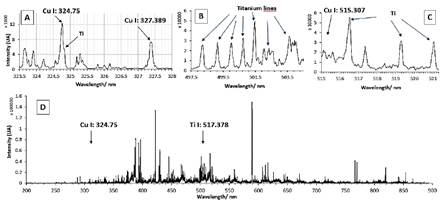
Figure 2 LIBS spectrum of the first layer for the blue pigment in the pottery and the Cu and Ti lines for LIBS analysis optimization. A) enlargement for Cu line; B and C) enlargement for Ti lines; D) complete LIBS sum spectrum (200 - 900 nm).
Subsequently, under these conditions, a 3x2 matrix shots sequence was performed respectively on the blue and white coatings and the matrix paste (on the backside). Then, the sum spectrum of 6 spectra was obtained for each one (Figure 2D). We observed that the blue pigment presented more intensity for Cu, while the white area had more counts for Titanium (Figure 3).
Table 1 LIBS parameters optimized for copper lines (324.75 nm).
| Grupo | N | Media µM Trolox/g | Desv. Estándar | Desv. Error | 95% IC | Mínimo | Máximo | |
| Límite inferior | Límite superior | |||||||
| Patrón | 4 | 0,0000 | 0,0000 | 0,0000 | 0,0000 | 0,0000 | 0,0000 | 0,0000 |
| Atomizado | 4 | 49,575 | 0,2351 | 0,1175 | 45,834 | 53,316 | 46,365 | 216,753 |
| Liofilizado | 4 | 201,814 | 13,162 | 0,6581 | 180,869 | 222,758 | 189,487 | 216,753 |
| Total | 12 | |||||||
This sequence allows distinguishing the composition of the first layer in the blue facing, the white facing, and the matrix paste (Figure 3).
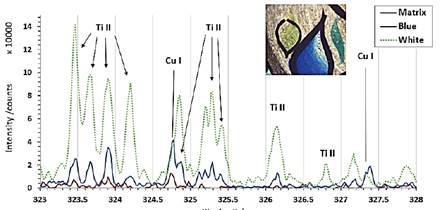
Figure 3 Part of the LIBS spectrum for the first shot on the blue, white and matrix paste (reverse) coatings of the ceramic.
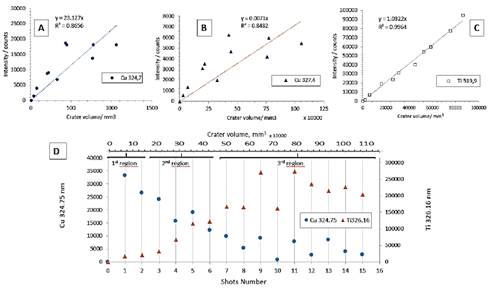
The Cu I lines are observed at 324.75 nm, but it overlaps partially with the Ti 324.86 line; for this reason, we measure Cu line intensity by subtracting the Ti line. The results show (Figure 4) that Cu line intensity decreases against the shot number. At the opposite of Titanium line increase regarding the depth of the crater. The analysis was made over the blue region, but there is probably a white paint layer under the blue layer. That is why we observe the apparition of Ti lines.
Differentiation of stratigraphic layers
The Figure 4A and B show the accumulated intensities of Cu lines over the number of shots versus the volume of the crater. Therefore, when we exclude the Ti counts from the Cu 324.75 nm line, it is possible to identify three regions as we advance in the depth of the crater (Figure 4D). In the first region (first and second shot) Cu 324.75 has the highest number of counts/s, and minor intensities for Ti. The second region (3rd to the 8th shot) has both presence of Cu and Ti. Probably, the profile of the laser beam (Gaussian) produces this mixture of signal from blue and white pigments, the center of the beam digging more rapidly the sample than the edge of the beam. The third region starts on the 9th shot and goes on constituting the white paint. Here the Ti lines are much more intense than Cu lines intensities.
Identification of the composition of the blue pigment
Among the blue pigments currently marketed, there are Lapis Lazuli (Na,Ca)4(Al,SiO4)3(SO4,S,Cl), Maya Blue (indigo and paliogorskite) rich in Mg and Al, Apatite Ca5(PO4)3F, Cobalt blue CoO.Al2O3, Celurean blue CoO.nSnO2, Erinite Ca4(Al; Fe3+;Mg; Fe 2+)10Si12O35(CO3)(OH)12. 12H2O, Cavansite Ca(VO)Si4O10·4H2O, and others that do not contain Cu. The LIBS analysis showed that S, F, Co, Sn and V are not detectable, therefore the presence of this group of pigments, as well as CuSO4, was ruled out.
The Cu common minerals in Peru are malachite (Cu2CO3(OH)2), chrysocolla((Cu,Al)2H2Si2O5(OH)4·nH2O) and greenish-colored atacamite (crystalline form Cu2Cl(OH)3), chalcosite (Cu2S) and covellin (CuS) which have an indigo blue color. And among the blue pigments that contain Cu and are common, Azurite or Malachite Cu3(CO3)2(OH)2, Turquoise Cu(Al,Fe3+)6(PO4)4(OH)8 · 4H2O, Egyptian Blue CaCuSi4O10, Han Blue or Chinese Blue BaCuSi4O10 and Kyanite Ca2Cu2Si3O8(OH)4 were found. Since the intensities of Ba and P are too low to be present, it is more likely that the used pigment was Azurite Cu3(CO3)2(OH)2, since CaCuSi4O10 and Ca2Cu2Si3O8(OH)4 are less common. Furthermore, the results indicate that the blue pigment seems not to be related to Ca (Kyanite) or Al (Chrysocolla), because the line intensities of these two elements in the first layers (Ca 616.2 and Al 394.3 value in the sum spectrum of the first shot of Sum T1) are not more intense than in the matrix paste (values in SumT10).
Furthermore, in the first three layers (paint) no signals were found for S, implying the absence of sulfur compounds, and consequently excluding the presence of ultramarine blue (Na,Ca)8(AlSiO4)6(SO4,S,Cl)2. Otherwise, LIBS is not very sensitive for Sulfur detection in atmospheric conditions, so the last affirmation is not conclusive.
Exploration of the nature of the ceramic matrix paste
The total sum of 30 spectra was obtained. The background was removed (Figure 5), the presence of the elements Na, Mg, Al, Si, K, Ca, Fe, Ti and Mn, which are usual components of clays, was interpreted and confirmed.
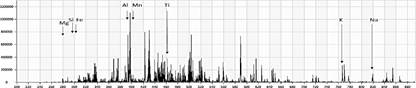
Figure 6 LIBS spectrum of the matrix paste in the ceramic from the total sum spectrum of 30 spectra: 10 shots at the same point with 3 repetitions at different positions.
It was observed that the deeper layers have more intense lines of Al (308.2, 309.3, 394.4, 396.18 nm), Ca (315.9, 393.4, 422.7 and 396.8 nm ), Mg (279.5 and 384.8 nm), Na (330.2 and 818.4 nm) and Si (288.2, 390.5 and 422.7 nm).
Examination of the presence of slipware on the matrix paste
The lines of C 247.856 and N 877 were analyzed to verify a resin's presence on the topcoat. For the elemental analysis, the LIBS TX1000 system was used, with an energy of 5.6 mJ, in sequential layer-by-layer shots. Spectra from 16 shots at the same depth (4x4 matrix) was averaged. We have repeated this protocol at the same place from one to one hundred level of depths. The process was carried out on the blue (b) and white (w) coating, the unpigmented front surface (var), and the ceramic's back (matrix paste = pst).
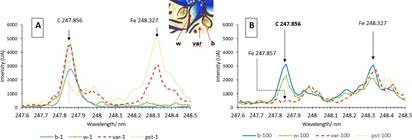
Figure 7 Average LIBS spectra (5.6 mJ) for C 247 line of the blue (b), white (w), unpigmented front surface (var), and matrix paste (pst) coating; A) one shot, and B) 100 shots.
The Fe lines interfere in the qualitative detection of C 247,876 nm (Figure 6). At the first shot (Figure 6A), the spectrum of the matrix paste (pst-1) and the spectrum of the engobe “up side” on front surface (var-1) show the Fe 248.327 line. But the blue (b-1) and white (w-1) covering do not show Fe 248.33 line. These findings allow us to infer that the 247.856 line in b-1 and w-1 corresponds to Carbon and confirms both coatings contain at least one organic compound. When comparing spectra at 100 shots depth (Figure 6B), the C 247.856 line is not detectable on matrix past (pst-100) and engobe (var-100). We conclude that the matrix paste does not have Carbon and that engobe is a thin layer completely drill after 100 laser shots. Therefore, blue and white layer are relatively thick because we detect the Carbon and Iron lines simultaneously. The laser beam profile creates those mixture of signal because the center of the laser drill deeper than the edge of the beam.
On the other hand, these spectra show the N lines, but it is not clear his origin. It could be from the analyzed material or from the air. To be sure it is necessary to do experiments under argon atmosphere.
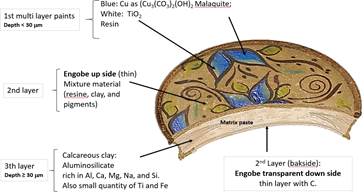
Global observation of the results shows that the ceramic contains the three layers described above (Figure 4B), and it could be represented sequentially as in Figure 7.
CONCLUSIONS
The results of this research allow us to assume that the pottery plate's manufacturing procedure was sequentially matrix paste -> engobe -> white and blue decoration. The elemental composition confirms the presence of malaquite (blue) and TiO2 (white). Though an organic material in this contemporary pottery was confirmed, the analysis of other samples as ancient pottery will need to optimize LIBS parameters for C detection and find the adequate procedure to eliminate de Fe interference. Otherwise, it would be interesting to use a top-hat beam profile to perform an analysis with a good stratigraphic resolution.
The stratigraphic analysis using LIBS reveals which elements are present in the different thin layers. The 5.6mJ laser pulse creates a crater of approximately 60 µm on the surface that could be imperceptible by human eye. This minimal destruction could be acceptable in cultural heritage samples or other valuable materials.

