


 English (pdf)
 Article in xml format
 Article references
 Send this article by e-mail
 Cited by SciELO
  Similars in
SciELO
Similars in
SciELO 
 Permalink
INTRODUCTION
Biodegradable materials within the classification of bioplastics that are generated from biomass have become of great scientific interest, to replace conventional plastics (non- biodegradable) from petroleum derivatives, which is generating pollution for long periods in the environment1.
Bioplastics can be used in the packaging industry in which the objective is to maintain the physical, chemical, nutritional and functional characteristics in optimal conditions until consumption. For this reason, among the most relevant properties to be considered are mechanical resistance, optical property, chemical property, thermal stability, density and barrier property both to humidity and to different gases, being of importance since a packaging material must present little permeability to these so that the product has a longer useful life2.
One of the ways to reduce vapor transmission through polymeric films is through the addition of hydrophobic materials. Graphene is both hydrophobic and impermeable to all gases within ambient conditions3. In general, a hydrophobic material imparts a poor barrier to oxygen and a hydrophilic material imparts a poor barrier to water vapor4. By incorporating graphene nanoparticles into a polymeric matrix, a polymeric nanocomposite is obtained that allows a change in its properties to be generated, thanks to the interaction between the polymer and the nanoparticles5. Composite materials are important today due to their advantageous properties, which are significantly different from the properties of each phase separately. Starch is a polymer made up of long chains of glucose molecules held together by glycosidic bonds and therefore has a chemical formula of (C6H10O5)n. At the molecular level, starch is composed of two main polymeric constituents (amylose and amylopectin), whose properties and proportions vary depending on the source6. On the other hand, the starch present in the polymeric matrix produces intra- and intermolecular hydrogen bonds and presents a partial crystallinity which provides a barrier to oxygen molecules and imparts a barrier to water vapor due to its swelling7.
The purpose of this research work was to find the effect of starch, aloe vera and graphene on vapor permeability as well as on thermal and thermogravimetric resistance, since they are among the determining factors for their use in food packaging, among others.
EXPERIMENTAL PART
Materials
For the synthesis of graphene, graphite from Sigma-Aldrich was used. Sulfuric acid at 98% w/w, potassium permanganate, concentrated hydrochloric acid at 36,5% w/w and ascorbic acid purchased from Merck (Peru) were also used. Tridistilled, deionized and filtered water was used. Yungay potato tubers (Solanum tuberosum) from the department of Huánuco in
Peru were used. Aloe vera (barbadensis Miller) from Lima was used. Venturo brand vinegar and glycerin purchased from Laboratorio Alkofarma EIRL were used.
Methods
Process for obtaining starch, aloe vera and graphene.
Yungay potato starch was obtained by the wet extraction method8 For this, the Yungay potato was harvested, washed and peeled, after which they were chopped into approximately 3 cm sizes and blended with cold boiled water in a proportion of 1: 1 to facilitate starch extraction. It was left to rest for 24 hours in a plastic bucket to decant the starch. The supernatant liquid was then removed, and then the starch was washed with distilled water up to 3 times. The water was then removed leaving the starch at the bottom of the container. The starch obtained was placed in a glass tray and dried in an oven at 50°C for 15 hours. Finally, the starch was pulverized using a mortar and stored in an airtight bottle at a temperature of 20°C9. Thus, starch granules of 5 to 10 microns were obtained.
To obtain the aloe vera gel, the manual separation method by filleting was used, in which the collected aloe vera leaves were washed to remove all impurities. They were then placed for 2 days in a bucket of drinking water to remove the iodine. Then the bark was separated by filleting to leave only the pulp (aloe vera). The separated pulp was chopped and subsequently liquefied for 5 min. to obtain good homogeneity10,11.
Graphene was obtained by the modified Hummer method12. The following procedure was used to obtain graphene: 0,5 g of graphite was weighed and poured into a 250 mL erlenmeyer flask, and then the flask, was placed in an ice bath, then 23 mL of concentrated sulfuric acid were slowly added, keeping the solution at a temperature below 20°C and stirring for 4 hrs. Then 3 g of solid KMnO4 were added slowly and the stirring was maintained for 1 h more in an ice bath to avoid any explosion. The solution was then heated to 35°C, removing it from the ice bath, and keeping it under stirring for 1 hour more, so that the KMnO4 could be oxidized. Next, 45 ml of distilled water were added and the temperature was raised to 95°C; keeping it under stirring for 2 hours, preventing it from boiling during the reaction. Finally, 10 ml of 30% hydrogen peroxide solution was added, and it was stirred for 1 h more. Graphene oxide was washed with a 5% w/v HCl solution, then with distilled water until the pH of the filtrate was 7. The graphene oxide formed was poured into a 250 ml beaker and 200 ml of a 5% m/v ascorbic acid solution was added to achieve the reduction of the graphene oxide and the solution was kept under stirring for 2 hrs. In this stage, topological defects and vacancies produced during the elimination of functional groups can be created13. Then, the filtering and washing process was carried out with distilled water until the filtered water had a pH of 7. Finally, the obtained graphene was dried at 50°C for 2 days.
Preparation of bioplastic films.
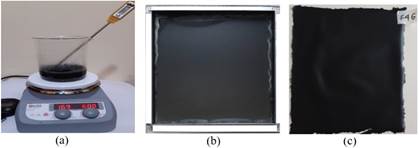
For the preparation of the bioplastic films, the following procedure was used: potato starch was poured into the water, heated to 40°C, and mixed for 10 min., 7 g of vinegar (5% w/v acetic acid) was added and stirred for 15 minutes to produce acid hydrolysis of starch and to remove amylopectin branches. Aloe vera gel was added and after 10 min of stirring, graphene (previously sonicated in 30 mL of distilled water for 30 minutes) was also added, and agitation was continued by other 15 minutes (See Figure 1 (a)). Then 5 g of glycerin were added to provide flexibility to the bioplastic and the mixture was stirred for 10 minutes. The solution was heated between 60°C and 70°C and stirred for approximately 5 minutes until the mixture acquired a certain viscosity and then was poured into a 20 x 20 cm glass mold (see Figure 1(b)). The solution was dried in an oven at 60°C for 10 hours (to complete obtaining of the film) (see Figure 1(c))
Experimental design
To evaluate the effect of the concentrations of Yungay potato starch, aloe vera gel, and graphene on the thermal stability of the films, an experimental design was proposed through a factorial analysis, with three factors: the starch concentration (%w/w), the aloe concentration (%w/w) and the graphene concentration (%w/w), with two levels for each factor: high level (+) and low level (-) as shown in Table 1. The range of graphene concentration was considered from 0,005 to 0,045%, since at higher concentrations the films were brittle.
Tabla 1 Factorial design 2˄3.
| Experimental | Notation | [starch] | [aloe gel] | [Graphene] |
|---|---|---|---|---|
| Run | [starch][aloe][graphene] | % w/w | % w/w | % w/w |
| F1G | (+)(+)(+) | 10 | 24 | 0,045 |
| F2G | (-) (-) (-) | 6 | 20 | 0,005 |
| F3G | (+)(+) (-) | 10 | 24 | 0,005 |
| F4G | (+)(-) (+) | 10 | 20 | 0,045 |
| F5G | (-) (+) (-) | 6 | 24 | 0,005 |
| F6G | (-) (-) (+) | 6 | 20 | 0,045 |
| F7G | (+) (-) (-) | 10 | 20 | 0,005 |
| F8G | (-)(+) (+) | 6 | 24 | 0,045 |
| I1 | (0)(0) (0) | 8 | 22 | 0,025 |
| I2 | (0)(0) (0) | 8 | 22 | 0,025 |
In each run, the glycerin concentration was maintained at 5% w/w, vinegar concentration at 7% w/w and the rest distilled water was used until completing 100% in the formulation.
Glycerin was added as a plasticizer to favor the formation of the film and give it flexibility, although this also produces an increase in permeability.
Characterization of materials and starch films
For the structural characterization, a Nicolet model protege 8700 equipment with an ATR accessory and ZnSe crystal was used, making 6 scans from 4000 to 650 cm-1, and a resolution of 4 cm-1.
The crystallographic structure and the presence of graphene were analyzed by X-ray diffraction (XRD) using a BRUKER brand diffractometer, model D8-FOCUS, which used a Cu tube, whose wavelength corresponding to Kα1-Cu was ë =1,5406 A°. X-ray generator with tube output voltage = 40 kV and tube output current = 40mA in a measurement range between 10 to 80° on the 2Ɵ scale.
To evaluate the thermal stability and the decomposition temperature of the bioplastic, a TA Instruments model Q500 thermogravimetric analyzer (TGA) was used. Samples were analyzed from 50°C to 800°C at a heating rate of 10°C/min. under an inert atmosphere of nitrogen.
To evaluate the thermal transitions of the materials, a TA Instruments model Q200 Differential Scanning Calorimeter (DSC) was used. For the analysis, 10 mg of sample were weighed in aluminum trays, sealed and placed in the equipment. Analysis conditions were set from -50
°C to 225 °C with a heating rate of 10 °C/min under a nitrogen gas flow of 50 mL/min in order to maintain an inert atmosphere.
The morphology analysis of the cross section of the bioplastics was observed using a JEOL 6360LV SEM scanning electron microscope operated at 20 kV.
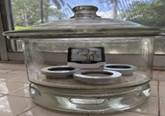
For the determination of the water vapor transmission (WVT) and the permeance in the starch/aloe vera/graphene films, the standard ASTM E96/E96M-14: Standard Test Method for Water Vapor Transmission of Materials was used, using the desiccant method or dry cup method. Permeability cups of 25 cm2 were assembled for each bioplastic film. To do this, the cups were filled with desiccant (silica gel) to a limit of 1⁄4 inch (6 mm) before the upper edge, the test film (cut to the size of the cup frame) was placed on the seal of plastic (see Figure 2). The surface that was exposed to the environment during the manufacture of the film is the one that came into contact with the high moisture side of the system. The neoprene seal was placed on the metal ring and the cup lid was screwed on. Once the initial weight of the assembled cups was obtained, they were placed inside a desiccator, which contained distilled water in its lower part, which was previously conditioned to a relative humidity (RH) of 70 ± 5% and a temperature of 23,0 ± 0,5°C. The weight of the assembled cups was recorded every 15 minutes for 8 hrs and finally the 24 hours weight was taken. For each evaluated material, the weight of the crown was plotted as a function of the elapsed time and when at least 4 points were adjusted to a straight line, a stationary state was assumed, with the slope of the straight line being the speed or speed of transmission of water vapor (Gt).
RESULTS AND DISCUSSION
Structural characterization of bioplastic films
Figure 3 shows the FTIR spectra corresponding to the samples with the high level (F1G) and the lower level (F2G) of the components (see the factorial design in Table 3). In general, the spectra were very similar, although an increase in the intensity of the peaks corresponding to the characteristic functional ground of starch or aloe vera gel can be seen when the films contained the highest level of these compounds. In the region from 400 to 1250 cm-1 considered the fingerprint region14, there were four characteristic peaks in the spectra between 925 and 1150 cm-1, which are attributed to stretching of the CO bond15. The peak located at 1467 cm-1 is assigned to the bending of the CH2 group and the broad peak located between 2900 and 2950 cm-1, characteristic of the C-H stretches and associated with the glucopyranose ring16. The broad peak between 3000 and 3700 cm-1 is due to the hydrogen bonding of the hydroxyl groups that contributes to the stretching vibrations associated with the inter and intramolecular free bonding of the hydroxyl group, this group being a characteristic of the structure of the starch17.
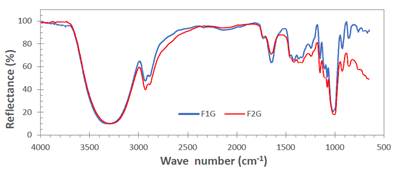
Figura 3 Infrared spectra of bioplastic samples with the higher level (F1G) and the lower level (F2G) of the components (potato starch, aloe vera, and graphene).
Difracción de Rayos X
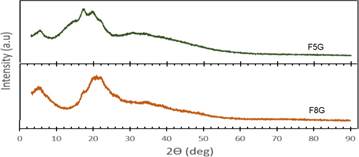
To verify the presence of graphene and starch crystals in the bioplastic, the films were analyzed by X-ray diffraction. Figure 4 shows the presence of graphene is justified by the wide and weak band that is detected with values of 2Ɵ between 20 and 30° and whose intensity depends on the C/starch ratio. Likewise, there is no presence of graphene oxide or graphite. According to Pardo et al., it can be inferred that the starch has a crystallinity of less than 10%, that is, the starch of the Yungay potato is similar to that of the Creole potato18. It is observed that granular starch presents a type A polymorphism characteristic of cereals with the main reflections at 2θ =15,3; 17,5 and 23,13°19. However, when a starch plasticized with glycerol is obtained, it recrystallizes in the type B polymorphism, this change in the polymorphism of the starch after its plasticization can be attributed to different factors such as the moisture content in the samples and in the environment, the content plasticizer, sample preparation, among others20. Due to the fact that, for the formation of the bioplastic, the processing is carried out in the molten state, in which it exceeds its glass transition temperature, the starch crystallizes in the type B structure, which is verified with a characteristic signal at a value of 2Ɵ =16,8°21.
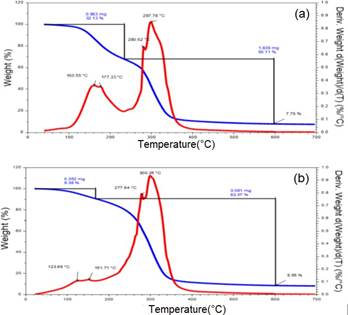
Thermogravimetric analysis
Figure 5 shows the thermogravimetric analysis (TGA) curves as well as the differential thermogravimetric analysis (DTG) curves of the bioplastic films. According to Figure 5 (a) y (b), the thermograms (TGA) shown correspond to the samples with the higher level (F1G) and the lower level (F2G) of the components (see the factorial design in Table 1), in which the two decomposition zones are shown: the first zone in the range of 100 and 280°C correspond to moisture loss and glycerin volatilization and the second zone at a temperature of approximately 300°C (see Table 2), which is due to starch degradation. These results were similar to those reported by Luchese et al.22
It is important to note that bioplastics have drawbacks compared to conventional plastics, namely in terms of thermal properties. However, one of the strategies for improving the thermal properties of bioplastic is the filler and additive addition in bioplastic matrix23.
Table 2 Thermogravimetric analysis of bioplastic with graphene.
| Sample | Code | First decomposition temperature. (°C) | Second decomposition temperature. (°C) |
|---|---|---|---|
| F1G | (+)(+)(+) | 177,33 | 297,78 |
| F2G | (-) (-) (-) | 151,71 | 300,26 |
| F3G | (+)(+) (-) | 168,07 | 300,55 |
| F4G | (+)(-) (+) | 244,14 | 303,76 |
| F5G | (-) (+) (-) | 239,32 | 282,86 |
| F6G | (-) (-) (+) | 169,54 | 296,17 |
| F7G | (+) (-) (-) | 143,84 | 302,71 |
| F8G | (-)(+) (+) | 178,3 | 299,3 |
| I1 | (0)(0) (0) | 192,3 | 298,3 |
| I2 | (0)(0) (0) | 195,2 | 301,2 |
Differential Scanning Calorimetry (DSC)
The effect of graphene, aloe and starch on melting temperatures (Tm) and heat of fusion (Lf) was studied by DSC. Figure 6 shows the melting temperature (Tm) and crystallization temperature (Tc) curves, for which the heat flow vs. temperature has been plotted.
Dispersion and polymer-charge interaction across an interface are crucial in heat transfer. A strong polymer-charge adhesion promotes that the polymer chains are absorbed by the surface of the charge, as a result of this strong interaction the dispersion of the charge is favored and consequently the formation of networks or paths of thermal conduction is viable24. On the other hand, the contribution of graphene to the thermal properties of the bioplastic will largely depend on its degree of dispersion25.
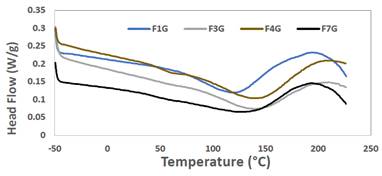
In DSC thermograms reported for different varieties of starch, two endothermic peaks are reported, an endothermic peak in the amorphous zone of lower temperature due to the solubilization of the amorphous region of starch rich in amylose (linear chain) and an endothermic peak (Tp) in the crystalline zone of higher temperature due to the solubilization of the crystalline region composed of amylopectin (branched chain)18. However, in the thermogram of the bioplastic only an endothermic peak was observed, in the peak temperature ranges between 120,42 and 143,20°C, values higher than when only starch is present (Tp between 65,48 and 110,02°C)18, which indicates that incorporating graphene and aloe vera increases the thermal resistance of the bioplastic obtained. However, a lower gelatinization energy was obtained between 21,45 and 63,66 J/g, compared to the gelatinization energy for starches from 76,53 to 334,50 J/g. Therefore, the bioplastics obtained presented low gelatinization energy. As the temperature increases, it indicates that it absorbs more heat to produce the solubilization of amylose and then the fusion of amylopectin crystals. It is important to point out that the second endothermic peak of the bioplastic must be at a temperature of approximately 300°C at which the second decomposition temperature is shown in the thermogravimetric analysis of the bioplastic in Figure 5.
Table 3 Thermal analysis obtained by DSC of bioplastics with Graphene.
| Code | Endothermic peak | |||
|---|---|---|---|---|
| Ti(°C) | Tf(°C) | Tp(°C) | ∆Hf(J/g) | |
| F1G | 70,86 | 189,52 | 120,42 | 63,66 |
| F3G | 78,23 | 201,77 | 141,17 | 29,94 |
| F4G | 83,42 | 205,02 | 143,2 | 34,35 |
| F7G | 70,69 | 188,08 | 134,38 | 21,45 |
Ti: Initial temperature, Tf: Final temperature, Tp: Peak temperature and ∆H: Gelatinization enthalpy.
Morfological study
Figure 7 shows the images obtained by SEM of the cryogenic fracture zone of the graphene- reinforced films with the higher concentration of graphene (0,045% w/w) at different magnifications. It can be observed that all samples show the presence of several stacked graphene sheets with a dense, wrinkled and folded morphology indicated by the arrow in Figures 7 and this is more notorious when the high level of starch was used in the films (F1G and F4G).
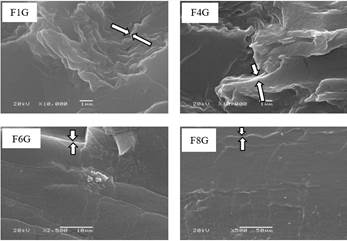
Figure 7. Images obtained by SEM of the surface of the cross section at higher amplitude of bioplastic films with a graphene concentration of 0,045% w/w.
The image obtained indicates that even the high shear stresses generated during the mixing process are not enough to break the agglomerates formed by the accumulation of large numbers of graphene particles stacked together by Van der Walls attraction forces26.
Permeability and permeance
The water vapor transmission (WTV) and water vapor permeance values were calculated from the following expressions:
Water Vapor Transmission Rate, WVT:
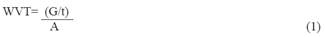
Where:
G = weight change, in grams (from linear graph G/t) t = time, hours
A = exposure area, m2 (canopy area: 0,0025 m2).
Permeance:
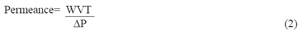
Where:
∆p = S (R1 - R2),
S = mmHg (Absolute saturated vapor pressure at a temperature of 23°C., 21,068 mmHg)* R1 = Relative humidity of the crown, that is, 1
R2 = Relative humidity at normal laboratory conditions (0.5)
* Value reported in Table 1 of the ASTM D1653-1 standard (Standard Test Methods for Water Vapor Transmission of Organic Coating Films).
Permeability:

The bioplastic films evaluated had an average thickness of 0,3437 mm.
Next, the results of permeance and permeability of bioplastic films are reported in Table 4.
Table 4 Permeance and permeability of bioplastic films based on starch, aloe and graphene.
| Sample | Code | WVT (g/h.m2) | Permeance (kg/Pa.h.m2) | Permeability (kg/Pa.h.m) |
|---|---|---|---|---|
| F1G | (+)(+)(+) | 7,81 | 5,56 | 0,001911 |
| F2G | (-) (-) (-) | 9,3 | 6,62 | 0,002275 |
| F3G | (+)(+) (-) | 7,52 | 5,35 | 0,001839 |
| F4G | (+)(-) (+) | 8,17 | 5,81 | 0,001997 |
| F5G | (-) (+) (-) | 11,13 | 7,92 | 0,002722 |
| F6G | (-) (-) (+) | 22,69 | 16,1 | 0,005534 |
| F7G | (+) (-) (-) | 12,26 | 8,73 | 0,003 |
| F8G | (-)(+) (+) | 18,5 | 13,17 | 0,004527 |
| I1 | (0)(0) (0) | 24,03 | 17,1 | 0,005878 |
| I2 | (0)(0) (0) | 23,42 | 16,68 | 0,005733 |
Statistical analysis of permeability results
Table 5 shows the analysis of variance of the permeability results, which was obtained using the statistical software Minitab 25, and it was found that the concentration of starch and the concentration of graphene had a significant effect with p values of 0,029 and 0,044 (p-value
˂ 0,05). However, the concentration of aloe had no significant effect. In addition, Figure 8 shows the graph of the main effects, finding that both starch and aloe produce a decrease in permeance, while graphene produces an increase in permeance.
Table 5 Analysis of variance of the permeability of bioplastic films.
| Interactions and Effects | p-value |
|---|---|
| Main effects | |
| A: Starch concentration (%) | 0,029* |
| B: Aloe vera concentration (%) | 0,101 |
| C: Graphene concentration | 0,044* |
| AB | 0,253 |
| AC | 0,031* |
| BC | 0,415 |
| ABC: | 0,072 |
| Central point | 0,018* |
*p-value ˂ 0,05
Likewise, the permeance and permeability values of the bioplastic films were obtained at various concentrations of graphene (see Table 6).
Table 6 Results of permeance and permeability of bioplastic films.
| [Starch] | [Aloe] | [Graphene] | Permeance | Permeability |
|---|---|---|---|---|
| %m/m | %m/m | %m/m | kg/kPa. h. m2 | kg/kPa. h. m |
| 6 | 24 | 0 | 13,67 | 0,004699 |
| 6 | 24 | 0,005 | 7,92 | 0,002722 |
| 6 | 24 | 0,025 | 10,81 | 0,003716 |
| 6 | 24 | 0,045 | 13,17 | 0,004527 |
According to Table 6, there are lower values of permeability and permeance of 7,92 kg/ kPa.h.m2 and 0,002722 kg/kPa.h.m respectively at a concentration of 0,005%m/m of graphene. Although it shows a dual behavior, that is, it decreases the permeability up to a concentration of 0,005% of graphene and then increases the permeability to water vapor.
The increased permeability may be due to the fact that, although a crystalline graphene nanosheet, without flaws, is impermeable to gases27,28, however, with the increase in concentration, the formation of agglomerations is possible, which generates preferential pathways for the passage of gases increasing permeability.
CONCLUSIONS
A minimum permeance and permeability value of 5,35 kg/h.kPa.m2 and 0,001839 kg/h. kPa.m, respectively, was found at a graphene concentration of 0,005%; aloe concentration, 24%; and starch concentration, 10%.
It was shown that the permeability to water vapor does not depend only on the concentration of graphene (filler), but also on the concentration of aloe vera and the polymer-particle interaction that determines the dispersion, the permeant gas molecule affinity - membrane and the morphology of the nanoparticle.

