


 English (pdf)
 Article in xml format
 Article references
 Send this article by e-mail
 Cited by SciELO
  Similars in
SciELO
Similars in
SciELO 
 Permalink
INTRODUCTION
One of the major problems in the pharmaceutical area is the low bioavailability obtained by conventional drug delivery systems. Drug plasmatic concentration must be regulated with appropriate parameters in order to avoid side effects 1,2. Controlled delivery devices offer a solution to this limitation. These systems keep the plasma concentration at therapeutic levels or constant concentration in the target tissue 3.
Nanotechnology has had great development due to its wide applications in medicine, foods, semiconductors, sensors, etc 4. In the biomedical field, nanocarriers represent a promising alternative for efficient transportation of drugs. Polymeric nanoparticles exhibit suitable physical, chemical, and biological properties for applications as nanocarriers 5. Biopolymers are an excellent source to develop biomaterials that can be used as drug delivery systems 6.
Collagen is the most abundant protein in animals and it is located in connective tissue of the human body. Some properties such as immunogenicity, biodegradability, and biocompatibility make it a good option for biomaterials preparation 7. Chemical or thermal denaturation of collagen produces gelatin. Collagen and gelatin are two proteins with promising properties for medical application 8.
Chitin, one of the most abundant polysaccharides, is frequently found in biological structures such as arthropods exoskeleton and cell walls of fungi. The deacetylation of chitin produces chitosan, a biodegradable and biocompatible copolymer of 2-amine-2- deoxy-D-glucopyranose and 2-acetamide-2- deoxy-D-glucopyranose linked by β (1→4). Chitosan has been studied and applied as a drug release system due to its medical properties. Examples of these reported include antimicrobial activity, mucus- adhesiveness, and coagulant effect 9,10. On the other hand, chitosan has been used in tissue engineering as a healing and pain reliever, which are attractive characteristics for future research.
Ionic gelation is an easy method to obtain chitosan nanoparticles; it is based on the crosslinking of chitosan with a polyanion like tripolyphosphate (TPP) 11. Previous studies have reported the influence of the molecular weight in the nanoparticles' hydrodynamic size. Nanoparticles of chitosan 42 kDa mixed with alginate showed 284 nm of size; when chitosan molecular weight was increased to 106 kDa, the size also increased to 852 nm. The same effect was found in nanoparticles of chitosan/TPP. Samples with 60 nm of size were obtained when 70 kDa chitosan was used. 12,13. Chitosan/tripolyphosphate nanoparticles were obtained with similar size, chitosan of 154 kDa produced particles of 279 nm 14.
Poopak Farnia et al. described the preparation of nanoparticles based on chitosan and gelatin for the encapsulation of curcumin 15. Although collagen nanoparticles had already been synthesized 16, chitosan/collagen nanoparticles were reported in only a few works17. Collagen carboxyl groups can interact with chitosan amino groups through electrostatic interactions to strengthen the mechanical properties of the polymeric matrix18. Thise background describe the high potential of chitosan, collagen, and gelatin for the design of biomaterial devices.
In this work, it was prepared polymeric nanoparticles made from mixtures of chitosan/collagen or chitosan/gelatin for the encapsulation and release of picric acid. The influence the proportion exerts and the nature of the base materials were studied aiming to know the features of the nanosystems as drug delivery systems.
EXPERIMENTAL PART
Materials
Chitosan, 88% of deacetylation degree (DD) and 293.3 kDa, was obtained by deacetylation of squid pen chitin (loligo sp) following the procedure reported by Horn et. al. 18. Depolymerized chitosan (CS) of a low molecular weight, 81.0% of DD and 50.4 kDa, was obtained by oxidative depolymerization using NaNO2. A solution of 800 mL of 1% chitosan was prepared by dissolution of the polymer in 1% acetic acid solution (HAc). It was treated with 27 mL of 0.1 mol L-1 NaNO2. Subsequently, it was stirred for 3 hours and then a solution of NaOH was added until the pH changed to 8. Finally, it was centrifuged at 8000 rpm for 10 min, washed with deionized water and lyophilized 19.
Anionic collagen (CL) was extracted from the bovine tendon following the procedure of Munhoz. 20. The denaturation temperature of CL measured by DSC was 42,1 °C. Molecular weight for collagen type I derived from bovine tendon is approximately 300 kDa 21.
Gelatin (G) was purchased from Sigma-Aldrich (type A from porcine skin, 50-100 kDa). Sodium tripolyphosphate (TPP) was obtained from Labsynth. Other reagents were of analytical degree.
Nanoparticles Preparation
CS was mixed with anionic collagen to get CS/CL nanoparticles or mixed with gelatin to obtain CS/G nanoparticles. The polymers were crosslinked by ionic gelation methodology using TPP as a crosslinking agent 22. A 0.5 mg mL-1 CS solution in HAc (pH 3.5) was mixed with a 0.5 mg mL-1 CL solution in HAc (pH 3.5) according to Table 1. The resulting solution was adjusted at pH 4.8 with NaOH solution, heated at 60 °C for 10 min and placed in an ice bath. Afterwards, 4.5 mL of 0.5 mg mL-1 TPP was added to the solution and stirred for 10 min. Then, the obtained suspension was centrifuged at 16000 rpm for 50 min. It was washed with deionized water and resuspended in 40 mL of deionized water by sonication at 42 kHz for 30 min in an ultrasonic bath.
The same procedure was carried out for the preparation of CS/G nanoparticles, replacing CL solutions by G solutions.
A set of nanoparticles was prepared by mixing the polymeric solutions in the proportions shown in Table 1.
Table 1 Volumes of CS, G and CL solutions used in the preparation of polymeric nanoparticles.
| Polymeric Nanoparticle | Vol. CS (mL) | Vol. G (mL) | Vol. CL (mL) |
| CS/G1 | 12 | 3 | - |
| CS/G2 | 10 | 5 | - |
| CS/G3 | 7.5 | 7.5 | - |
| CS/CL1 | 12 | - | 3 |
| CS/CL2 | 10 | - | 5 |
| CS/CL3 | 7.5 | - | 7.5 |
Nanoparticles suspensions were lyophilized in order to determinate yield through the following equation:
Materials Characterization
Functional groups in samples were identified by Fourier transform infrared spectroscopy (FTIR). The spectra were recorded on an FTIR Spectrophotometer Shimadzu IR Affinity-1 The spectra were obtained in the range 400-2000 cm-1 with a resolution of 4 cm-1. Size and morphology of the nanoparticles were determined by Scanning electron microscopy (SEM). SEM micrographs were obtained in a ZEISS LEO 440 microscope (Cambridge, England), operated at 20 kV.
Hydrodynamic size distribution of the nanoparticles dispersed in deionized water was determined by Dynamic Light Scattering (DLS) using a Malvern Zetasizer Nano ZS, at 25°C, pH 7 and 173° of scattering angle.
The Z-potential of the nanoparticles dispersed in deionized water (pH 7) was measured using a Malvern Zetasizer Nano ZS.
Incorporation and Characterization of Picric Acid in Nanoparticles
Owing to the affinity between chitosan and picric acid, this compound was proposed as a model for release tests 23,24.
Different amounts of lyophilized nanoparticles (CS/G1 or CS/CL1) were mixed with 10 mL of picric acid (PA) solution according to Table 2 and sonicated at 42 kHz for 1 hour. Afterwards, the suspensions were centrifuged at 16000 rpm for 50 min, the supernatant was separated by decantation. The quantity of loaded PA was calculated by measuring the absorbance of supernatant at 356 nm in a Hitachi U-3000 UV-Vis spectrophotometer. Incorporation efficiency (IE) and loaded content (LC) were determined according to the following equations:
Table 2. Concentration of PA solutions and nanoparticles mass employed in the preparation of PA loaded nanoparticles.
In vitro PA Release
To evaluate the PA release, 20 mg of nanoparticles was mixed with 20 mL of 150 μg mL-1 PA, the system was sonicated at 42 kHz for 1 hour and centrifuged at 16000 rpm for 50 min. The loaded nanoparticles were separated by decantation and dispersed in 10 mL of phosphate buffer saline (PBS) at pH 7.4, subsequently the mixture was transferred to a dialysis bag (cut-off 14000 kDa). The dialysis bag was immersed in 90 mL of the same buffer and the system was kept stirring at 50 rpm at 37 °C. 2 mL of the release medium was taken at different time intervals and PA concentration was analyzed by UV- Vis spectroscopy using a calibration curve at 356 nm. Then, the solution was returned to the release medium. 25,26.
Kinetics models
Mathematical methods of dependent and independent models were used in order to know the behavior of PA release27. Free release of PA was evaluated in sample CS/G1-PA3 and CS/CL1-PA3 due to their high loaded content.
In the independent model, 10 mL of 150 μg mL-1 PA solution was used as a reference system (RS). The RS was placed in a dialysis bag and the PA release was monitored following the methodology described in the item 2.5
Difference factor (𝑓1) and similarity factor (𝑓2) were calculated following the equations:
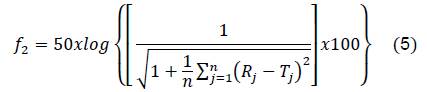
Where 𝑛 is the number of points, 𝑅𝑗 is the drug quantity in RS at the time 𝑗, and 𝑇𝑗 is the drug quantity in the external system of the dialysis bag at the same time.
The first order model was used in the dependent model27, which is expressed by the equation:
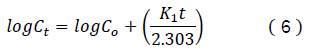
Where 𝐶𝑡 is the drug concentration at the time t and 𝐶𝑜 is the initial drug concentration in the solution,
𝐾1 is the first order release constant.
The Korsmeyer-Peppas model was used in order to know the release mechanism, this is described by the equation 28:
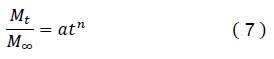
Where 𝑀𝑡 is the drug quantity at the time t, 𝑀∞ is a drug quantity at an infinite time, 𝑎 is a kinetic constant and 𝑛 is the release exponent.
RESULTS AND DISCUSSION
Nanoparticles Characterization
The FTIR spectra of samples are shown in Figure. 1. The spectrum of CS (Figure. 1a) exhibits a band at 1637 cm-1 related to the stretching vibration of amide I. The amide group is presented in the acetylated repeating unit of chitosan. The band at 1559 cm-1 corresponds to bonding vibration of amine -N-H. The amine groups are presented in the deacetylated repeating unit of chitosan 29,30. The signal at 1099 cm-1 is associated to pyranoside structure vibration 29,31.
The spectrum of G (Figure 1b) shows a band at 1649 cm-1 attributed to the stretching vibration of amide I due to the peptide bonds presented in the polymer. The band at 1541 cm-1 is associated with the vibration of the amide II 32. The signal at 1455 cm-1 was originated from vibration of pyrrolidine rings of proline and hydroxiproline 33,34. The Amide III signal observed at 1240 cm-1 is associated with stretching vibration of the C-N bond coupled with deformation in the plane between the N-H bond of the amide and CH2 glycine group vibration 32.
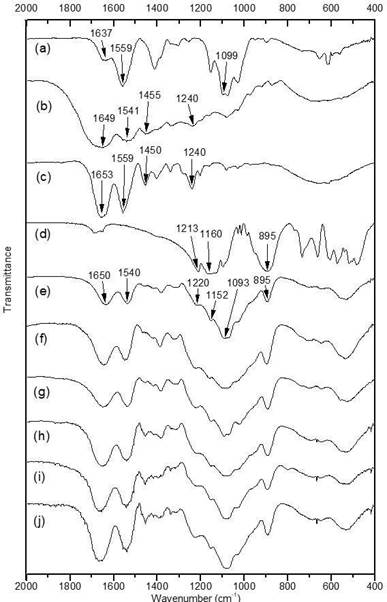
Figure. 1 FTIR spectra of a) Depolymerized Chitosan (CS), b) Gelatin (G), c) Anionic Collagen (CL), d)Tripolyphosphate (TPP), e) CS/G1, f) CS/G2, g) CS/G3, h) CS/CL1, i) CS/CL2 and j) CS/CL3.
The spectrum of CL (Figure 1c) shows similar bands, amide I at 1653 cm-1, amide II at 1559 cm-1, pyrrolidine vibration at 1450 cm-1 and amide III at 1240 cm-135,36. Absorbance relation between bands at 1240 and 1450 cm-1 (A1240/A1450) in the collagen was 1.20, this relation indicates the integrity of the collagen triple helix. In the case of gelatin, this relation was 0.88, characteristic of gelatin from porcine skin 34. The Figure 1d. showed the main bands of tripolyphosphate, the bands at 1213 cm-1 and 1160 cm-1, correspond to the stretching vibrations of P=O and the stretching vibration of bond P-O was observed at 895 cm-137.
The nanoparticles’ spectra (Figure 1e, f, g, h, i and j) present a similar profile. The band around 1650 cm- 1 is attributed to the amide group presented in collagen and gelatin. The band at 1540 cm-1 is attributed to the amine group in chitosan and the amide II of the proteins, since both vibrations appear at similar wavenumber. The band observed around 1093 cm-1 belongs to the chitosan pyranoside vibration. The vibrations at 1220, 1152 and 895 cm-1 were attributed to the main vibrations observed in the tripolyphosphate spectrum. These results suggest that the nanoparticles are composed of chitosan, proteins (CL or G) and tripolyphosphate.
Yield obtained in nanoparticles preparation is shown in table 3. Chitosan/collagen nanoparticles presented greater values of yield than the chitosan/gelatin nanoparticles, probably due to the fact that collagen present greater interaction with chitosan originated by the great quantity of carboxylate groups compared to gelatin 18. Similar interaction between chitosan amine groups and a negatively charged agent also was observed in chitosan nanoparticles prepared with tripolyphosphate as a crosslinking agent 38.
SEM images of chitosan/gelatin nanoparticles (CS/G) and chitosan/collagen nanoparticles (CS/CL) are shown in Figure 2. The images show spherical nanoparticles with sizes smaller than 300 nm and low agglomeration.
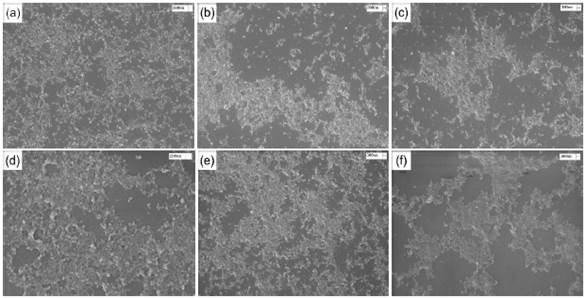
Figure. 3 shows the size distribution of the polymeric nanoparticles obtained by DLS. CS/G nanoparticles presented a similar narrow size distribution, while CS/CL nanoparticles presented a different size distribution. The hydrodynamic size and the polydispersity index of the nanoparticles are listed in Table 3. CS/G nanoparticles were monodispersed and the hydrodynamic size increased slightly when the CS:G ratio decreased. CS/CL1 was monodisperse and presented a hydrodynamic size similar to the CS/G nanoparticles. However, a decrease in the CS:CL ratio abruptly increased the hydrodynamic size and the polydispersity index, thus creating an agglomeration of the nanoparticles due to the low colloidal stability 39,40.
Figure 3 . Particles size distribution of (a) CS/G1, CS/G2 and CS/G3 and (b) CS/CL1, CS/CL2 and CS/CL3 in water.
Table 3 CS/G and CS/CL nanoparticles properties
| Nanoparticle | Yield (%) | Particles size (nm) | (PDI) |
| CS/G1 | 35.5 | 236.9 ± 1.6 | 0.13 ± 0.02 |
| CS/G2 | 46.5 | 240.6 ± 3.5 | 0.14 ± 0.01 |
| CS/G3 | 44.8 | 265.7 ± 2.1 | 0.19 ± 0.02 |
| CS/CL1 | 86.5 | 251.9 ± 2.9 | 0.20 ± 0.02 |
| CS/CL2 | 89.2 | 367.1 ± 4.3 | 0.25 ± 0.01 |
| CS/CL3 | 86.5 | 858.6 ± 12.1 | 0.39 ± 0.03 |
CS/G1 and CS/CL1 were selected due to their lower particle sizes for the subsequent studies. The zeta potential of CS/G1 was +15.70 mV. This value indicates the presence of positive charged species on the nanoparticles surface produced by the amino groups from chitosan. Nanoparticle CS/CL1 exhibited a zeta potential of -3.80 mV. The negative electric charges are produced by the carboxylate groups of collagen.
Chitosan and gelatin are compatible macromolecules, they were extensively used in preparation of blends 41. The protonated amino groups of chitosan interact with side chain groups of amino acid groups of gelatin, in this case with aspartic and glutamic acid, 41 and 71 groups in 1000 amino acid groups respectively 42.
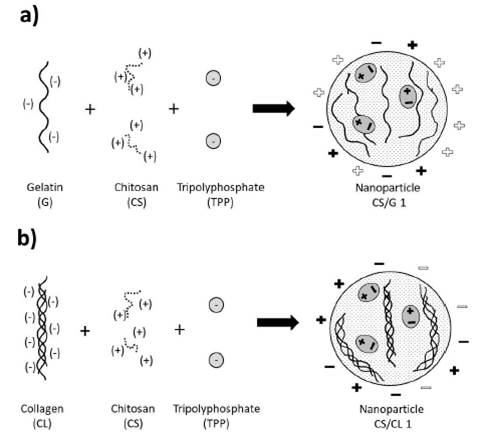
In a process of hydrolysis of collagen of 144 hours, one molecule of anionic collagen presents 369 carboxylate groups in chains of approximately 3139 amino acid groups 43, which makes it possible to have enough negative charge to interact with a polycation, like chitosan. In other works, anionic collagen interacted with chitosan through the carboxylate and amine group 18. Each one of them was responsible for the negative and positive charge respectively. Figure 4 shows the scheme of nanoparticle formation.
Incorporation and Characterization of Picric Acid in nanoparticles
Table 4 shows the incorporation efficiency (IE) and the loaded content (LC) of the polymeric nanoparticles. The behavior of both parameters in chitosan/gelatin and chitosan/collagen nanoparticles was similar. When the nanoparticles mass is constant (10 mg), an increase in PA concentration produces an increase in IE and LC. The increase of PA molecules in a unit volume increases the number of collisions between the polymeric matrix and PA. This means that the particles are able to incorporate more PA; nevertheless, this effect has a limit since the particles are only able to carry a maximum PA quantity. On the other hand, at a given PA concentration (150 μg mL-1), an increase in the mass of nanoparticles increases the incorporation efficiency. In this case, the increase of nanoparticles’ mass increases the number of particles to interact with the same quantity of PA, each one of them is able to incorporate a determined mass of PA. Consequently, the incorporation efficiency increases; however, as the quantity of PA is constant, each particle gets less PA and the loaded content decreases. These tendencies were also reported by previous works 44,45.
Table 4 Incorporation efficiency (IE) and loaded content (LC) of polymeric nanoparticles.
| Nanoparticles | PA Concentration (μg mL-1) | Nanoparticles mass (mg) | IE (%) | LC (%) |
| CS/G1-PA1 | 50 | 10 | 31.5 | 1.52 |
| CS/G1-PA2 | 100 | 10 | 46.3 | 4.65 |
| CS/G1-PA3 | 150 | 10 | 49.3 | 7.16 |
| CS/G1-PA4 | 150 | 15 | 60.9 | 5.78 |
| CS/G1-PA5 | 150 | 20 | 66.1 | 4.70 |
| CS/CL1-PA1 | 50 | 10 | 29.0 | 1.45 |
| CS/CL1-PA2 | 100 | 10 | 38.3 | 3.77 |
| CS/CL1-PA3 | 150 | 10 | 42.6 | 6.45 |
| CS/CL1-PA4 | 150 | 15 | 47.5 | 4.70 |
| CS/CL1-PA5 | 150 | 20 | 50.7 | 3.76 |
When the behavior of the particles is compared at similar loading conditions, CS/G nanoparticles present higher IE and higher LC than CS/CL nanoparticles. Since the pKa of PA is 0.42 (Y. G. Khabarov et al, 2017), PA in aqueous solution will tend to dissociate forming the picrate anion. The positive charged amino groups in CS can interact with picrate, allowing the incorporation of the drug into the nanosystem 38.
Even though the particles had little zeta potential, the surface charge is so important to predict the interaction with PA. Since CS/G1 presented a positive potential zeta and CS/CL1 presented a negative zeta potential, the number of amino groups positively charged is higher in CS/G1 than in CS/CL1, therefore CS/G1 nanoparticles are able to incorporate more PA than CS/CL1 nanoparticles 46.
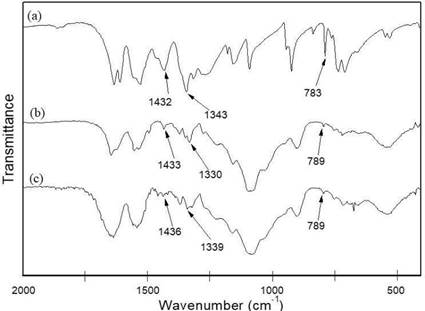
Figure 5 shows the FTIR spectra of PA, CS/G1-PA3 and CS/CL1-PA3. In the PA spectrum (Figure 5a) the bands at 1432 cm-1 and 1343 cm-1 are associated with the asymmetric and symmetric stretching of the C- N bond from the nitro group (-NO2), respectively. The band at 783 cm-1 was attributed to C-H out of the plane bending vibration 47.
The spectra of CS/G1-PA3 and CS/CL1-PA3 are similar to the spectra of the non-loaded nanoparticles (Figure 3), however present additional bands related to the presence of PA. These bands appear at 1433 cm- 1 and 1330 cm-1 for CS/G1-PA3 and at 1436 cm-1 and 1339 cm-1 for CS/CL1-PA3 47. The shift in the bands in comparison to the band at 1343 cm-1 (PA only) suggests the formation of hydrogen bonds between the nitro group of PA and the polymeric matrix. This behavior was reported by other works and it was used in the elaboration of chitosan films used as selective sensors of picric acid 23,24. Moreover, a low intensity band at 789 cm-1 was observed in the PA-loaded nanoparticles corresponding to the bending vibration of the C-H bond. Thus, picric acid was efficiently incorporated into the nanoparticles.
In vitro PA release
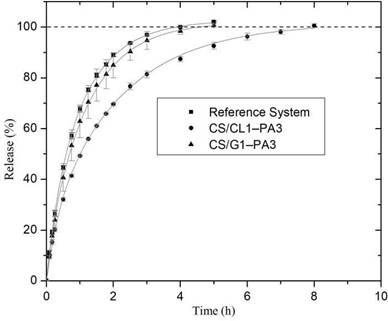
Figure 6 shows the PA percentage release from nanoparticles CS/G1-PA3 and CS/CL1- PA3 in function of time. Nanoparticles were compared with RS, which describes the picric acid release from the dialysis bag, without any polymeric particle. In the first hour, PA burst releases of about 63 % and 50 % for CS/G1-PA3 and CS/CL1-PA3 were observed, respectively. It represents a quick release of PA adsorbed on the particle surface. In the next 3 hours, the release rate of PA in CS/G1-PA3 particles decreased gradually, this phenomenon ends when the particles release around 100 % of PA at the buffer medium. In the case of CS/CL1-PA3, the same behavior in release rate was found; however, the required time for total release was 8 hours. It suggests that the PA release kinetic in chitosan/collagen particles shows an important delay, which could be originated by the influence of the release kinetic of inside PA; another possible effect to be considered is the influence of collagen structure.
When the PA percentage release of both nanoparticles is compared at the same time, chitosan/collagen nanoparticles release less quantity of PA than chitosan/gelatin nanoparticles. It means that the matrix prepared with gelatin (CS/G1) did not alter significantly the PA release kinetic, while that matrix prepared with collagen (CS/CL1) delays the PA release. This phenomenon could be considered as the possible interaction between the PA and the collagen. The triple helix structure of the collagen might trap PA molecules inside, as a result, it takes more time to reach the solution. This effect was suggested and studied by previous works with other molecules like 10-methacryloxy decamethylene phosphoric acid 48; another study showed the use of a collagen-base polymeric complex to adsorb contaminants, including the p-nitrophenol, through an interaction between them. The p-nitrophenol has similar functional groups as the picric acid49.
Kinetic models
The difference factor (f1) was calculated from the release curve of picric acid in CS/G1- PA3 and CS/CL1-PA3 and plotted as a function of time (Figure. 7). If the difference factor is lower than 15, the point of the curve is considered similar to the reference system
27.
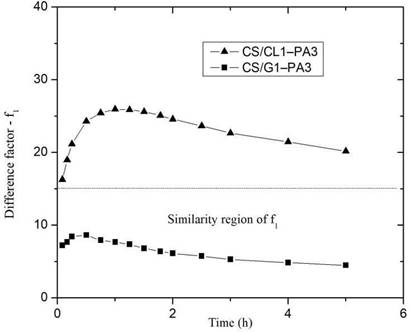
Figure 8 shows the behavior of the similarity factor (f2), calculated from the release curve for each point in time for CS/G1-PA3 and CS/CL1-PA3 nanoparticles. When the similarity factor is greater than 50, the system is considered similar to RS 27. The systems CS/G1-PA3 and CS/CL1-PA3 are considered similar to RS in the interval 0-0.5 hour. After 0.5 hour, the similarity factor (f2) of both curves is lower than 50, that means that the release curves were different to the RS. Despite the difference factors and similarity factors curves showed different behavior for CS/G nanoparticles, CS/CL nanoparticles showed concordance with those analyses. That means that nanoparticles with gelatin could not retain enough PA. In contrast, collagen showed an appreciable difference in the release curve, maybe due to the influence of collagen’s structure. This could enlist the collagen as a promising polymer to store PA in this matrix.
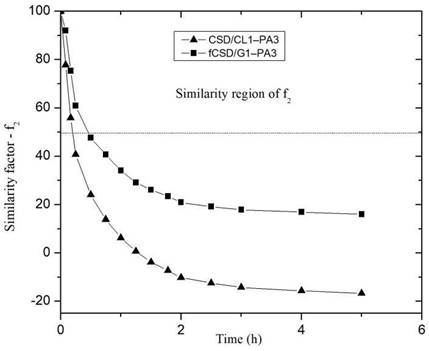
Table 5 shows the obtained parameters in dependent models; the correlation coefficients indicate a good approximation for these mathematical models.
The obtained values of kinetic constant give an idea of the behavior of release rate. According to the first order kinetic model, CS/G1-PA3 presents a lower value of kinetic constant than CS/CL1-PA3, which indicates that chitosan/gelatin system takes less time in the PA release than the chitosan/collagen system. In the same way, the Korsmeyer- Peppas kinetic constant in CS/G1-PA3 has higher value than CS/CL1-PA3, it supports the hypothesis that the time invested in PA release of chitosan/collagen nanoparticle was higher than the chitosan/gelatin nanoparticle. These behaviors were previously described in the results of the independent models.
Table 5 Results of dependents kinetics model
| Kinetic Model | CS/G1-PA3 | CS/CL1-PA3 | |
| First order | Kinetic constant (K1) | -0.4109 | -0.2397 |
| Correlation coefficient | 0.9987 | 0.9942 | |
| Korsmey er-Peppas | Kinetic constant (a) | 0.6531 | 0.4890 |
| Diffusion constant (n) | 0.7301 | 0.6523 | |
| Correlation coefficient | 0.9983 | 0.9981 | |
The first order kinetic model indicates that the rate of PA release in PBS pH 7.4 depends on the remaining quantity in the system. In the Korsmeyer-Peppas model, the diffusion constant (n) indicates the release mechanism. CS/G1-PA3 and CS/CL1-PA3 showed diffusion constant values (n) of 0.7301 and 0.6523, respectively. These results indicated that the systems follow an anomalous diffusion mechanism or non-fickian diffusion mechanism. That means that the release process is controlled by a mechanism of chain relaxing and diffusion 28. The same behavior was found in Levocetirizine Dihydrochloride release in chitosan nanoparticles 50.
CONCLUSION
Chitosan/gelatin nanoparticles and chitosan/collagen nanoparticles have been prepared for drug release application. Chitosan/gelatin and chitosan/collagen systems with less quantity of protein presented lower size than systems with more quantity of protein. Nanoparticle average size in CS/G1 and CS/CL1 was 236.9 nm and 251.9 nm, respectively. Zeta potential in CS/G1 and CS/CL1 was +15.7 mV and -3.8 mV, respectively, which suggests the influence of the proteins in the superficial charge. Assays of PA incorporation showed a maximum value of loaded content of 7.16 % and 6.45% for CS/G1-PA3 and CS/CL1-PA3 respectively. Complete drug release was reached in 4 hours for CS/G1-PA3 and 8 hours for CS/CL1-PA3.
The PA release from both nanoparticles were evaluated through kinetic models and suggest that gelatin did not interact significantly with the PA, while the presence of collagen delay the PA release. The Korsmeyer-Peppas model suggests that the release process is carried out though an anomalous diffusion mechanism. Although chitosan/gelatin nanoparticles presented slightly higher incorporation efficiency and loaded content than chitosan/collagen nanoparticles, the later exhibited an adequate drug release profile. Then, chitosan/collagen nanoparticles offer interesting characteristics to be considered as a promising nanocarrier for future drug delivery applications.

