


Servicios Personalizados
Revista

Articulo
 texto en
  Inglés (pdf)
 Articulo en XML
 Referencias del artículo
 Enviar articulo por email
Indicadores
-
 Citado por SciELO
Links relacionados
-
 Similares en
SciELO
Similares en
SciELO
Compartir

 Permalink
Industrial Data
versión impresa ISSN 1560-9146versión On-line ISSN 1810-9993
Ind. data vol.24 no.1 Lima ene./jun 2021
http://dx.doi.org/10.15381/idata.v24i1.19616
Design and Technology
Influence of the Redesign of the Production Processes of a Flexible Packaging Company Based on Continuous Improvement

1 Industrial engineer from Universidad Alas Peruanas. Currently working as an independent consultant. (Lima, Peru). alizaldeamolina@gmail.com
The company under study aimed to reduce the scrap rates of each process of flexible packaging manufacturing, originated as a result of poor procedures, returned products, and observed spools and/or bales. A reduction in claims was also expected as a result of the improvement in the quality of the finished product. The reduction of scrap in each process of the plastics division led to a reduction in reprocessing and costs. This, in turn, had a positive impact on the company’s income as the provision of high quality products resulted in customer loyalty. Furthermore, processes in the areas of extrusion, printing, cutting, laminating and sealing were made more efficient. The standardization of procedures and processes improved their execution time, creating a more positive image for customers and competitors.
Key words: procedures; reprocessing; customer; claims
INTRODUCTION
This research is intended to serve as a basis for cutting-edge, academic or socially useful research that will benefit:
Researchers, students and people interested in the continuous improvement of processes, since the most relevant aspects are emphasized.
Shareholders and collaborators of the company, since better profit margins are obtained.
Customers, since a low rate of non-conforming products is observed.
Competitors, since improvements are recommended to reduce scrap.
This article is intended to be an evaluation tool that provides understanding of the factors that influence the generation of scrap and its consequences, as well as the behavioral pattern of these factors. For all interested parties, this work is a research proposal to obtain efficient processes that generate low scrap rates.
This research also describes the redesign of the processes based on continuous improvement, via the evaluation and execution of:
Production Self-Inspection Plan
Root Cause Analysis (RCA) for non-conforming products
Corrective actions
Moreover, it aims to identify how the scrap rates generated in the processes of the plastics production division can be reduced based on the development of a self-inspection plan for each process.
BACKGROUND
Fernández and Ramirez (2017) developed an improvement method for process management to increase productivity, very similar to the one developed in this paper.
Cáceres (2017) observed that continuous improvement optimized the processes in an electronic products warehouse and, thus, increased its productivity.
Gutiérrez and Vega (2019) draw up an improvement plan in the production area to increase productivity and concluded that the standardization of procedures is essential for the development of an improvement plan.
Efficiency
According to De Asís (2007), efficiency implies the optimal use of resources to avoid wasting them. Based on this statement, the efficiency of a company, product or person depends on their ability to obtain optimal results while minimizing the economic impact of resources. Consequently, the company’s manager must have a detailed understanding of the processes involved in the organization and must also implement strategic improvement
Continuous Improvement
Chang (1996) provides a methodical guide for significant improvements in the manufacturing processes that provide products and services to customers. Continuous improvement involves closely observing processes and finding ways to improve them. The aim is to obtain faster results, noticeable improvement and a more efficient or effective way to provide a service or product.
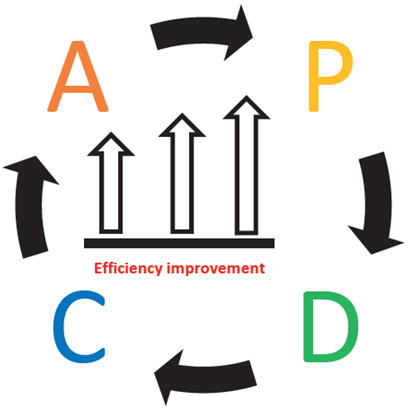
Continuous process improvement is the creation of methodologies (procedures, monitoring, performance measurements, etc.) that focus on the continuous examination of the problems that arise in the organization; it also aims to optimize the product or service provided by the organization, resulting in customer satisfaction, cost reduction and resource streamlining.
Figure 1 graphically illustrates the concept described in the preceding paragraph.
Production
According to D’Alessio (2004), production encompasses the planning, design, operation and control of the systems that produce goods and services. It also includes a wide range of production processes that add value to the product or service. Everett and Ronald (1991) state that production involves the transformation of inputs or raw materials into a product. The authors agree that production involves the development of goods or activities comprising a set of tangible or intangible functions to satisfy the customer. They also emphasize the interconnection of the phases of production required to obtain the good or service.
Production is the result of activities where a good or service is obtained and, to that end, each process carried out adds value.
Processes
Martín and Martín (2013) state that processes are the set of activities that manage inputs and outputs. Mapping, defining and controlling the processes provides insight into the activities developed within the organization and, therefore, the opportunity to further implement continuous improvement. There are inputs and outputs in the process. Inputs are the supplies or raw materials relevant to the elaboration of the activities that make up the process; whereas the outputs are made up of the product and the wastes that are produced. Additionally, they reveal the importance of process control in the optimization of the organization’s activities.
For García (1998), a process originates from a known initial situation intended to culminate in an also known situation, but a number of barriers or obstacles are encountered along the way, which must be addressed by performing specific operations. The author emphasizes that between the beginning and the end of the process, unforeseen events arise that must be examined and mitigated; all process activities must be identified and known, for only then will the necessary procedures for their inspection be determined, making it crucial for the analyst to be familiar with the processes involved.
According to Alarcón (1998), a process is a group of activities that, using inputs, creates a product of value for the customer. These activities are interrelated and end with the delivery of the product or service.
In the preceding paragraph it is stressed that the activities to obtain a product or service must be closely interconnected and related in order to provide the added value required at each stage of its production.
In turn, Chiavenato and Sapiro (2011) state that processes are the means by which results are obtained. They are sets of activities that use resources to transform materials or raw materials into products. It is worth noting that process management creates a dynamic of continuous improvement for organizations to obtain significant gains in terms of performance, efficiency, effectiveness and cost.
In the above statement, mention is made of the outputs or results of the sets of activities; inputs are used to obtain these results. Process management is also mentioned and how it is aimed at creating a culture of process optimization for better organizational productivity.
Similarly, Pérez (2010) states that a process is a set of interrelated activities that transform inputs into value-added outputs. The author also states that processes are orderly sequences of repetitive activities whose product has important values for customers. Figure 2 illustrates this concept.
Processes must have a sequence of tasks that interact in a specific fashion; furthermore, this set of tasks results in the execution of the activities necessary to obtain a final product that meets the requirements of the customer.
Process Redesign
Alarcón (1998) states that a basic and deep understanding of the processes that provide added value in the eyes of customers is fundamental to completely redesign the processes and to significantly modify them in order to obtain drastic improvements in cost, quality, service, productivity, speed, etc. In addition, the purpose of the work and the structures of the company change at the same time, thus making it possible to determine the suitability of the implementation of new corporate strategies.
Process redesign can only be accomplished with a thorough understanding of all activities that are essential for production; such a change may, but need not necessarily, require a large investment, however, the long-term benefits are greater than the investment.
Process redesign is explained simply and graphically in Figure 3.

METHODOLOGY
A time series quasi-experimental research design was used, as several observations were made on one or more variables at pre-test and post-test. The scheme used is presented below:
O1 O2 O3 X O4 O5 O6
Where:
O: are the observations made at pre-test and post-test.
X: is the implementation of the independent variable.
A quantitative and experimental approach is used because data will be collected to test the hypothesis, relying on the measurement of variables and the manipulation of an independent variable.
The units of analysis will be the production orders (PO) of the company under study and the statistical reports obtained from the historical data, considering 2014 as pre-test and 2019 as post-test phases for each of the processes.
Process redesign based on continuous improvement was conducted via the evaluation and execution of:
Root Cause Analysis (RCA) for non-conforming products.- Causes of production defects in each process (extrusion, printing, laminating, cutting and sealing) were defined in conjunction with the area managers and/or shift supervisors (former senior machinists).
Corrective actions.- Corrective actions were designed to deal with the sources of the constant defects causing the increase in scrap rates. Corrective actions were needed for machinery, methods, labor, materials, etc.
Production Self-Inspection Plan.- A list of defects that may appear in each process was compiled, and the employees were trained according to their work areas. Also, it was decided that the frequency of trainings should be every three months.
Together with the systems area, the observed product module was developed and the internal returns module was improved in order to allow employees to register in the company’s ERP the kilograms of defective production; thus, scrap percentages were accurately calculated.
Reports on the amount of scrap for each process were then analyzed. The annual scrap percentage was calculated using the following formula:
Annual scrap percentage

Note: The formula was also applied to the other processes. Chancaca3was only considered for the extrusion process.
Table 1 shows the POs by process in the pre-test and post-test phases.

The research hypothesis is stated below:
“Scrap rates will be reduced through the development of a production self-inspection plan for each process.”
Scrap rates represent the variable of this hypothesis, where the indicator to be analyzed in the processes of the company under study (extrusion, printing, cutting, laminating and sealing) is scrap percentage.
The statistical hypotheses valid for the extrusion, printing, cutting, laminating and sealing processes are set out below:
H0: π1 = π1
H1: π1 > π1
α: 0.05
RESULTS
Extrusion Process
Extrusion scrap rates are presented below in Table 2.
Table 2 Extrusion Scrap Rates.
| Year | Kg of production per process | Kg of scrap per process | Chancaca | Annual scrap % | No. of POs |
|---|---|---|---|---|---|
| 2014 (pre-test) | 14 360 612.30 | 511 085 | 21 062.30 | 3.43% | 3231 |
| 2019 (post-test) | 9 911 682.92 | 348 667.20 | 17 594.20 | 3.39% | 3380 |
Source: Prepared by the author.
A Z-test of proportions in R was used for the hypothesis testing. The following result was obtained:
1-sample proportions test with continuity correction
Data: 348667 de 10277944, null probability 0.0343
X-squared = 43901, df = 1, p-value = 1.727e-11
Alternative hypothesis: true p is less than 0.0343
95 percent confidence interval: 0.00000000 0.03401686
Sample estimates: p 0.03392381
Based on the p-value of 1.727e-11, the null hypothesis H0 is rejected and H1, that states that the scrap percentage from the extrusion process has been reduced is accepted.
Printing Process
Printing scrap rates are presented in Table 3.
Table 3 Printing Scrap Rates.
| Year | Kg of production per process | Scrap per process | Annual scrap % | No. of POs |
|---|---|---|---|---|
| 2014 (pre-test) | 11 385 732.43 | 312 832.60 | 2.67% | 3.182 |
| 2019 (post-test) | 7 972 305.47 | 229 209.72 | 2.79% | 3.054 |
Source: Prepared by the author.
A Z-test of proportions in R was used for the hypothesis testing. The following result was obtained:
1-sample proportions test with continuity correction
Data: 229219 de 8201515, probability 0.0267
X-squared = 491.79, df = 1,p-value = 1
Alternative hypothesis: truepis less than 0.0267
95 percent confidence interval: 0.00000000 0.02804326
Sample estimates: p0.02794837
Based on the p-value of 1, then null hypothesis H0 is accepted.
Laminating Process
Laminating scrap rates are presented in Table 4.
Table 4 Laminating Scrap Rates.
| Year | Kg of production per process | Scrap per process | Annual scrap % | No. of POs |
|---|---|---|---|---|
| 2014 (pre-test) | 2 126 579.89 | 19 902.50 | 0.93% | 929 |
| 2019 (post-test) | 2 003 680.43 | 8 767.52 | 0.44% | 771 |
Source: Prepared by the author.
A Z-test of proportions in R was used for the hypothesis testing. The following result was obtained:
1-sample proportions test with continuity correction
Data: 8768 de 2012448, null probability 0.0093
X-squared = 5336.5, df = 1, p-value < 2.2e-16
Alternative hypothesis: true p is less than 0.0093
95 percent confidence interval: 0.000000000 0.004434169
Sample estimates: p 0.004356883
Based on the p-value of 2.2e-16, the null hypothesis H0 is rejected and H1, that states that the scrap percentage from the laminating process has been reduced is accepted.
Cutting Process
Cuting scrap rates are presented in Table 5.
Table 5 Cutting Scrap Rates.
| Year | Kg of production per process | Scrap per process | Annual scrap % | No. of POs |
|---|---|---|---|---|
| 2014 (pre-test) | 3 765 802.30 | 58 440 | 1.53% | 1775 |
| 2019 (post-test) | 3 096 874.58 | 55 757.31 | 1.77% | 1689 |
Source: Prepared by the author.
A Z-test of proportions in R was used for the hypothesis testing. The following result was obtained:
1-sample proportions test with continuity correction
Data: 55757 de 3152633, null probability 0.0153
X-squared = 1191, df = 1, p-value = 1
Alternative hypothesis: truepis less than 0.0153
95 percent confidence interval: 0.00000000 0.01780853
Sample estimates: p 0.01768585
Based on the p-value of 1, then null hypothesis H0 is accepted.
Sealing Process
Sealing scrap rates are presented in Table 6.
Table 6 Sealing Scrap Rates.
| Year | Kg of production per process | Scrap per process | Annual scrap % | No. of POs |
|---|---|---|---|---|
| 2014 (pre-test) | 7 682 209.69 | 221 166.60 | 2.80% | 1704 |
| 2019 (post-test) | 5 171 234.00 | 97 649.80 | 1.85% | 3380 |
Source: Prepared by the author.
A Z-test of proportions in R was used for the hypothesis testing. The following result was obtained:
1-sample proportions test with continuity correction
Data: 97649.8 de 5268884, null probability 0.028
X-squared = 17349, df = 1, p-value < 2.2e-16
Alternative hypothesis: true p is less than 0.028
95 percent confidence interval: 0.00000000 0.01863029
Sample estimates: p 0.0185333
Based on thep-value of 2.2e-16, the null hypothesis H0 is rejected and H1, that states that the scrap percentage from the sealing process has been reduced is accepted.
DISCUSSION
The scrap rates generated during the production process were due to the lack of control, in most cases human-caused. The lack of awareness of defects during production resulted in a considerable amount of intermediate product with defects. The development of a production self-inspection plan for each of the processes reduced the monthly scrap rates.
No scrap reduction was observed in the printing and cutting processes due to the high turnover of personnel in these areas. The company should consider reducing the frequency of training and reinforcing the induction process.
In terms of the hypothesis, the results obtained are similar to those obtained by Cáceres (2017), and Fernández and Ramírez (2017), as they propose a plan for improvement, redesign and optimization of processes. The improvements obtained in the implementation of these plans in their respective scenarios are verified in all the mentioned cases.
CONCLUSIONS
1. A decrease in scrap is evidenced in the extrusion, laminating and sealing processes, whereas in the printing and cutting processes this hypothesis is rejected.
2. The printing and cutting process failed to reduce process scrap due to the high personnel turnover and lack of adequate induction upon joining the company.
3. A comprehensive analysis should be carried out to reduce the scrap percentages in the printing and cutting processes.
4. Staff members involved in the execution of the mentioned processes were briefed on the list of defects for each of the processes and trained to recognize them in the course of the processes.
5. The continuous improvement of the processes for the reduction of scrap allowed time optimization, as several unnecessary reprocesses of defective production were eliminated; it also resulted in cost reduction.
6. Several procedures were developed during the determination of process control and control sheets.
REFERENCIAS BIBLIOGRÁFICAS
[1] Alarcón, J. (1998).Reingeniería de procesos empresariales: teoría y práctica de la reingeniería de la empresa a través de su estrategia, sus procesos y sus valores corporativos. Madrid, España: Fundación Confemetal. [ Links ]
[2] Cáceres, A. (2017).Aplicación de la mejora continua y su efecto en la productividad de los procesos del almacén de una empresa comercializadora de productos electrónicos en Lima Metropolitana. (Tesis de maestría). Universidad Ricardo Palma, Lima. [ Links ]
[3] Chang, R. (1996). Mejora continua de procesos: Guía práctica para mejorar procesos y lograr resultados medibles(1ª ed.). Barcelona, España: Ediciones Granica. [ Links ]
[4] Chiavenato, I., y Sapiro, A. (2011).Planeación estratégica. Fundamentos y aplicaciones(2ª ed.). México D.F., México: McGraw-Hill Education. [ Links ]
[5] D’Alessio, F. (2004).Administración y dirección de la producción. Naucalpan de Juárez, México: Pearson Educación. [ Links ]
[6] De Asís, M. (2007).Análisis de eficiencia de los departamentos universitarios.El caso de la universidad de Sevilla. Madrid, España: Editorial Dykinson S.L. [ Links ]
[7] Everett, A., y Ronald, E. (1991).Administración de la producción y operaciones. México: Prentice-Hall. [ Links ]
[8] Fernández, A., y Ramírez, L. (2017).Propuesta de un plan de mejoras, basado en gestión por procesos, para incrementar la productividad en la empresa distribuciones A & B. (Tesis de pregrado). Universidad Señor de Sipán, Pimentel. [ Links ]
[9] García, A. (1998).Conceptos de organización industrial .Barcelona, España: Marcombo S.A. [ Links ]
[10] Gutiérrez E., y Vega S. (2019).Plan de mejora para incrementar la productividad en el área de producción de la empresa JOSATEX. (Tesis de pregrado). Universidad Señor de Sipán, Pimentel. [ Links ]
[11] Hammer, M., y Champy, J. (1994).Reingeniería: Olvide lo que usted sabe sobre cómo debe funcionar una empresa: ¡Casi todo está errado!(1ª ed.) Bogotá, Colombia: Norma. [ Links ]
[12] Lynch, R., y Cross, K. (1993)La mejora continua: Patrones y medidas, (1ª ed.). Bilbao, España: Editorial Deusto. [ Links ]
[13] Martín, S., y Martín, S. P. (2013).La excelencia operativa en la Administración Pública. Madrid, España: Instituto Nacional de Administración Pública. [ Links ]
[14] Pérez, J. (2010).Gestión por Procesos(4ª ed.). México: Alfaomega grupo editor, S.A. de C.V. [ Links ]
[15] Socconini, L. (2014).Lean Company: Más allá de la manufactura(1ª ed.). México D.F., México: Norma Ediciones. [ Links ]
Received: December 12, 2020; Accepted: April 13, 2021
 Este es un artículo publicado en acceso abierto bajo una licencia Creative Commons
