


Servicios Personalizados
Revista

Articulo
 texto en
  Inglés (pdf)
 Articulo en XML
 Referencias del artículo
 Enviar articulo por email
Indicadores
-
 Citado por SciELO
Links relacionados
-
 Similares en
SciELO
Similares en
SciELO
Compartir

 Permalink
Industrial Data
versión impresa ISSN 1560-9146versión On-line ISSN 1810-9993
Ind. data vol.24 no.1 Lima ene./jun 2021
http://dx.doi.org/10.15381/idata.v24i1.17749
Production and Management
Evaluation of the Student Satisfaction Level Regarding the Educational Service Under the Approach of the HEdPERF Model at Public Universities that Belong to the Strategic Alliance of Peruvian Universities and that Implemented the Licensing Mechanism1

2 Degree in Science with a major in Business Management Engineering from Universidad Nacional Agraria La Molina, and specialist in Public Investment Project Management. Currently working as independent consultant (Lima, Peru). carolinaalvareztay@gmail.com
The objective of this article was to establish the level of influence that the HEdPERF (Higher Education Performance) model has on student satisfaction, to establish the degree of influence that each of the six dimensions that make up the HEdPERF model have on student satisfaction, and to determine which of the six dimensions of the HEdPERF model presented an adequate level of perceived quality. The study sample consisted of 1191 students belonging to the three public universities that are members of the Alianza Estratégica de la Universidad Peruana (Strategic Alliance of Peruvian Universities). The research was non-experimental, at a correlational level, and non-parametric statistical tests were used for data analysis, such as the chi-square test, Spearman’s correlation test and the Wilcoxon signed-rank test.
Key words: service quality; higher education; HEdPERF model; service quality assurance and student satisfaction
INTRODUCTION
In its Report on Higher Education in Latin America and the Caribbean 2000-2005, the International Institute for Higher Education in Latin America and the Caribbean (IESALC) mention that, under the discourse of defending the autonomy of universities and before the total discrediting of the State as an effective provider of public services, it was decided that the students (clients) would assume responsibility for selecting the best educational options and that, in turn, the salaries of the graduates would be sanctioned by the market according to the value attributed to their degrees and institutions of origin (Instituto Internacional para la Educación Superior en América Latina y el Caribe, 2015).
In addition to this, Peru experienced a process of rapid increase of university enrollments during the last two decades, which, according to the Dirección General de Educación Superior Universitaria (General Directorate for Universities), was reflected in the figures from 1996 to 2012, where the growth rate was 2.5 times more than the previous years, as a result of the creation of 82 new universities (23 public and 59 private). This increase, added to little or almost no planning and the absence of sectoral policies for quality assurance, led the Peruvian State to recognize at the time thatla educación superior universitaria no forma ciudadanos con altas capacidades para el ejercicio profesional competente y la producción de conocimiento de alto valor social[universities do not form citizens with high capacities for competent professional practice and the production of knowledge of high social value] (D.S. No. 016-2015-MINEDU, 2015).
Hence, the Peruvian State-faced with the urgent need to reform the university education system during the last decade (2009-2019)-, through the Ministry of Education and its attached public agencies, has deployed efforts through various mechanisms as a guarantee of educational quality whose center is the student (D.S. No. 016-2015-MINEDU, 2015); the most important are institutional licensing, accreditation of study programs and universities, and professional certification; the first being mandatory and the remaining two mechanisms, voluntary.
In this regard, the public universities that are members of the Strategic Alliance of Peruvian Universities3 obtained their institutional licensing for up to ten years, which came into effect from the date of issuance in the following chronological order: Universidad Nacional Agraria La Molina (UNALM) in March 2017 through Resolución del Consejo Directivo No. 011-2017-SUNEDU/CD (2017); Universidad Nacional de Ingeniería (UNI) in November 2017 through Resolución del Consejo Directivo No. 073-2017-SUNEDU/CD (2017); and Universidad Nacional Mayor de San Marcos (UNMSM) in April 2018 through Resolución del Consejo Directivo No. 036-2018-SUNEDU/CD (2018). From the above, it is concluded that as of the date of this research, a period of time of approximately 2 to 3 years has elapsed since these universities obtained their licensing, a mechanism that evaluates Basic Quality Conditions (CBC, by its Spanish acronym).
In this sense, the problems that this research seeks to solve are stated below in the form of questions: (1) to what extent does the application of the HEdPERF (Higher Education Performance) Model, focused on the perceived quality of educational services, significantly influence student satisfaction?, (2) to what extent does each of the dimensions that make up the HEdPERF model significantly influence student satisfaction? and (3) which of the evaluated dimensions of the HEdPERF model present an adequate level of perceived quality? Hence, the objectives of this article are expressed as follows: (1) to establish the level of influence of the HEdPERF model, focused on the perceived quality of services, on student satisfaction, (2) to establish the degree of influence of each of the six dimensions that compose the HEdPERF model on student satisfaction, and (3) to determine which of the six evaluated dimensions of the HEdPERF model present an adequate level of perceived quality.
The hypotheses of this work were formulated taking as a frame of reference the problems and objectives presented above; they are shown in detail below: (1) the perceived quality of the educational services of the HEdPERF model significantly influences student satisfaction, (2) the six dimensions that constitute the HEdPERF model significantly influence student satisfaction, and (3) the dimensions that constitute the HEdPERF model present an adequate level of perceived quality. Additionally, these hypotheses were contrasted with each of the public universities included in this research in order to compare them.
The main contribution that this article intends to make is directed towards the parties that constitute the Peruvian university education system, that is, students, those responsible for verifying compliance with all the Basic Quality Conditions (CBC), and the university authorities in charge of making academic and non-academic decisions, through the presentation, in qualitative and quantitative terms, of the perceived quality of educational services under the HEdPERF model approach and its degree of influence on student satisfaction. Additionally, the contribution of this study as new knowledge lies in the adaptation from English to Spanish of the HEdPERF model scale and its application to the reality of the public universities that are members of the Strategic Alliance of Peruvian Universities that have implemented the institutional licensing mechanism.
This study is based on the work of the following authors: Abdullah (2006), who states that the assessment of the quality level, as well as the understanding of how the different dimensions affect the overall quality of the educational service, will enable higher education institutions to efficiently design the service delivery process; Sunanto et al. (2007), who suggest that institutions should view students as their main customers and try to maximize their satisfaction based on the educational services provided; Spilimbergo (2009), who argues that the ability of universities to promote a quality institutional framework-by providing an environment conducive to democratic dialogue and exchange of ideas-allows for comprehensive training that includes the development of values and interpersonal skills that translate into greater social cohesion and democratic strengthening; Zineldin and Vasicheva (2014), who point out that measuring student perceptions of the quality of service offered by a university can reflect the overall student satisfaction level within the institution; Govender et al. (2014), who indicate that providing quality services is key for higher education institutions to differentiate themselves from their competitors and to ensure sustainability over a long time period; and finally, Nadim and Al Hinai (2016), who mention that quality in higher education institutions is one of the most significant aspects of knowledge creation, human resource development and social strength of any country.
In reference to other studies related to this article, researchers Abu et al. (2008) state that there is a strong positive relationship between perceived quality and student satisfaction; added to this, Gallifa and Batallé (2010) confirm that if the provision of educational services is not dynamic, with the passage of time the service is perceived as one of low quality; on the other hand, the authors Silva et al. (2017) systematically reviewed academic literature to evaluate the relevance of the HEdPERF model as a scale to measure service quality perceived by students in higher education institutions at an international level, and concluded that it is not appropriate to use a generic scale for all services, but a specific scale to quantitatively estimate the quality perceived in each one.
Finally, the theoretical framework that supports this research is structured in three main axes, as follows:
Quality management models applied to university-related institutions, for which a review of other similar articles was carried out, finding among the most outstanding models: (i) Total Quality Management (TQM) model, which is defined as a system of guarantees that was created to accommodate multiple stakeholders, as well as the diverse and changing roles of students in the educational process (Murad & Shastri, 2010); (ii) Balanced Scorecard (BSC), which is a simple, logical, practical and verified management system, which allows an adequate response to modern challenges faced by higher education institutions (Eftimov et al., 2016); (iii) European Foundation for Quality Management (EFQM) model, described as a systematic evaluation carried out by an organization in all its areas, comparing them with a model of excellence that serves as a reference; this would allow top management to set improvement plans based on objective facts and a common vision of the goals to be achieved and the means to be employed (Del Campo et al., 2013); (iv) ISO 9001:2015, since, in a context of increasing enrollment rates, changing structure of society, different types of delivery of educational programs and large-scale of job descriptions, the application of this standard is of great importance, as it provides a set of generic requirements for implementing a quality management system without regard to the activities performed by the organization (Hussein et al., 2017); (v) ISO 21001:2018, which mainly focuses on the critical and continuous evaluation of educational organizations in order to assess the degree of compliance with the requirements of students and other beneficiaries, so the global performance of the organization can be improved (Organización Internacional de Normalización, 2018); and (vi)modelo de sistema integrado de aseguramiento de calidad(comprehensive quality assurance system model), which is considered a good international practice and consists of the following elements: licensing, accreditation, academic auditing and information systems (Pontificia Universidad Católica de Chile, 2011). After the analysis of the aforementioned models, the comprehensive quality assurance system model was identified as the model that most resembles the Peruvian university context as a guarantee of educational quality.
Models used to study the quality of the university educational service. A thorough review of the academic literature on the main models used in university context was made, these included: (i) Net Promoter Score (NPS) model, which, according to authors Schmatz et al. (2015), consists of a question (the last question of the survey) that completely avoids terms such as “satisfaction” or “quality” and rather addresses something that goes even beyond customer satisfaction: loyalty (the willingness to make an investment or a personal sacrifice to strengthen a relationship), which allows predicting the actual behavior of customers; (ii) Kano model, defined by authors Arefi et al. (2012) as a tool widely used to perceive the voice of the customer in order to influence their own satisfaction; this model classifies the customer requirements in 6 categories: attractive elements, one-dimensional elements, must-be elements, indifferent elements, reverse elements and questionable elements; (iii) SERVQUAL model, conceptualized by authors Cañón and Rubio (2018) as a multiple response scale designed to understand customer expectations regarding a service received, through the evaluation of five dimensions: tangibility, reliability, responsiveness, assurance and empathy; (iv) SERVPERF model, which, according to authors Maldonado and Moreta (2018), focuses on customer perceptions of the service they receive, suppressing expectations, and which also provides diversity and variability according to the appropriate customer service; and (v) HEdPERF model, defined by its creator and author Abdullah (2005) as a scale that measures perceived quality specifically in the higher education sector, which is composed of 6 dimensions and 41 questions. In view of the above and appealing to the criteria of convenience and relevance for the present research, it was decided to apply the scale proposed by the HEdPERF model in the study.
Legal bases in the context of Peruvian university quality assurance, mainly comprised by: (1) The Nueva Ley Universitaria (Ley No. 30220, 2014), which implemented important changes such as the creation of the National Superintendence of Higher Education (SUNEDU), which is in charge of guaranteeing compliance with the Basic Quality Conditions (CBC) immersed in the institutional licensing process, and which specifies the accreditation process as voluntary with some exceptions; and (2) the Política de Aseguramiento de la Calidad de la Educación Superior Universitaria (Quality Assurance Policy for University), which establishes five principles (autonomy and responsible vice-chancellorship, student as the center, inclusion and equity, quality and academic excellence, and development of the country) and four pillars (reliable and timely information, encouragement to improve performance, accreditation for continuous improvement, and licensing as a guarantee of basic quality conditions) in the framework of the Peruvian university system.
METHODOLOGY
The research design was cross-sectional, non-experimental and correlational. It is described in detail below:
It is cross-sectional, that is, the data were collected at a single moment (academic period 2019 - II) and its purpose was to describe the variables and analyze their incidence and correlation at a given moment.
It is non-experimental, since the dependent variable (student satisfaction) in the study already occurred and it was not possible to manipulate it, that is, there was no direct control over that variable and its effects since they had already happened. By conducting a non-experimental research, the phenomenon was observed as it occurred in its natural context (public universities members of the Strategic Alliance of Peruvian Universities) for its subsequent analysis.
It is correlational, since the relationships between the independent variables (perceived quality of educational services and subvariables) and the dependent variable (student satisfaction) were described, and their dimension and direction were established.
The unit of analysis was composed of enrolled undergraduate and graduate students, who belonged to the campuses that concentrate the largest number of study programs in the three public universities that are members of the Strategic Alliance of Peruvian Universities (See Table 1).
Table 1 Location of the Universities Considered in the Study.
| University | Address | District |
|---|---|---|
| Universidad Nacional Mayor de San Marcos | Calle German Amezaga No. 375 | Cercado de Lima |
| Universidad Nacional Agraria La Molina | Avenida La Molina S/N | La Molina |
| Universidad Nacional de Ingeniería | Avenida Túpac Amaru No. 210 | Rímac |
Source: Prepared by the author.
The characteristics of the unit of analysis regarding gender were 66% male, 31% female and 3% other. Regarding the age range of the students, 14% were between 14 and 18 years old, 58% between 19 and 22 years old, 22% between 23 and 26 years old, and 6% between 27 and 58 years old. With respect to academic level, 96% were undergraduates and 4% were graduate students. In reference to the academic period, 54% stated that they were between the first and fourth cycle (first and second year), 33% were between the fifth and eighth cycle (third and fourth year) and 13% were between the ninth and twelfth cycle (fifth and sixth year). Finally, with respect to the areas of knowledge, 71% belonged to the area of Engineering, 13% to the area of Basic Sciences, 7% to the area of Humanities, Legal and Social Sciences, 6% to the area of Economics and Management Sciences, and 2% to the area of Health Sciences.
The total sample size of the research, as shown in Table 2, was 1191 enrolled students and this was calculated using the historical values of the number of students enrolled between 2014 and 2018 in order to project the average number of students to be enrolled in 2019; subsequently, the formula to calculate the sample size for a finite population was used, with a confidence level of 95%, and the following distribution was obtained for each university in the study:
Table 2 Sample Size of the Study.
| University | Population Size | Sample Size |
|---|---|---|
| Universidad Nacional Agraria La Molina | 13 159 | 384 |
| Universidad Nacional Mayor de San Marcos | 42 787 | 392 |
| Universidad Nacional de Ingeniería | 22 888 | 415 |
| Total | 78 834 | 1191 |
Source: Prepared by the author.
The sample was random and proportionally stratified, applying the latter criterion according to each university. Other criteria were also applied, such as those detailed below:
Exclusion criterion: Undergraduate and graduate students who were not enrolled in the 2019-II academic period or who were not located, during the field study, within the campuses with the largest student population in the three public universities that are members of the Strategic Alliance of Peruvian Universities.
Elimination criteria: The surveys of those students who did not complete any of the items of the instrument or who duplicated their response in any of the requested items or who had unusual response patterns, such as choosing the same alternative in almost all the items, were eliminated.
The data was collected through a survey within the framework of the HEdPERF model, which consisted of 41 questions (items) that were brief, concise, and easy to understand. For the analysis and interpretation of the data, the MINITAB version 17 and SPSS version 25 statistical analysis and processing software packages were used. Other complementary software programs were also used for the extraction and visualization (tables and graphs) of the data, such as Microsoft Excel and Microsoft Power Point 2016.
RESULTS
Table 3 shows in detail the description of the 6 dimensions proposed by the HEdPERF model, whose correct understanding allowed the interpretation of the results obtained in this study and facilitated the subsequent discussion of the implications of this article.
Table 3 Qualitative Description of the Dimensions of the HEdPERF Model.
| Dimension | Description |
|---|---|
| Academic aspects | Elements for which the teaching staff is fully responsible. |
| Non-academic aspects | Essential elements to allow that the student fulfills their study requirements. It refers to the tasks performed by the administrative staff. |
| Reputation | Elements that suggest the importance in higher education institutions of projecting a professional image. |
| Access | Elements related to accessibility, ease of contact, availability and convenience. |
| Programs | Elements that emphasize the importance of providing a wide range of highly reputable programs with flexible structures and study plans. |
| Understanding | Elements related to the specific understanding the needs of the students in terms of counseling and health. |
Source: Adapted from Silva et al. (2017).
As part of the preparatory acts to the application of the measurement instrument (survey) to the total sample, and to the contrast of the research hypotheses, a pilot test was developed with a subsample consisting of 53 students from the 3 public universities that are members of the Strategic Alliance of Peruvian Universities (17 from UNALM, 19 from UNI and 17 from UNMSM) with the purpose of evaluating the reliability and validity of the measurement instrument.
The internal consistency of the items that make up each of the 6 dimensions of the HEdPERF model scale confirmed that the survey was reliable since its dimensions obtained Cronbach’s alpha coefficients with values ranging between 0.780 and 0.924 (See Table 4).
Table 4 Results of Internal Consistency.
| Dimensions | Cronbach’s Alpha | Number of items | Criteria |
|---|---|---|---|
| Academic aspects | 0.893 | 9 | High reliability |
| Non-academic aspects | 0.924 | 12 | Excellent reliability |
| Reputation | 0.915 | 8 | Excellent reliability |
| Access | 0.868 | 7 | High reliability |
| Programs | 0.846 | 2 | High reliability |
| Understanding | 0.780 | 2 | High reliability |
Source: Prepared by the author.
The survey content was validated through the expert judgment technique. For this purpose, 3 university professors participated, these professors are specialists in the fields of psychometric test evaluation, postgraduate thesis evaluation and quality management of educational services. Consequently, the experts, through 5 evaluation criteria (congruence of the items, comprehensiveness of the content, wording of the items, clarity and precision, and relevance) expressed their opinions, which fluctuated between acceptable and excellent ratings (see Table 5), and gave the confidence to validate the content of the measurement instrument.
Table 5 Results According to the Evaluation Criteria by the Expert Participants.
| Congruence of the items | Comprehensiveness of the content | Wording of the items | Clarity and precision | Relevance | |
|---|---|---|---|---|---|
| Expert No. 01 | Excellent | Good | Good | Good | Excellent |
| Expert No. 02 | Good | Good | Good | Excellent | Good |
| Expert No. 03 | Acceptable | Acceptable | Acceptable | Acceptable | Acceptable |
Source: Prepared by the author.
Kolmogorov Smirnov (SPSS version 25) and Anderson Darling (Minitab version 17) normality tests were used to verify the assumption of normality of the distribution of the data of variables (a) perceived quality of the educational service and its subvariables (dimensions of the HEdPERF model) and (b) student satisfaction. It was concluded that these present non-normal distributions, since they have ap-value less than 0.05 (α value), with a confidence interval of 95% and, therefore, the research hypotheses were contrasted through non-parametric statistical tests (See Table 6).

The following nonparametric statistical tests were used to contrast the hypotheses in the article: (1) the Chi-squared test, which allows determining the association or independence of two qualitative variables through the use of contingency tables where categorical data are summarized in rows and columns; (2) the Wilcoxon signed-ranks test, which according to authors Juárez et al. (2014), is used to compare the median (central position in a set of ordered data) of two related samples and determine whether there are differences between them; and (3) Spearman’s correlation test, which allows to know the degree of association between two variables through Spearman’s Rho, which in turn determines the dependence or independence of two random variables, as well as how strong the relationship between the variables is and whether the relationship between these variables is positive, null or negative (Elorza & Medina, 1999).
The results for the first research hypothesis are shown in Table 7, where it is observed that students who rated the perceived quality of the services as “high” were the most satisfied with these educational services.
Table 7 Level of Influence of the Perceived Quality of Educational Services and Student Satisfaction.
Source: Prepared by the author.
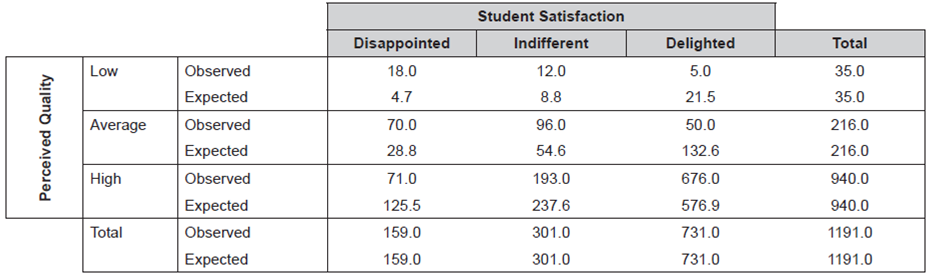
Additionally, for the first research hypothesis, Table 8 (contingency table)- where the results of the chi-square test have a confidence level of 95%-shows that the calculated value of Pearson’s chi-square (242.419) was greater than the critical value of the chi-square (9.4877). Moreover, the significance coefficient (p= 0.000) resulted to be less than 0.05 (p< 0.05), which allowed us to accept the research hypothesis.
Table 8 Chi-Square Test for Quality Perception of Educational Services and Student Satisfaction.
| Statistics | Value | Df | Asymptotic Significance (2-tailed) |
|---|---|---|---|
| Pearson’s chi-square test | 242.419 | 4 | 0.000 |
| Likelihood-ratio test | 229.4815 | 4 | 0.000 |
| N of valid cases | 1191 |
Source: Prepared by the author.
Therefore, it can be stated that the perceived quality of educational services of HEdPERF model influences or impacts the satisfaction of students belonging to the three public universities that are members of the Strategic Alliance of Peruvian Universities.
Similarly, regarding the contrast of the second research hypothesis, which sought to prove that each of the dimensions of the HEdPERF model influences student satisfaction, it was verified through the non-parametric chi-square test that these six dimensions influenced student satisfaction (see Table 9). On the other hand, the influence of the six dimensions on student satisfaction was tested according to each alma mater (UNALM, UNMSM and UNI), concluding that there is a dependency relationship.
Table 9 Chi-Square Test of the Six Dimensions of HEdPERF Model and Student Satisfaction Variable.
| No. | Dimensions of the HEdPERF model | α value versus p-value | Result of the chi-square test |
|---|---|---|---|
| 1 | Academic aspects | 0.000 < 0.05 | Dimension “academic aspects” influences student satisfaction |
| 2 | Non-academic aspects | 0.000 < 0.05 | Dimension “non-academic aspects” influences student satisfaction |
| 3 | Reputation | 0.000 < 0.05 | Dimension “reputation” influences student satisfaction |
| 4 | Access | 0.000 < 0.05 | Dimension “access” influences student satisfaction |
| 5 | Programs | 0.000 < 0.05 | Dimension “programs” influences student satisfaction |
| 6 | Understanding | 0.000 < 0.05 | Dimension “understanding” influences student satisfaction |
Source: Prepared by the author.
After verifying in the second hypothesis that there was dependence between the variablesperceived quality of educational servicesandstudent satisfaction, as well as dependence between each of the six dimensions of the HEdPERF model and variablestudent satisfactionby means of the chi-square test, the Spearman correlation non-parametric test was used to verify the type of association, whose results showed a moderate positive correlation for the dimensions academic aspects, non-academic aspects, programs and understanding; that is to say, their values were between 0.11 and 0.50; while, for the dimensions reputation and access, a considerable positive correlation was found to exist with values between 0.51 and 0.75 (see Table 10).
Table 10 Spearman’s Correlation Test of the Six Dimensions of the HEdPERF Model and Student Satisfaction Variable.
| No. | Dimensions of the HEdPERF model | Correlation coefficient (Rho) | Type of correlation |
|---|---|---|---|
| 1 | Academic aspects | 0.411 | Medium or moderate positive correlation |
| 2 | Non-academic aspects | 0.487 | Medium or moderate positive correlation |
| 3 | Reputation | 0.528 | Significant positive correlation |
| 4 | Access | 0.526 | Significant positive correlation |
| 5 | Programs | 0.464 | Medium or moderate positive correlation |
| 6 | Understanding | 0.478 | Medium or moderate positive correlation |
Source: Prepared by the author.
The same analysis was carried out per university. The results showed that for UNALM students, the dimensions with a moderate positive correlation were academic aspects, non-academic aspects, reputation, programs and understanding; while the only dimension that obtained a considerable positive correlation was access. In the case of UNMSM, the academic aspects and understanding dimensions had a moderate positive correlation, while the other dimensions obtained a considerable positive correlation. Finally, UNI obtained a moderate positive correlation for the six dimensions evaluated.
Similarly, to test the third hypothesis of the research-regarding the identification of which of the six evaluated dimensions of the HEdPERF model presented a high level of perceived quality, that is, between the categories or ratings of “Very Good” and “Excellent”-the Wilcoxon non-parametric statistical test was applied, comparing the calculated median with a hypothetical median. It was found that 4 of the 6 dimensions evaluated (academic aspects, non-academic aspects, access and understanding) do not have a high level of perceived quality; in contrast, the remaining 2 dimensions (reputation and programs) obtained high levels of perceived quality (see Table 11).
Table 11 Wilcoxon Signed-Rank Test of the Six Dimensions with Respect to a Hypothetical Median.
| No. | Dimensions of the HEdPERF model | p-value versus α value | Results of the Wilcoxon signed-rank test |
|---|---|---|---|
| 1 | Academic aspects | 0.9730 > 0.05 | The dimension “academic aspects” does not have a high level of perceived quality. |
| 2 | Non-academic aspects | 1.0000 > 0.05 | The dimension “non-academic aspects” does not have a high level of perceived quality. |
| 3 | Reputation | 0.0000 < 0.05 | The dimension “reputation” has a high level of perceived quality. |
| 4 | Access | 1.0000 > 0.05 | The dimension “access” does not have a high level of perceived quality. |
| 5 | Programs | 0.0000 < 0.05 | The dimension “programs” has a high level of perceived quality |
| 6 | Understanding | 0.1000 > 0.05 | The dimension “understanding” does not have a high level of perceived quality. |
Source: Prepared by the author.
It was also considered convenient to evaluate the third research hypothesis specifically according to the university of origin of the students. It was obtained that for UNALM, the dimensions that presented a high level of perceived quality were academic aspects, reputation, access, programs and understanding; for UNMSM, only the dimension programs obtained a high level of perceived quality; finally, in the case of UNI, none of the dimensions obtained adequate levels of perceived quality.
DISCUSSION
The internal consistency of the items that make up each of the six dimensions of the HEdPERF scale showed that the survey is reliable since its dimensions obtained Cronbach’s alpha coefficients with values ranging between 0.780 and 0.924. The latter coincides with the results obtained by authors Abdullah (2006) and Brochado (2009), who concluded that the HEdPERF scale is the one that best fits the context of higher education in comparison with other “classic” measurement instruments such as SERVQUAL and SERVPERF.
In reference to the verification of the normality of the distribution of the data of the variablesperceived quality of the educational service,dimensionsandstudent satisfaction, through the Kolmogorov Smirnov and Anderson Darling normality tests, it was concluded that they present non-normal distributions. For this reason, it was considered convenient to apply non-parametric statistics to test the three research hypotheses of this article. It was confirmed what was pointed out by the author Jamieson (2004), who indicates that only non-parametric statistics should be used for the analysis of the Likert scale data.
Through the first research hypothesis, it was shown that there is a significant and positive relationship between the perceived quality of educational services proposed by the HEdPERF model and student satisfaction, as evidenced by previous studies (Nguyen et al., 2014; Banahene et al., 2018; Siti et al., 2020). On the other hand, regarding the second research hypothesis, it was also demonstrated that there is a significant and positive relationship between each of the six dimensions and student satisfaction. Finally, for the third research hypothesis, it was proven that the dimensions possessing a high level of perceived quality were “reputation” and “programs”; the latter contributes to the results obtained by other authors who posed similar research hypotheses (Ali et al. 2016; Purwanto et al., 2020).
In relation to the generalization of the research, based on the results of the total sample (1191 students) and the results stratified per university (384 students from UNALM, 392 students from UNMSM and 415 students from UNI), it can be affirmed that depending on the context in which the scale is applied, it is possible to find differences between the six dimensions that make up the HEdPERF model and their degree of influence on student satisfaction, as well as between the levels of quality perceived by each of the dimensions of the HEdPERF model.
This research is a contribution to theoretical knowledge in the framework of the various models that have been applied to measure the quality of service in higher education institutions, because, for the first time, the scale proposed by the HEdPERF model was applied in a context of Peruvian public universities (Universidad Nacional Mayor de San Marcos, Universidad Nacional Agraria La Molina and Universidad Nacional de Ingeniería). In addition, the originality of this study lies in the translation from English to Spanish of the measurement instrument mentioned, as well as the contribution of new dimensions to evaluate the perceived quality of educational services, such as: academic aspects, non-academic aspects, reputation, access, programs and understanding; according to its author and creator Abdullah (2005). Finally, this research makes a contribution to the systemic review of the academic literature on educational quality management models, as well as the main scales used to study the quality of educational services in higher education institutions and the current regulations regarding quality assurance in Peruvian university higher education.
On the other hand, the practical implications of the study made it possible to show in qualitative and quantitative terms the quality perceived in educational services under the HEdPERF model approach and its degree of influence on student satisfaction in a context subsequent to the implementation of the institutional licensing mechanism.
CONCLUSIONS
The HEdPERF model scale has proven to be a valid and reliable instrument due to its application to undergraduate and graduate students of the public universities that are members of the Strategic Alliance of Peruvian Universities, so it can be used in future research studies.
The first research hypothesis was proved, and it was concluded that the perceived quality proposed by the HEdPERF model significantly influences student satisfaction, for which non-parametric statistical tests such as chi-square and Spearman’s correlation were used.
The second research hypothesis was proved, so it can be affirmed that the level of perceived quality in each of the six dimensions of the HEdPERF model significantly influences student satisfaction, for which the non-parametric statistical tests chi-square and Spearman’s correlation were used.
The third research hypothesis was tested by the Wilcoxon signed-rank test, determining the levels of perceived quality for each of the dimensions of the HEdPERF model; obtaining that four of the six dimensions evaluated (academic aspects, non-academic aspects, access and understanding) do not have a high level of perceived quality, while the remaining two dimensions (reputation and programs) obtained high levels of perceived quality.
The Wilcoxon test analysis was performed for each of the universities included in the scope of this research and it was found that for UNALM, the dimensions that presented a high level of perceived quality were academic aspects, reputation, access, programs and understanding; for UNMSM, only the dimension programs obtained a high level of perceived quality; and for UNI, none of the dimensions obtained high levels of perceived quality. From the above, it can be concluded that there are differences in the levels of perceived quality among the dimensions according to each university.
REFERENCES
[1] Abdullah, F. (2005). HEdPERF versus SERVPERF: The quest for ideal measuring instrument of service quality in higher education sector.Quality Assurance in Education,13(4), 305-328. Recuperado de https://doi.org/10.1108/09684880510626584 [ Links ]
[2] Abdullah, F. (2006). The development of HEdPERF: a new measuring instrument of service quality for the higher education sector.Internacional Journal of Consumer Studies,30(6), 569-581. Recuperado de https://doi.org/10.1111/j.1470-6431.2005.00480.x [ Links ]
[3] Abu Hasan, H., Illias, A., Rahman, R., y Razack, M. (2008). Service Quality and Student Satisfaction: A Case Study at Private Higher Education Institutions.International Business Research, 1(3),163-175. Recuperado de https://doi.org/10.5539/ibr.v1n3p163 [ Links ]
[4] Ali, F., Zhou, Y., Hussain, K., Nair, P., y Ravagan, N. (2016). Does higher education service quality effect student satisfaction, image and loyalty? A study of international students in Malaysian public universities.Quality Assurance in Education,24(1), 70-94. Recuperado de https://doi.org/10.1108/QAE-02-2014-0008 [ Links ]
[5] Arefi, M., Heidari, M., Morkani, G., y Zandi, K. (2012). Application of Kano Model in Higher Education Quality Improvement: Study Master’s Degree Program of Educational Psychology in State Universities of Tehran.World Applied Sciences Journal, 17(3), 347-353. Recuperado de https://www.idosi.org/wasj/wasj17(3)12/12.pdf [ Links ]
[6] Banahene, S., Kraa, J., y Kasu, P. (2018). Impact of HEdPERF on Students’ Satisfaction and Academic Performance in Ghanaian Universities; Mediating Role of Attitude towards Learning.Open Journal of Social Sciences, 6(5), 96-119. Recuperado de https://doi.org/10.4236/jss.2018.65009 [ Links ]
[7] Brochado, A. (2009). Comparing alternative instruments to measure service quality in higher education.Quality Assurance in Education, 17(2), 174 -190. Recuperado de https://doi.org/10.1108/09684880910951381 [ Links ]
[8] Cañón, A., y Rubio, D. (2018).Importancia de la utilización del modelo SERVQUAL a partir de una revisión sistemática de la literatura en el periodo 2010-2016. (Trabajo de grado - especialización). Fundación Universitaria de Ciencias de la Salud, Bogotá. Recuperado de https://repositorio.fucsalud.edu.co/handle/001/669 [ Links ]
[9] D.S. N° 016-2015-MINEDU. Aprueban la política de aseguramiento de la calidad de la educación superior universitaria. Diaria Oficial El Peruano (2015). [ Links ]
[10] Del Campo, M., Ferreiro, F, y Camino, M. (Julio de 2013). Una aplicación del modelo EFQM a la educación superior.XXII Jornadas de la Asociación de la Economía de la Educación. Recuperado de http://2013.economicsofeducation.com/user/pdfsesiones/138.pdf?PHPSESSID=evsluk1nq0k6noc2eipo8tlnt7 [ Links ]
[11] Eftimov, L., Trpeski, P., Gockov, G., y Vasileva, V. (2016). Designing a Balanced Scorecard as Strategic Management System for Higher Education Institutions: A Case Study in Macedonia.Ekonomika, Journal for Economic Theory and Practice and Social Issues,62(2), 29-48. Recuperado de https://doi.org/10.22004/ag.econ.288842 [ Links ]
[12] Elorza, H., y Medina, J. (1999).Estadística para las ciencias sociales y del comportamiento. México D. F., México: Oxford University. [ Links ]
[13] Gallifa, J., y Batallé, P. (2010). Percepción de los estudiantes sobre la calidad del servicio en un sistema de educación superior con varios campus en España.Revista de Aseguramiento de la Calidad en la Educación,18(2), 156 - 170. Recuperado de https://doi.org/10.1108/09684881011035367 [ Links ]
[14] Govender, J., Veerasamy, D., y Noel, D. (2014). The Service Quality Experience of International Students: The Case of a Selected Higher Education Institution in South Africa.Mediterranean Journal of Social Sciences, 5(8) ,465-473. Recuperado de https://doi.org/10.5901/mjss.2014.v5n8p465 [ Links ]
[15] Hussein, B., Abou-Nassif, S., Airidi, M., Chamas, M., y Khachfe, H. (2017). Challenges of Implementation of ISO 9001:2015 in the Lebanese Higher Education Institutions.Journal of Resources Development and Management, 33, 41-51. [ Links ]
[16] Instituto Internacional de la UNESCO para la Educación Superior en América Latina y el Caribe. (2006).Informe sobre la Educación Superior en América Latina y el Caribe 2000-2005: La Metamorfosis de la educación superior. Caracas, Venezuela: Editorial Metropolis C.A. [ Links ]
[17] Jamieson, S. (2004). Likert Scale: How to (ab)Use Them.Medical Education 38(12), 1217 -1218. Recuperado de https://doi.org/10.1111/j.1365-2929.2004.02012.x [ Links ]
[18] Juárez, F., López, E., y Villatoro, J. (2014). Estadística Inferencial Univariada. En: F. Juárez, J. López y V. Salinas (Eds.).Apuntes para la investigación en salud(161-282). México D.F., México: Editorial de la Universidad Nacional Autónoma de México. [ Links ]
[19] El Peruano. Ley N° 30220 (2014, miércoles 9 de julio). Ley Universitaria. El Peruano Normas Legales: 527211-527233. [ Links ]
[20] Maldonado, M., y Moreta, X. (2017).Medición de Calidad del Servicio mediante Modelo SERVPERF en Envasadora Ecuatoriana S.A.(Tesis de Maestría). Universidad de Guayaquil, Guayaquil. [ Links ]
[21] Murad, A., y Shastri, R. (2010). Implementation of Total Quality Management in Higher Education.Asian Journal of Business Management, 2(1), 9-16. [ Links ]
[22] Nadim, Z., y Al Hinai, A. (2016). Critical success factors of TQM in higher education institutions context.International Journal of Applied Sciences and Management, 1(2), 147-156. [ Links ]
[23] Nguyen, V., Nguyen, H., y Lam, P. (2014).A Research of Student’s Satisfaction Towards Service Quality of Universities in Ho Chi Minh City. 2nd International Conference on Green Technology and Sustainable Development, Bangkok, Tailandia. [ Links ]
[24] Organización Internacional de Normalización. (2018).Organizaciones educativas - Sistemas de Gestión para Organizaciones Educativas - Requisitos con orientación para su uso(ISO 21001:2018). Recuperado de https://www.iso.org/obp/ui#iso:std:iso:21001:ed-1:v1:es [ Links ]
[25] Pontificia Universidad Católica de Chile. (2011).Sistema de aseguramiento de la calidad de la Educación Superior: aspectos críticos y desafíos de mejoramiento. Centro de Políticas Públicas UC. Recuperado de https://politicaspublicas.uc.cl/wp-content/uploads/2015/02/sistema-de-aseguramiento-de-la-calidad-de-la-educacion-superior.pdf [ Links ]
[26] Purwanto, Y., Noor, I., y Kusumawati, A. (2020). Service Quality Measurement through Higher Education Performance (HEDPERF) The Case of an Indonesian Public University.Wacana Journal of Social and Humanity Studies,23(1), 10-16. Recuperado de https://wacana.ub.ac.id/index.php/wacana/article/view/676 [ Links ]
[27] SUNEDU. Resolución del Consejo Directivo N° 011-2017-SUNEDU/CD. Otorgan Licencia Institucional a la Universidad Nacional Agraria La Molina, para ofrecer el servicio educativo superior universitario. Diario Oficial El Peruano (2017). [ Links ]
[28] SUNEDU. Resolución del Consejo Directivo N° 036-2018-SUNEDU/CD. Que otorga la licencia institucional a la Universidad Nacional Mayor de San Marcos, para ofrecer el servicio educativo superior universitario. Diario Oficial El Peruano (2018). [ Links ]
[29] SUNEDU. Resolución del Consejo Directivo N° 073-2017-SUNEDU/CD. Que otorga la licencia institucional a la Universidad Nacional de Ingeniería, para ofrecer el servicio educativo superior universitario. Diario Oficial El Peruano (2017). [ Links ]
[30] Schmatz, R., Wolf, G., y Landmann, M. (agosto de 2015).Students as customers: The Net Promoter Score as a measure of satisfaction and loyalty in higher education[artículo]. From here to there: Positioning higher education institutions - EAIR 37thAnnual Forum, Krems, Austria. [ Links ]
[31] Silva, D., Moraes, G., Makiya, I., y Cesar, F. (2017). Measurement of perceived service quality in higher education institutions: A review of HEdPERF scale use.Quality Assurance in Education,25(4), 415-439. Recuperado de https://doi.org/10.1108/QAE-10-2016-0058 [ Links ]
[32] Siti, O., Nor Alesha, M., Nur Shafini, M., y Khalid, M. (2020). The Effects of Service Quality Dimensions on Students’ Satisfaction: HEdPERF Model Adoption.Jurnal Intelek. 15(1), 69-76. [ Links ]
[33] Spilimbergo, A. (2009). Democracy and Foreign Education.Revisión Económica Americana,99(1), 582-543. Recuperado de https://doi.org/10.1257/aer.99.1.528 [ Links ]
[34] Sunanto, S., Taufiqurrahman, T., y Pangemanan, R. (2007). An Analysis of University Service Quality Gap and Student Satisfaction in Indonesia.The International Journal of Knowledge, Culture, and Change Management: Annual Review, 7(7), 1 -10. Recuperado de https://doi.org/10.18848/1447-9524/CGP/v07i07/50400 [ Links ]
[35] Zineldin, M., y Vasicheva, V. (2014). The Implementation of TRM Philosophy and 5Qs Model in Higher Education - An Exploratory Investigation at a Swedish University.Nang Yan Business Journal, 1(1), 65-75. [ Links ]
1 A mechanism that allows the Peruvian State to ensure that institutions entering the market to provide higher education services comply with minimum quality requirements.
Received: May 02, 2020; Accepted: January 19, 2021
 Este es un artículo publicado en acceso abierto bajo una licencia Creative Commons
