


Servicios Personalizados
Revista

Articulo
 texto en
  Inglés (pdf)
 Articulo en XML
 Referencias del artículo
 Enviar articulo por email
Indicadores
-
 Citado por SciELO
Links relacionados
-
 Similares en
SciELO
Similares en
SciELO
Compartir

 Permalink
Industrial Data
versión impresa ISSN 1560-9146versión On-line ISSN 1810-9993
Ind. data vol.24 no.1 Lima ene./jun 2021
http://dx.doi.org/10.15381/idata.v24i1.18402
Production and Management
Implementation of the TPM-Lean Manufacturing Methodology to Improve the Overall Equipment Effectiveness (OEE) of Spare Parts Production at a Metalworking Company

1 Industrial engineer from Universidad Peruana de Ciencias Aplicadas (Lima, Peru). Currently working as head of production at Frecep SAC, a metalworking company (Lima, Peru). suministrosproyectoss@gmail.com
This article intends to demonstrate the feasibility of applying the TPM-Lean Manufacturing methodology in SME manufacturers of metal spare parts, as there is a growth in demand, visible in the sector, which cannot be exploited due to its Overall Equipment Effectiveness (OEE) low values. The aim is to contribute to a better knowledge of the application technique to reduce waste in process industries so that, through an analysis of their production data, the problems that prevent companies from being efficient are identified and, through the selection, development and implementation of the techniques of the Lean Manufacturing Methodology, SME can be oriented to carry out improvement actions in their production systems at a low cost.
Key words: Lean Manufacturing; process industries; Total Productive Maintenance; waste; OEE
INTRODUCTION
Due to globalization, manufacturing organizations had to adapt their manufacturing strategies to the changes in the world economy. Increasing competition and rapid strategic positioning of companies in the same industry led organizations to improve, with limited resources, their quality and productivity parameters. Thus, many organizations have realized that their survival in business depends fundamentally on producing high quality goods and services.
This research proves the hypothesis that the use and development of TPM-Lean Manufacturing methodology improves the overall equipment effectiveness (OEE) of production, taking into account the analysis of failures and reliability of the equipment in addition to the forecast of the demand for spare parts in a metalworking company.
Therefore, the contribution of this study is to show how using TPM-Lean Manufacturing methodology increases the OEE by stablishing a relationship between compliance of preventive maintenance and the forecast of future production, and by focusing on improving the quality factor by reducing defects in the manufactured products. The objective of this methodology is summarized in achieving efficient world-class companies with a lower investment.
This article is designed to be used by different companies in the manufacturing sector, especially by small and medium-sized enterprises (SMEs) that need to collect data such as process time per unit and per manufactured products, equipment or machinery maintenance time, and causes that generate defects in manufactured products.
The study is quantitative to reach a deep descriptive and pre-experimental analysis. Descriptive because it focuses on describing the data, processes, or any other element that is subjected to analysis; and pre-experimental because it focuses on proving that the independent variable modifies the dependent variable.
Lean Manufacturing
Lean Manufacturing appeared as a solution to reduce waste in production processes by implementing the concepts originated in the Toyota Production System (TPS), which were developed by Eiji Toyoda, Taiichi Ohno and Shigeo Shingo in the early 1940s. It has been directly applied to discrete industries, that is, assembly industries. However, applicability to process industries, that is, continuous industries, is still under development. Recently, scholars such as Abdulmalek and Rajgopa (2007); King (2019), Mahapatra and Mohanty (2007); Marodin et al. (2018); and Pool et al. (2011) have been analyzing and implementing some of the Lean concepts in process industries and have achieved remarkable results. The goal of Lean Manufacturing is to reduce waste at every stage of the production process.
For Hu et al. (2015), Lean Manufacturing methodology is increasingly applied in manufacturing companies, regardless of their size, in order to make them more competitive and sustainable and to achieve positioning in the modern market. The application of this methodology also resulted in great agility in production processes. Therefore, the applicability of Lean Management in SMEs is recognized as crucial for the development of economies around the world.
Powell et al. (2009) acknowledge that, although many of the Lean practices and tools have been successfully applied in all types of industrial processes, there is a significant lack of the application of control practices of Lean production in process industries.
Abdulmalek and Rajgopal (2007) present a case-based approach to show how lean manufacturing practices, when used appropriately, help eliminate waste in process industries, keep a better inventory control, improve product quality, and contribute to a better overall financial and operational control. Not all lean tools are applicable in the same manufacturing environments; therefore, it must be identified which lean tools are applicable in each manufacturing environment within the process industries.
There are lean methodologies that are applicable to all types of manufacturing environments in the process sector, regardless of their specific characteristics. These tools offer the possibility to obtain significant profit with relatively low investments since they require simple application (Abdulmalek & Rajgopal, 2007; Powell et al., 2009).
Manufacturing flexibility is very important for agility and can be improved with an appropriate Lean implementation. It means that industries make what the customer orders as soon as possible after the order has been placed (Saleeshya et al., 2012).
TPM and OEE
According to Jasiulewicz-Kaczmarek (2016), total productive maintenance (TPM) is a set of strategic initiatives focused on maintaining and improving production and quality systems through machines, equipment, processes, and employees that add value to an organization.
TPM has eight pillars aimed mainly at proactively improving machine reliability. People are at the center of this system and must be continuously trained to identify and eliminate waste (Zarreh et al., 2018).
The publications on TPM agree that this methodology has a participatory work philosophy, whose objective is to maximize the effectiveness of machinery and equipment by eliminating errors, defects and other negative phenomena.
According to Moreira et al. (2018), OEE is a performance indicator that allows measuring the overall effectiveness of the equipment that makes it possible to know the productive efficiency of a company, department or machine.
Nakajima (1988) defines six types of losses and gathers them in three groups, associating each group to an indicator; thus, he mentions that there are: (a) losses due to the unavailability of equipment, (b) losses due to poor equipment functioning or performance, and (c) losses due to manufacturing low-quality products. Nakajima associates these groups to their indicators availability (A), performance (P) and quality (Q) respectively.
The overall equipment effectiveness (OEE) indicator is obtained by multiplying the three indicators previously mentioned. Figure 1 illustrates the procedure to calculate OEE and shows its relationship with the six types of losses mentioned above. Given the emergence of new production schemes with increasingly complex systems, the OEE calculation must also be supported by new technologies in order to guarantee the quality of the information, de igual manera éste debe estructurarse bajo una buena estrategia de manufactura como lo es la filosofía “Lean” y debe de ser complementado por la metodología de mejora continua [likewise, it must be structured under a good manufacturing strategy such as the Lean philosophy and must be complemented by the continuous improvement methodology] (García et al., 2011).

Failure Analysis
The Weibull distribution is one of the most used distributions in reliability and maintenance engineering. Depending on the value of the shape parameter, β (beta), the failure rate can decrease, be constant or grow. It is used to model the failure behavior of various real-life systems. (Chaurasiya et al., 2017; Bistouni & Jahanshahi, 2015).
MTBF and MTTR
According to Saetta, and Caldarelli, (2018), Mean Time Between Failures (MTBF) is a KPI related to the average production time elapsed between a failure and the next time it happens.
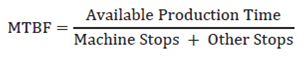
They also indicate that the Mean Time To Repair (MTTR) is the time it takes to make a repair after the failure has occurred. In other words, it is the time used during the intervention in a given process.

METHODOLOGY
Hernández et al. (2010) state thatel investigador puede incluir en su estudio dos o más variables independientes. Cuando en realidad existe una relación causal entre una variable independiente y una dependiente, al variar intencionalmente la primera, la segunda también variará[the researcher can include two or more independent variables in their study. When a causal relationship between an independent variable and a dependent variable does exist, by intentionally varying the first, the second will also vary] (p. 54); for example, if there is a causal relationship between the TPM methodology and OEE, the implementation of TPM will affect OEE, so it can be said that this research is pre-experimental.
According to Tamayo (2003), experimental research can present different types of experimental designs, the best known being the pre-experimental design; therefore, the design of this research is pre-experimental, because it has a pre-test and post-test control group.
Hernández et al. (2010), state that quantitative researchusa la recolección de datos para probar hipótesis, con base en la medición numérica y el análisis estadístico, para establecer patrones de comportamiento y probar teorías[uses data collection to prove hypotheses, based on numerical measurement and statistical analysis, to establish behavior patterns and to prove theories] (p. 4).
Tamayo (2003) states thatla investigación cuantitativa consiste en el contraste de teorías ya existentes a partir de una serie de hipótesis surgidas de la misma[quantitative research consists of contrasting already existing theories based on a series of hypotheses derived from it]. This author also emphasizesla necesidad de trabajar con una muestra representativa de una población o fenómeno objeto de estudio[the need to work with a representative sample of a population or phenomenon under study].
Cauas (2006) states thatutiliza la recolección y el análisis de datos para contestar preguntas de investigación y probar hipótesis establecidas previamente, confía en la medición numérica, el conteo y frecuentemente en el uso de estadísticas para establecer con exactitud, patrones de comportamiento en una población[it uses data collection and analysis to answer research questions and to prove hypotheses previously established, relying on numerical measurement, counting and frequently on the use of statistics to accurately establish behavior patterns in a population] (p. 39).
According to Hernández et al. (2010), descriptive research aims to specify properties, characteristics and important features of any phenomenon analyzed.
For Tamayo (2003),el tipo de investigación descriptiva comprende el registro, análisis e interpretación de la naturaleza actual, y la composición o procesos de los fenómenos[descriptive research comprises the recording, analysis and interpretation of nature, and phenomena composition or processes]. The author advises working on factual realities and their fundamental characteristic of presenting a correct interpretation.
To verify that Lean methodology is applicable to problem solving in an SME process company, the company Frecep SAC, manufacturer of spare parts for mining machinery and equipment, based in Lima, has been selected.
This company presents a large number of finished products delivered with excessive delays to its customers, which causes their dissatisfaction. As a consequence, the company loses more clients, its production costs increase, its profits are reduced, and risks being excluded from the market.
This research is a descriptive and pre-experimental study with a quantitative approach, since it works with the database provided by the company. This database is used to carry out an analysis and measurement of the improvements implemented.
Since Lean Manufacturing is a work philosophy that aims to improve and optimize any production system focusing on the identification and elimination of waste, which are the activities that consume more resources than necessary, the methodology suggested by the different authors consulted in this case study will be applied.
As the main data source, the information of 2018 production provided by the metalworking company was analyzed so that it would allow to select the operational tools that support the applicability of the Lean methodology for this case. Thus, it was detected that the company under study presents low OEE in the spare parts production line, which generates unnecessary costs mainly due to non-compliance with the preventive maintenance program, which in turn generates numerous stops of its machines and increases repair work for corrective maintenance. Consequently, low quality final products were obtained, and the spare parts manufactured were delivered late.
ANALYSIS
Unit of Analysis
The unit of analysis of this research is a part manufactured in the metalworking company under study.
Study Population
The population chosen for this study was the total spare parts production in 2018, that is, the 789 parts manufactured, as shown in Table 1.
Sample Size
For the calculation of the sample size, a population N of 789 pieces (total production in 2018) has been considered. The value of Z refers to the confidence level, which has been selected at 95%; consequently, the error (E) will be 0.05. Table 2 shows the sample size calculation.
Sample Selection
The sample was selected from the historical database of and only those parts manufactured with defects. The sample represents 57.71% of the population, as shown in Table 3 below.
Table 3 Types of Failures.
| Causes of defective parts | Subcauses | Frequency | Total |
|---|---|---|---|
| Poor measuring and cutting | Machine failure | 71 | 122 |
| Deficient turning | Machine failure | 75 | 138 |
| Deficient milling | Machine failure | 45 | 83 |
| Deficient grinding | Machine failure | 56 | 85 |
| Total | 247 | 428 | |
| Equivalent | 57.71% |
Source: Prepared by the author
Data Collection Techniques
The company database, which was provided by the production control and planning area, was used. The production reports, equipment failure reports, and preventive and corrective maintenance records were used to describe the processes and to analyze the variables provided, which belonged to the production line of spare parts for mining equipment of the company. Figure 2 shows the scheme used for data processing and analysis.

By analyzing the information, it has been detected that the operation of the company under study is characterized by the following results:
Of the total of 789 units produced in 2018, 340 were delivered late, representing 43.09% of the annual production.
Non-compliance with the preventive maintenance program in 2018 was 93.75%, since out of 16 scheduled preventive maintenance jobs, 4 scheduled for each machine (cutter, lathe, milling machine and grinding machine), only 1 was complied with.
The excess of corrective maintenance hours in 2018 was 96.76%, that is, 239 processes out of the 247 processes selected as a sample, exceeded the hours scheduled for each corrective maintenance.
Reprocesses and shrinkage were generated as non-conforming products: for the production of 789 units, 414 reprocesses were generated during manufacturing, and 393 products were shrinkage, so it is assumed that 1596 new processes were opened to produce 789 units; the reprocesses represented 25.94%, and the processes that generated shrinkage were equal to 24.62% and the products delivered were 49.44% of the 1596 processes.
The problems occurred due to work performed with deficiencies in the areas of measuring and cutting, turning, milling and grinding. The occurrence of machine failures has a great incidence in these areas (58.2% in measuring and cutting; 54.35% in turning; 54.22% in milling and 65.8% in grinding).
It is inferred that equipment failure is caused by the lack of preventive maintenance work on them, which has generated losses of time, resources, materials and money; also, the use of additional human resources to cover inspections in reprocessing means a great loss in productivity.
Having identified the problem, total productive maintenance and the detection, prevention and elimination of waste were selected as techniques of Lean Manufacturing methodology to be used to improve the performance of the company under study.
Hypothesis Proposition and Testing
In order to have the data processed for the current study, Microsoft Excel software was used, specifically its statistical tools and those created to build customized tables and graphs. For the interpretation of the statistical results, the books by Chue et al. (2009) and Córdova (2003) were used.
The hypothesis tests of failure analysis, reliability and demand were performed, as well as the general hypothesis test, which, in order to be validated, requires the previous validation of the three previous hypotheses. The results of the general hypothesis test will be shown, since the four mentioned have the same scheme.
General Hypothesis Test
This hypothesis must be validated by means of the three specific hypotheses, since these are required to accept or reject the general hypothesis by means of the OEE values.
Null hypothesis-H0:The use of the TPM-Lean Manufacturing methodology does not improve the OEE in the production of spare parts for mining equipment in the company Frecep SAC.
Alternate hypothesis-H1:The use of the TPM-Lean Manufacturing methodology does improve the OEE in the production of spare parts for mining equipment in the company Frecep SAC.
To validate the hypotheses, a Student's t-test for paired samples will be used, selecting a reliability of 95%. Once the result is obtained, the null hypothesis will be rejected ift< -2.776 and ift> 2.776. The data taken before and after TPM implementation corresponding to current and improved OEE values will be used as shown in Table 4.
Table 4 Student’s T-Test-General Hypothesis.
| t-Test: Paired Two Sample for Means | Current | Improved |
|---|---|---|
| Mean | 133.0000000 | 65.3352210 |
| Variance | 423.0909091 | 4.9223734 |
| Observations | 12 | 12 |
| Pearson’s correlation | 0.5808295 | |
| Hypothetical mean difference | 0 | |
| Df | 11 | |
| t Stat | 12.1042398 | |
| P(T < = t) one-tailed | 0.0000001 | |
| t Critical one-tailed | 1.7958848 | |
| P(T < = t) two-tailed | 0.0000001 | |
| t Critical two-tailed | 2.2009852 |
Source: Prepared by the author.
Where, t stat=-20.446, that is, it is less than -2.776; then, the null hypothesis is rejected, and the alternative hypothesis is accepted. Since there is a confidence level of 95%, the alternate general hypothesis is accepted, which states: “The use of the TPM-Lean Manufacturing methodology does improve the OEE in the production of spare parts for mining equipment in the company Frecep SAC”.
Application of the TPM Technique.
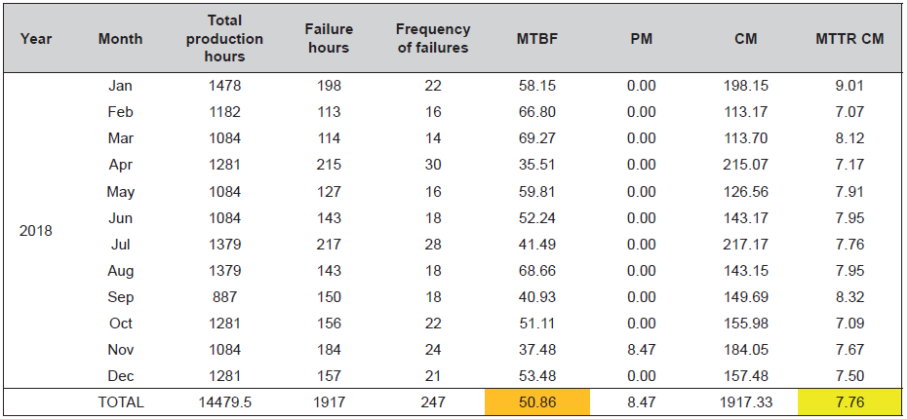
For the implementation of TPM, the pillar planned maintenance and the pillar focused improvement were executed, which refers to analyze failures and improve the maintenance management process. When analyzing the preventive maintenance schedule, it was observed that in 2018 no planned maintenance (PM) was performed on the cutting, lathe and milling equipment. Due to the non-compliance of PM, which was 93.75%, a break in the operation was caused, which originated a series of corrective maintenance (CM). When only 8.47 hours of PM were fulfilled, 1917.33 hours of CM and 1177.64 hours of excess of CM were originated, that is, for each PM performed, approximately 226 CM were executed.
An Excel sheet was generated to determine the x-axis and y-axis in order to use the regression tool and thus calculate the Weibull failure parameters β and α, using the Weibull equations.
Likewise, the MTBF and MTTR indicators were calculated: The MTBF value was 50.86 hours, which means that every 50.86 hours a failure occurs in any of the 4 machines, and the average repair time for each CM is 7.76 hours on average. With this data we can calculate the reliability of the equipment as shown in Table 5.
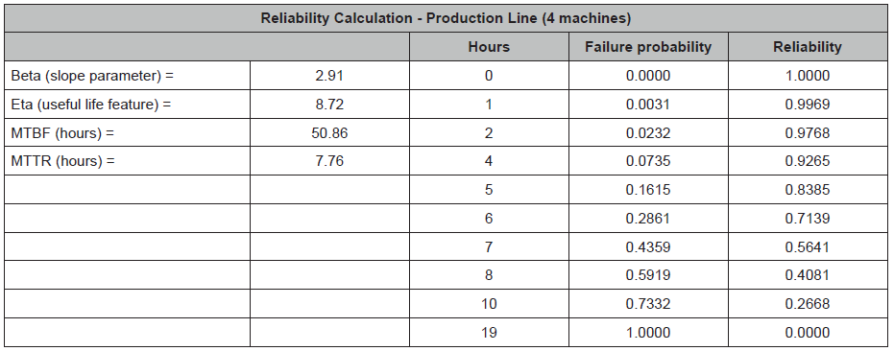
The calculation of the reliability of the line is low, since at 6 hours it is 0.7139, at 10 hours it is only 0.2668 and at 19 hours after a failure it is 0.
By applying the pillar focused improvement, a new preventive maintenance schedule is generated, in which it is calculated that, due to the wear of the equipment, preventive maintenance should be performed every 13 days (MTBF/8 hours per day). The work has been considered 365 days, so there is a frequency of 28 PM in a year.
It has been calculated that the probability of execution of a PM is 0.25, so it is assumed that out of a frequency of 28 PM for each equipment, 7 must be executed, and in the case of autonomous maintenance (AM), 13 must be executed. This means that when a total of 320 maintenance tasks are programmed, between PM and AM, 80 must be executed. The planning of the PM works is complemented with the creation of the forms and logs to be used to record the verifications in the execution of the works.
Based on the current demand (year 2018) a forecast of the future demand with the improved conditions (year 2019) was made. Thus, it has been calculated that the daily demand for products is an average of 3.52 units per day for 2018 and an average of 3.29 units per day for 2019. Considering that the production per product takes 1.52336 days, the production time for the products in 2019 is very similar when using the four machines for manufacturing.
There was an improvement in the reduction of the delivery times of on time finished products, which was a total of 719 units. This means that of the annual production of 742 units, 23 units were delivered late, due to reprocesses (22) and processes that generated waste (20). Thus, the number of operators was reduced from an average of 8 to 6, as well as the theoretical hours from 17,908 to 12,420 hours (due to the difference in the number of operators and the decrease in maintenance hours); the programmed hours were reduced from 14 700 to 10 200 hours per year; and the hours of classes and meetings from 220.50 to 153 hours. The number of PM hours was increased from 8.47 to 247.90 hours, which reduced CM from 1917.33 to 65.51 hours, eliminating CM overtime. Production delay was reduced from 2156.49 to 112.37 hours and production time was reduced from 9602.80 to 9028.33 hours. Downtime was reduced from 794.40 to 592.89 hours by adding 40 hours of MA.
Complying with the PM reduced the CM, since due the lack of PM, mechanical failures of the equipment and the need for the CM occur; therefore, by forecasting the frequency and hours of PM and CM, the following OEE has been calculated:
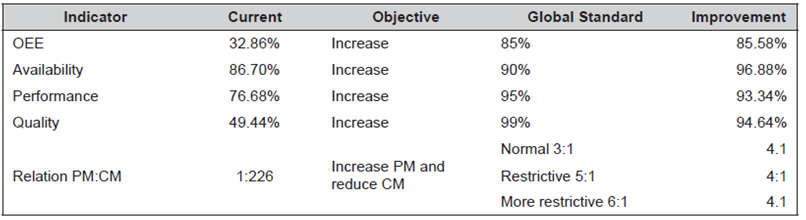
Consequently, by improving compliance with the MPs and MAs by 30.84%, the quality factor has improved from 49.44% to 94.64%, the performance factor from 76.68% to 93.34%, and, therefore, the availability factor has also increased from 86.70% to 96.88%. The OEE was increased from 32.86% to 85.58%, exceeding the world class rate of 85%. It was concluded that non-compliance with PMs generates CMs and it results in project delivery delay. The change in MTBF and MTTR rates are also significant, as shown in Table 6.

When calculating the annual MTBF, it is observed that it has increased from 50.86 hours to 237.65 hours and the MTTR has been reduced from 7.76 hours to 0.27 hours.
It is possible to quantify the savings obtained by implementing the TPM methodology, which amount to S/ 590,353.55 as a result of reducing the number of operators and the hours and delay per CM. In turn, the investment is S/ 119,317.15 for the increase in PM and AM and for the training of operators for proper management of maintenance work. This is shown in Table 7.

RESULTS
As a final result, it is concluded that by improving compliance with PM (preventive maintenance) and AM (autonomous maintenance), the quality factor has improved (from 49.44% to 94.64%), as well as the performance factor (from 76.68% to 93.34%), and, consequently, the availability factor has increased (from 86.70% to 96.88%); therefore, the OEE increased from 32.86% to 85.58%, exceeding the worldwide rate of 85. In addition, the relation of preventive and corrective maintenance also improves from 1:226 to 4:1. Table 8 shows the indicators.
MTBF (mean time between failures) and MTTR (mean time to repair) are also important. When calculating the annual MTBF, it is noted that its value has increased from 50.86 hours to 237.65 hours and the MTTR has been reduced from 7.76 hours to 0.27 hours, as shown in Tables 9 and 10.
Table 9 MTTR and MTBF Comparison of the Current Production Process 2018.
Source: Prepared by the author.
Table 10 MTTR and MTBF Comparison of the Improved Production Process 2019.

Source: Prepared by the author.
Finally, the maintenance management process has been changed by reducing the activity, as illustrated in Figure 3, assuming that the PMs are met, as established in this research.

CONCLUSIONS
After having developed this research to demonstrate the feasibility of the application of the TPM-Lean Manufacturing methodology in manufacturing companies of metal spare parts, the following conclusions have been determined:
- The use and application of the TPM-Lean Manufacturing methodology is convenient to show the diagnosis of the current state of the company and to find and propose alternatives in order to achieve the improvement of a manufacturing process.
- The influence of the Lean Manufacturing tools in the increase of the efficiency of the production of spare parts for equipment of the mining sector in the company FRESEP SAC is tangible.
- By means of the adequate processing of a necessary database, the fundamental causes of the low OEE in the production of spare parts can be determined; these causes, in the case of the company under study, are the non-compliance of preventive maintenance and the excess of hours used in corrective maintenance, as obtained through the use of the TPM methodology.
- Through the application of the TPM methodology, the OEE in the production of spare parts for mining sector equipment in the metalworking company FRESEP SAC has increased from 32.86% to 85.58%.
- To implement the proposed improvements in the company under study, an investment of S/ 119 317.15 is required, which is justifiable, since it generates savings of S/ 590 353.55.
- The proposed objectives have been achieved and the hypotheses proposed in this research have also been demonstrated, showing that its application is feasible for manufacturing companies in the SME sector at low costs.
REFERENCIAS BIBLIOGRÁFICAS
[1] Abdulmalek, F., y Rajgopal, J. (2007). Analyzing the benefits of lean manufacturing and value stream mapping via simulation: A process sector case study.International Journal of Production Economics,107(1), 223-236. Recuperado de https://doi.org/10.1016/j.ijpe.2006.09.009 [ Links ]
[2] Bistouni, F. y Jahanshai, M. (2015). Evaluating Failure Rate of Fault-Tolerant Multistage Interconnection Networks Using Weibull Life Distribution.Reliability Engineering & System Safety, 144, 128-146. [ Links ]
[3] Cauas, D. (2006).Elementos para la elaboración y ejecución de un proyecto de investigación. Investigación en Ciencias Sociales. Recuperado de webjam-upload.s3.amazonaws.com/apuntesinvest_cauas__1539__.pdf [ Links ]
[4] Chaurasiya, P., Ahmed, S., y Warudkar, V. (2017). Wind characteristics observation using Doppler-SODAR for wind energy applications. Resource-Efficient Technologies, 3(4), 495-505. Recuperado de https://doi.org/10.1016/j.reffit.2017.07.001 [ Links ]
[5] Chue, J., Barreno, E., Castillo, C., Millones, R., y Vásquez, F. (2009).Estadística descriptiva y probabilidades(2ª ed.). Lima, Perú: Universidad de Lima. [ Links ]
[6] Córdova, M. (2003).Estadística Descriptiva e inferencial(5ª ed.). Lima, Perú: Pontificia Universidad Católica del Perú. [ Links ]
[7] García, M., Santos, J., Arcelus, M., y Viles, E. (2011).Plug&Lean-OEE game: Juego de entrenamiento basado en el indicador de efectividad global del equipo enfocado en mejorar la productividad de las operaciones de manufactura. Recuperado de https://www.semanticscholar.org/paper/Plug%26Lean-OEE-game%3A-Juego-de-entrenamiento-basado-Garc%C3%ADa-Santos/4c2a517417e320e6ecee6878e892fad4d625031b [ Links ]
[8] Hernández, R., Fernández, C., y Baptista, P. (2010).Metodología de la investigación(5ª ed.). México D.F., México: McGraw-Hill. [ Links ]
[9] Hu, Q., Mason, R., Williams, S.J., y Found, P. (2015). Lean implementation within SMEs: a literature review.Journal of Manufacturing Technology Management, 26(7), 980-1012. Recuperado de https://doi.org/10.1108/JMTM-02-2014-0013 [ Links ]
[10] Jasiulewicz-Kaczmarek, M. (2016). SWOT analysis for Planned Maintenance strategy-a case study.IFAC-PapersOnLine, 49(12), 674-679. Recuperado de https://doi.org/10.1016/j.ifacol.2016.07.788 [ Links ]
[11] King, P. L. (2019).Lean for the Process Industries: Dealing with Complexity(2ª ed.). Nueva York, Estados Unidos: Productivity Press. Recuperado de https://doi.org/10.4324/9780429400155 [ Links ]
[12] Mahapatra, S., y Mohanty, S. (2007). Lean Manufacturing in Continuous Process Industry: An Empirical Study.Journal of Scientific & Industrial Research, 66(1), 19-27. Recuperado de http://nopr.niscair.res.in/handle/123456789/1104 [ Links ]
[13] Marodin, G., Frank, A., Tortorella, G., y Netland, T. (2018). Lean Product Development and Lean Manufacturing: Testing Moderation Effects.International Journal of Production Economics, 203, 301-310. Recuperado de https://doi.org/10.1016/j.ijpe.2018.07.009 [ Links ]
[14] Moreira, A., Silva, F., Correia, A., Pereira, T., Ferreira, L., y de Almeida, F. (2018). Cost reduction and quality improvements in the printing industry.Procedia Manufacturing, 17(1), 623-630. Recuperado de https://doi.org/10.1016/j.promfg.2018.10.107 [ Links ]
[15] Nakajima, S. (1988).Introduction to TPM: Total Productive Maintenance. Cambridge, MA, Estados Unidos: Productivity Press. [ Links ]
[16] Pool, A., Wijngaard, J., y Van Der Zee, D. (2011). Lean planning in the semi-process industry, a case study.International Journal of Production Economics, 131(1), 194-203. Recuperado de https://doi.org/10.1016/j.ijpe.2010.04.040 [ Links ]
[17] Powell, D., Alfnes, E., y Semini, M. (2010). The Application of Lean Production Control Methods within a Process-Type Industry: The Case of Hydro Automotive Structures. En B. Vallespir, T. Alix (Eds.),IFIP International Conference on Advances in Production Management Systems. Berlín, Alemania: Springer, Berlin, Heidelberg. Recuperado de https://doi.org/10.1007/978-3-642-16358-6_31 [ Links ]
[18] Saetta, S. y Caldarelli, V. (2018). The machinery performance analysis with smart technologies: a case in the food industry.IFAC-PapersOnLine, 51(11), 441-446. Recuperado de https://doi.org/10.1016/j.ifacol.2018.08.341 [ Links ]
[19] Saleeshya, P. G., Raghuram, P., y Vamsi, N. (2012). Lean manufacturing practices in textile industries - a case study.International Journal of Collaborative Enterprise, 3(1), 18-37. Recuperado de https://doi.org/10.1504/IJCENT.2012.052367 [ Links ]
[20] Tamayo M. (2003). El proceso de la investigación científica (4a ed.). México D.F, México: Editorial Limusa, S. A. de C. V. Grupo Noriega Editores. [ Links ]
[21] Zarreh, A., Wan, H., Lee, Y., Saygin, C., y Al Janahi, R. (2018). Cybersecurity Concerns for Total Productive Maintenance in Smart Manufacturing Systems.Procedia Manufacturing, 38(1), 532-539. Recuperado de https://doi.org/10.1016/j.promfg.2020.01.067 [ Links ]
Received: August 11, 2020; Accepted: February 05, 2021
 Este es un artículo publicado en acceso abierto bajo una licencia Creative Commons
