


Servicios Personalizados
Revista

Articulo
 texto en
  Inglés (pdf)
 Articulo en XML
 Referencias del artículo
 Enviar articulo por email
Indicadores
-
 Citado por SciELO
Links relacionados
-
 Similares en
SciELO
Similares en
SciELO
Compartir

 Permalink
Industrial Data
versión impresa ISSN 1560-9146versión On-line ISSN 1810-9993
Ind. data vol.24 no.1 Lima ene./jun 2021
http://dx.doi.org/10.15381/idata.v24i1.16734
Production and Management
Electricity as a factor of competitiveness: empirical evidence in the free customer market in the context of Camisea Natural Gas

1Pontificia Universidad Católica del Perú, Lima, Perú. peralta.m@pucp.pe
The exploitation of Camisea natural gas implied benefits for industries with respect to the electricity rates of which they are large consumers. The national electricity market is based on three prices: busbar price, marginal cost, and free customer price. This study aims to establish whether the advantage of the low price of natural gas is reflected in the price for free customers, who are those who can directly negotiate their electricity tariff with the electricity generators or distributors. This was achieved through a time series analysis with econometric models linking the three national electricity market prices, which indicated the correlation between them. A review of the proposed models, their correlational analysis and the autocorrelation analysis of the residuals revealed a strong correlation between free market price and its first lag, which dissociates a correlation with the other prices; therefore, there is no real transfer of the gas price for a better tariff for the free costumer.
Key words: mix; unregulated customers; busbar price; marginal cost; free market price
INTRODUCTION
With the enactment of the Ley de Concesiones Eléctricas2(Law No. 25844, November 19, 1992) the role of the State in the electricity sector changed from one of administration to one of supervision. For this, the roles of existing regulatory entities were reformulated and strengthened, and afterwards others were created with specific tasks. This Law specifies aspects such as the new structure of the sector, existing markets and activities, and price regimes. It also defined the functions and structure of the Comisión de Tarifas Eléctricas3(today known as Gerencia Adjunta de Regulación Tarifaria4, which belongs to Osinergmin), the procedures to be followed for concessions, the rights and obligations of the concessionaires, and the functions of the body in charge of the efficient operation of the system (COES). At the same time, the transactions related to price regulation were defined, as well as the procedures for setting rates.
Although the Electrical Concessions Law disintegrated the state monopoly, the subsequent privatization had to make sure that vertical and horizontal integration did not occur; thus, the law was designed with the assignment of this responsibility to the regulatory agency Osinergmin.
On the other hand, some authors see vertical integration as an advantage because it offers the possibility of sharing synergies and risks (Viscusi, Vernon & Harrington, 2005). Reduced competition, associated with fewer options for consumers and the monopolistic exploitation of a series of specificities such as location, idiosyncratic investments, etc., not only affects the consumer, but also distorts the market. Regarding horizontal concentration, since 2012 the Herfindahl-Hirschman Index (HHI) was less than 1800, which means that this market was moderately concentrated; it should be mentioned that the HHI trend is that of reduction (Cuadros & López, 2016).
The price of electricity for free customers, also called the unregulated price (Morandé & Soto, 1996), is established through the contracts acquired in the negotiation with the bidders, which in this case are the generators and distributors of the electricity market (Dammert, Mollinelli & Carbajal, 2011). Most of these free customers are large companies from the mining, smelting, cement, chemical, metallurgical and industrial sectors, among others. The price these customers pay is of great importance, since it is precisely in this customer segment where, according to the regulation, competition has the greatest potential.
Regulated customers, those whose rates are regulated, are under the protection of Osinergmin, which sets the maximum rates for generation, transmission and distribution. Regulated market prices are related to busbar prices, which is the price that generators or distributors guarantee until a physical busbar or supply point located within their network, and marginal costs. Both busbar prices (Osinergmin, 2017) and marginal cost (Resolución de Consejo Directivo Osinergmin No. 013-2016-OS/CD, 2016) are influenced by fuel value, since it is the cause of the differentiation of technology investment and costs; for example, hydroelectric power plants require a large initial investment with a low value of the "fuel" (dam water) for their operation, while diesel turbogenerators require low capital investment with a higher fuel (hydrocarbon) cost against water resources.
Osinergmin has established that the rate for regulated customers must not differ neither more nor less than 10% of the weighted average of the bid prices in which free customers participate, which means that regulated market prices are sensitive to the free market price (Resolución del Consejo Directivo Osinergmin No. 273-2010-OS/CD, 2010). Thus, it is reasonable to think that if the prices for free customers were manipulated, this would be transferred to the regulated price (De La Cruz & García, 2002). It must be considered that the electricity suppliers in the free customer market can be, and in fact are, energy suppliers in the regulated market. This study is about the way free market prices are behaving with respect to the regulated market prices (regulated price) and whether Camisea gas really contributes to making the free customer sector more competitive.
It is common to hear that Camisea gas has been considered since the beginning an energy source that improves and will improve the economy of the country; however, there has not been a reliable study of its influence on the improvement of production costs in industries, even though it is known that electricity is a supply with great specific weight in the cost of production.
Since electricity is an important supply in the production process of most industries, especially in mining, smelting, refining, etc., this study aims to establish whether the inclusion of natural gas into the new Peruvian energy mix is really contributing to benefit the industry in general and to make it more competitive through lower rates due to the fact that natural gas is a cheaper fuel than other hydrocarbons. It is re-emphasized that the prices established in the electricity market are free customer prices, regulated prices (which depend on the busbar prices and the marginal cost) and the marginal cost. As the busbar price and the marginal cost are strongly influenced by the fuel cost, there is the need to know whether the benefits of a lower gas price are being passed on to free customers.
The objective of this work is to investigate whether natural gas, as a new source in the energy mix, contributes to improve the competitiveness in the Peruvian industry. For this purpose, significant relationships in the electricity market prices that influence the price of the free customer market will be established. This work also aims to determine at how the lagged free customer prices influence the free customer price, and how the current marginal cost and its lags influence the free customer price.
This work seeks to investigate the relationships that occur within electricity market prices. It seeks to establish whether there is a transfer of the benefit of having a cheaper hydrocarbon, such as natural gas, to an industry that intensively uses electricity in its production process. It will also show how the busbar prices, the marginal cost and its lags, including even the free customer price, influence on the free customer price. This research can be extended to other regulated markets such as telecommunications, clean water service and transportation.
METHODOLOGY
Since the influence of Camisea gas development in the free client market is an element of analysis in this research, it is necessary to specify when this hydrocarbon began to be used for thermoelectric generation. The Camisea gas project concluded with the start-up of the Malvinas compressor station and the LNG pumping stations in August 2004 (El Comercio, 2014). The generators that at the date of this study use Camisea gas began operating at the end of 2004, and one of the most important is the Etevensa Plant in Ventanilla, which began operations with a simple-cycle application and in the second half of 2006 was consolidated with the entry of its combined-cycle application. Additionally, the large thermogenerators located in Chilca, which are powered exclusively by Camisea gas, started commercial operation as Kallpa I and Chilca I in 2006 and 2007 with their T1 and T2 gas turbines, respectively. All the data presented above allows to have confidence that the sample to be chosen as the study population is the information referring to the electricity market from 2008 onwards, where the operation, dispatch and the market itself is consolidated and stabilized.
This research is based on the analysis of documents provided by Osinergmin and COES, which are the competent authorities that monitor and prepare the statistics related to the performance of the electricity market in Peru.
The information was collected as follows:
·Free Market Price. Through the website http://srvgart07.osinerg.gob.pe/SICLI/principal.aspx, option “Evolución del Mercado Libre”, menu “Variable”; then option “Precio medio (ctm/S/./kW.h)”; menu “Clasificado por” and then “Mercado Libre”. Lastly, the period to be consulted was seleted.
·Busbar Price and Marginal Cost. Through the website http://www.coes.org.pe/Portal/Publicaciones/Estadisticas/, option “Publicaciones”, followed by “Estadísticas Anuales”; the folder corresponding to year 2017 was accessed, then “01_EXCEL”, “16_COSTOS MARGINALES DE CORTO PLAZO” and finally the file “Gráfico No 16.3_ COSTO MARGINAL PONDERADO Y TARIFA EN BARRA MENSUAL”.
This research is quantitative, inductive, basic, longitudinal, correlational and non-experimental. The units of analysis are taken from the reports of the Peruvian electricity market values obtained through the Portal del Sistema de Usuarios Libres de Osinergmin (Osinergmin Free Users System Portal) (http://srvgart07.osinerg.gob.pe/SICLI/principal.aspx) and the COES portal (http://www.coes.org.pe/Portal/Publicaciones/Informes/).
Three correlational models applied to this study and which link the prices in the Peruvian electricity market are presented below:
-Model 1 ln PLt= a+ b ln PBt+ et
-Model 2 ln PLt =a + b*ln CMgt + et
-Model 3 lnPLt= α+ β*lnPLt-1+ et
Where:
-a, b are coefficients.
-et is defined as a random or stochastic shock.
-ln is the natural logarithm function.
-PLt is the free market price in period t.
-PLt-n is the free market price with lag n.
-PBt is the busbar price in period t.
-CMgt is the natural logarithm of the marginal cost in period t.
If the variability of the data grows with the level of the data, that is, if there are changes in the data that causes that the time series fluctuates vertically from one period to another, (for example, if the minimum and maximum of the series increases or decreases from one year to the next one), it will be necessary to make a correction, since it would represent a problem; this is usually done through a logarithmic transformation, applying natural logarithms to the observations and achieving stationarity in the variance (Chong & Aguilar, 2016).
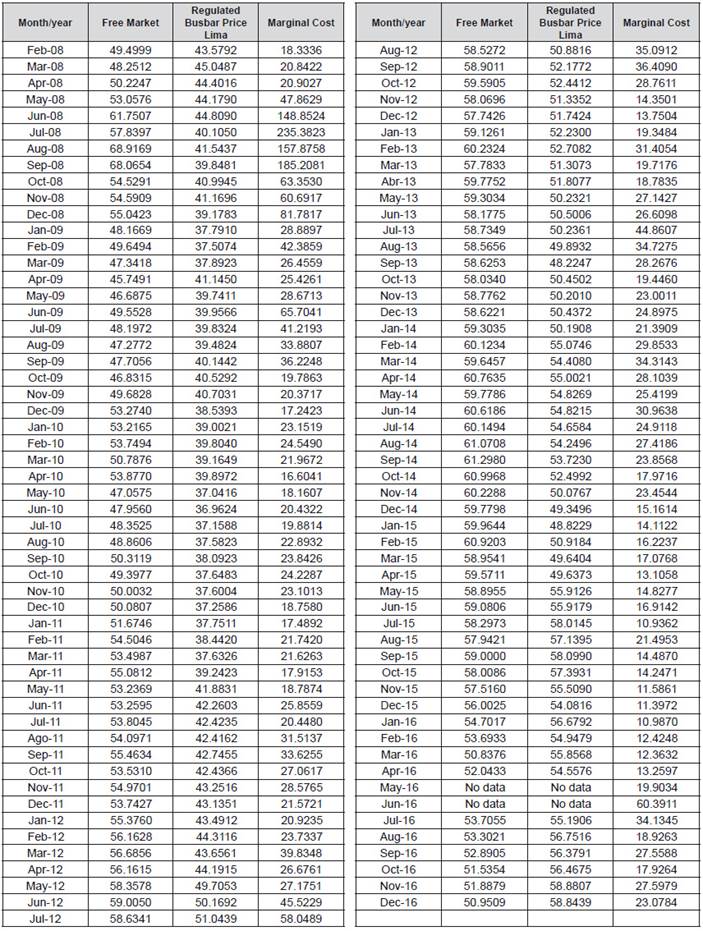
The study population is the Peruvian electricity market, and for the sample size, the prices and costs of the electricity market from February 2008 to December 2016 have been selected. These values are shown in Table 1.
RESULTS
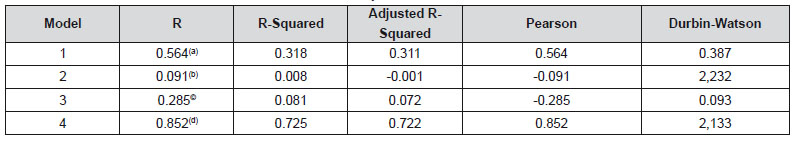
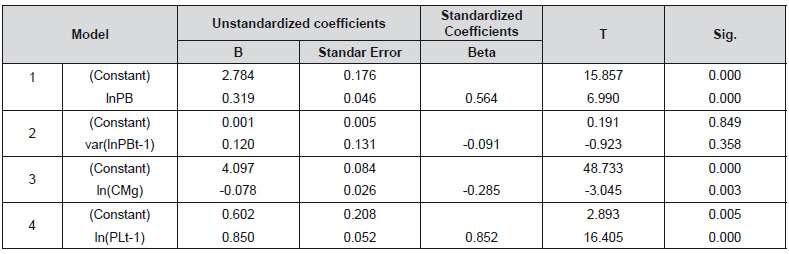
For the correlational analysis, software IBM SPSS Statistics 23 was used and Pearson and R2correlation tests plus Durbin Watson’s correlation test were considered (Daza, 2016). The results of each of the proposed models are shown in Appendix A.
Table 2 shows the values of the coefficients, constants and statistics that were considered for the present evaluation.
Table 2. Results of the Proposed Models in Software IBM SPSS Statistics 23.
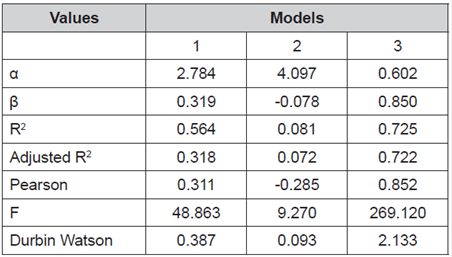
Source: Prepared by the author based on the results of software SPSS.
The Pearson correlation coefficient explains the linear dependence between two quantitative random variables: when its values are closer to 1, a strong relationship between the variables is evident. Of the three models studied, it was observed that the one with the highest correlation with the variables considered for its own case is model three, since it was the one that obtained the highest Pearson correlation coefficient; this result was confirmed by the coefficient of determination R2. This model, confronted with the real values, produces residuals that must also be analyzed to rule out an autocorrelation, thus, if autocorrelation is found among the residuals, there is certainty that the model is not adequate to explain the relationships of the variables and it is presumed that a variable was not taken into account and therefore it must be included. The Durbin Watson is the statistic that shows with certainty if the residuals of the samples are not correlated and, for model 3, this value is in the no autocorrelation area so the model presented produces no autocorrelated residuals and better explains the relationship of the variables under study. The ARIMA model was run as a contrast test to validate the model.
DISCUSSION
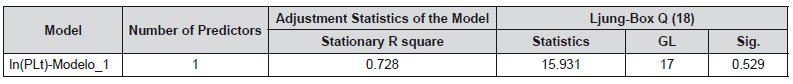
The model proposed must also demonstrate that there is no autocorrelation; for that, the Durbin Watson statistic (DB) provided by SPSS software was used (Gujarati, 1997). According to Table 2, the DB of the model presented is 2.132 and must be compared with the null hypothesis, which indicates that there is no autocorrelation for the values of DB between duand 4-du,which, for 5% significance, gives a value of duequal to 1.694 and a value of 4-duequal to 2.346. Therefore, the null hypothesis of no autocorrelation is validated. The ARIMA model provides a value of the Ljung Box statistic of 0.529, higher than the minimum accepted value of 0.05, so the model is valid.
CONCLUSIONS
There is a decoupling of the free customer price with busbar prices and marginal costs, since although these values are dependent of fuel cost, the free customer price is not related to the price of natural gas. The model that best explains the relationship of the free customer price with electricity market prices is precisely model 3, which links the one-period lagged free customer price; in the study, that period is one month.
Large industries should have the same benefits as the generators that, for example, are able to generate their own energy. Natural gas rates for industrial consumption and for generation are differentiated and, likewise, the largest consumers of gas for generation have better rates. The deconcentration of high voltage lines, thanks to self-generation, can improve the quality of the service, which is quite poor in extreme areas of the lines and, in turn, can be reinforced with the injection of surpluses from industries.
REFERENCES
[1] Chong, M., y Aguilar, R. (2016). Proyección de series de tiempo para el consumo de la energía eléctrica a clientes residenciales en Ecuador.Revista Tecnológica ESPOL, 29(1), 56-76. [ Links ]
[2] El Comercio (30 de abril de 2014). El recorrido de Camisea, un proyecto que esperó dos décadas.El Comercio. [ Links ]
[3] Cuadros, A., y López, G. (2015).Análisis de condiciones de competencia en el mercado de generación eléctrica en el Perú, periodo 2010 - 2014. Recuperado de https://www.coes.org.pe/Portal/Publicaciones/Articulos/ [ Links ]
[4] Dammert, A., Mollinelli, F. y Carbajal, M. A. (2011).Fundamentos Técnicos y Económicos del Sector Eléctrico Peruano. Lima, Perú: Osinergmin. [ Links ]
[5] Daza, J. (2016).Análisis Estadístico SPSS Statistics. Lima, Perú: Megabyte SAC. [ Links ]
[6] De La Cruz, R. y García, R. (Febrero de 2002).Mecanismos de Competencia en Generación de Energía y su impacto en la Eficiencia: El caso peruano. Recuperado de https://cies.org.pe/sites/default/files/investigaciones/mecanismos-de-competencia-en-generacion-de-energia-y-su-impacto-en-la-eficiencia.pdf [ Links ]
[7] Gujarati, D. (1997).Econometría. Sante Fé de Bogotá, Colombia: McGraw-Hill. [ Links ]
[8] Ley N° 25844 (19 de noviembre de 1992). Ley de Concesiones Eléctricas. Diario Oficial El Peruano. Recuperado de https://www.osinergmin.gob.pe/cartas/documentos/electricidad/normativa/LEY_CONCESIONES_ELECTRICAS.pdf [ Links ]
[9] Morandé, F., y Soto, R. (1996).El Mercado de clientes no regulados en la industria eléctrica. ILADES/Georgetow . [ Links ]
[10] Osinergmin (16 de Marzo de 2017).Procedimiento de Fijación de Precios en Barra Periodo mayo 2017 - abril 2018. [ Links ]
[11] Resolución del Consejo Directivo Organismo Supervisor de la Inversión en Energía y Minería Osinergmin N° 273-2010-OS/CD. Aprueban “Procedimiento para la comparación de precios regulados”. Diario Oficial El Peruano (2010). Recuperado de http://www.osinergmin.gob.pe/newweb/uploads/Publico/Resoluciones/ConsejoDirectivo/2010/OSINERGMIN%20No.273-2010-OS-CD.pdf [ Links ]
[12] Resolución de Consejo Directivo Organismo Supervisor de la Inversión en Energía y Minería Osinergmin N° 013-2016-OS/CD. Diario Oficial El Peruano. Recuperado de http://www.osinergmin.gob.pe/Resoluciones/pdf/2016/OSINERGMIN%20No.013-2016-OS-CD.pdf [ Links ]
[13] Viscusi, W., Harrington, Jr., J., y Vernon, J. (2005).Economics of Regulation and Antitrust. Cambridge, MA, Estados Unidos: The MIT Press. [ Links ]
Received: September 26, 2019; Accepted: April 18, 2021
 Este es un artículo publicado en acceso abierto bajo una licencia Creative Commons
