


Servicios Personalizados
Revista

Articulo
 texto en
  Inglés (pdf)
 Articulo en XML
 Referencias del artículo
 Enviar articulo por email
Indicadores
-
 Citado por SciELO
Links relacionados
-
 Similares en
SciELO
Similares en
SciELO
Compartir

 Permalink
Industrial Data
versión impresa ISSN 1560-9146versión On-line ISSN 1810-9993
Ind. data vol.24 no.1 Lima ene./jun 2021
http://dx.doi.org/10.15381/idata.v24i1.19661
Production and Management
Technical efficiency of public universities in Peru

aUniversidad Nacional Mayor de San Marcos, Facultad de Ingeniería Industrial. Lima, Perú. marco.tello@unmsm.edu.pe
bUniversidad Nacional Mayor de San Marcos, Unidad de Posgrado. Lima, Perú. floresjoseovidio@gmail.com
Deficiencies in the quality of higher education are among Peru’s main weaknesses according to the world competitiveness ranking. Therefore, this study determined the technical efficiency (TE) of Peruvian public universities using data envelopment analysis (DEA). In addition, it analyzed the relationships between the experience and education quality of the institutions, and TE. The study covered the 42 public universities registered for 2016, which were measured in terms of one input and two outputs. It was concluded that Peruvian public universities have production functions of constant returns to scale (average OTE = 56.8 %), which served as a basis for classifying institutions into four categories according to their strategic orientations (high or low) towards research or universal education. It was also found that no relationship exists between TE and the experience or education quality of the institution.
Key words: university; data envelopment analysis (DEA); benchmarking; quality; experience
INTRODUCTION
A number of economic theories strongly maintain that the future of a country’s economy depends on the investment in and development of education, science and technology (Abdurakhmanova et al., 2020; Macilwain, 2010), which implies that education is a significant variable in the development of any nation, since human capital is crucial for socio-economic growth and, hence, for sustainable development (Wodon, 2019; Blecich, 2020). Therefore, a country’s education policy must prioritize the enhancement of education quality in all its branches, coordinating public policies to optimize infrastructure, as well as the quality of teacher training and performance, among other important goals (Buckle & Creedy, 2019; Zhao, 2020).
Measuring and improving the efficiency of university performance is considered a relevant topic in developed countries (Kumar & Thakur, 2019; Jiang et al., 2020) and of special interest in public management (Ayaviri & Zamora, 2016). Similarly, public universities in Latin American countries acknowledge the need for changes and adaptation to new trends in higher education worldwide, which increasingly demand greater efficiency and quality in the services offered (Torres et al., 2019).
According to the World Competitiveness Ranking 2019, Peru ranked 65th and its main weaknesses remain in the following pillars: institutions, unlicensed universities, infrastructure, education, and innovation capability, among others (Schwab, 2019). Several authors have also reported deficiencies in Peruvian higher education (Lavalle & de Nicolas, 2017; Nunez & Cornejo, 2018), therefore, this research aims to determine technical efficiency (TE) in Peruvian public universities by means of the mathematical technique known as Data Envelopment Analysis (DEA), used to measure and evaluate the results obtained in productive units by comparing their productivity levels (Sigler, 2004; Rojas, 2010; Torres et al., 2018). Additionally, the existing relationships between the experience and education quality of the institutions, and technical efficiency are determined.
Higher education is of vital importance for the sustainable development of countries, and therefore the efficiency of its system should be considered a priority. In this context, this research aims to determine the technical efficiency (TE) of public universities in Peru; in addition, it intends to analyze the relationship between ET and the experience and education quality of the institutions.
This research study introduces a DEA model with a single input and two outputs that represent the relevant variables for the system analysis, which is particularly useful in contexts of scarce or limited information -very common in developing countries-. An easy-to-use, simple tool called Matrix of strategic orientation towards research and universal education (MOEIM, by its Spanish acronym) is elaborated based on the results of the DEA model, providing a comprehensive view of the positioning of universities in terms of their relative efficiency. The MOEIM provides a comprehensive overview of the positioning of universities in terms of their relative efficiency, which is relevant for guiding decision-making in universities and in the institutions that design and implement public policies focused on higher education. This tool is complemented by the benchmarking plan based on the DEA technique.
Data Envelopment Analysis (DEA)
According to Buitrago et al. (2017), DEA is a technique used to measure relative efficiency in educational organizations; it is important to note that it was first used to measure educational efficiency in North American schools (Rhodes, 1978). Its accuracy in measuring the decision-making unit under evaluation, as well as its inputs and outputs, stands out among its strengths; accordingly, following application of the technique, efficient and inefficient units can be classified, and reference pairs can be assigned to provide guidelines for improving inefficient units and establishing goals for the correct use of resources.
Based on a study on public universities in Spain by Salas-Velasco (2020), DEA is a good instrument for the comparative evaluation of higher education. In our context, by using inputs and outputs, DEA can identify technically efficient institutions that may act as benchmarks for ranking universities; in addition, it allows to identify the factors negatively impacting technical efficiency of the universities under evaluation.
Castañeda (2019) states that DEA is a widespread mathematical programming technique devised by Charnes et al. (1978) and improved by Banker et al. (1984) to evaluate variable returns to scale. DEA generalizes Farrell (1957) single-output/input technical efficiency measure to the multiple-output/multiple-input cases (Charnes et al., 1994; Cooper et al., 2006). Organizations or units that are measured using DEA are referred to as “decision making units” (DMUs) and, according to Cooper et al. (2006), a DMU is considered efficient if no other DMU can produce more outputs using an equal or lesser amount of inputs.
Technical efficiency aims at maximizing the results of the DMU based on the resources used (Campoverde et al., 2019). Thus, a university is efficient when it manages to obtain maximum levels of outputs (or outputs) for a given level of inputs or, alternatively, when it is able to minimize the level of inputs for a given level of output. The main contribution of DEA consists of establishing, empirically or practically, a reference pattern via a production frontier, against which the DMU is compared to determine whether it is efficient or not. Thus a relative efficiency is established, where the estimation of the frontier serves to estimate ET. Farrell (1957) provided a method to calculate and classify efficiency into technical and allocative efficiency, formulating precepts on the constant returns to scale of technology and a convex isoquant to the origin that has a positive slope.
In summary, a production function, which indicates the maximum amount of output generated by each input, must be defined to perform an efficiency analysis. Additionally, the characteristics of the process and the sector to which the DMUs under analysis belong should be outlined.
To associate the production function with the variables that reflect technology and enable the most efficient production of DMUs, such characterization should include the technology applied in the production process, and the inputs and outputs of the system. This approach can be understood in relation to outputs or inputs, so that an output-oriented application (as in this research) would show the maximum production that can be achieved with a particular combination of factors; while an input-oriented analysis would reveal the minimum requirements of inputs, combined in a given proportion, to achieve a specific output level (Escalona, 2013).
Technical efficiency can also be called overall technical efficiency (OTE) and it consists of pure technical efficiency (PTE) and scale efficiency (SE), so that OTE = PTE x SE. Therefore, to determine whether the production technology applied by universities have variable returns to scale, two models are applied: constant returns to scale (CRS), which corresponds to the OTE frontier; and variable returns to scale (VRS), which corresponds to the PTE frontier (Blecich, 2020). Should differences be detected between the two measurements for a particular university, it is assumed that there are scale inefficiencies, which values are attributed to the discrepancy between the CRS and VRS measurements. Thus, the scale efficiency measure is obtained as a result of the quotient between the OTE measure and the PTE measure. In summary, PTE evaluates the university’s technical efficiency as a specific result of the organization’s management without considering the size of the organization (Martin and Roman, 2010), whereas scale inefficiencies are losses caused by failure to operate at the optimal production size. Then, it follows that a university can be technically efficient and still have the possibility to improve its performance if the decision is made to exploit economies of scale (Coelli et al., 1998, p. 4).
Therefore, those universities that achieve values of 100% (or 1) for a given type of performance (CRS or VRS) against which they are being compared will be efficient and, therefore, are considered to be above the production frontier or to be part of it. In contrast, values below 100% (100% > x ≥ 0) denote inefficiencies and, as such, will be located below the production frontier.
Peruvian Higher Education System
Arias (2019) reported that towards the end of 2019, the Superintendencia Nacional de Educación Superior Universitaria (SUNEDU) [3]should have completed the licensing process for the remaining Peruvian universities. Research is one of the indicators of education quality and is a requirement for university licensing. It must be conducted professionally at the universities and, given that there is little research, it constitutes the main difficulty encountered by some universities
In Peru, university education is not compulsory and, hence, represents an educational option for people who graduate from the basic education system and intend to pursue professional, artistic or technical studies (Díaz, 2008). Consequently, the demand for university education can be estimated in terms of the number of people who, after completing secondary school, continue higher education by applying to any educational institution or, more restrictively, in terms of the number of individuals who apply and are admitted.
METHODOLOGY
This is a quantitative, applied research, with a descriptive and correlational scope, and a non-experimental and cross-sectional design. The sample comprised the 42 Peruvian public universities registered for 2016 (Table 1), details of which were obtained from each university’s website and also provided by SUNEDU (2018).
Table 1. List of the 42 Peruvian Public Universities Under Study.
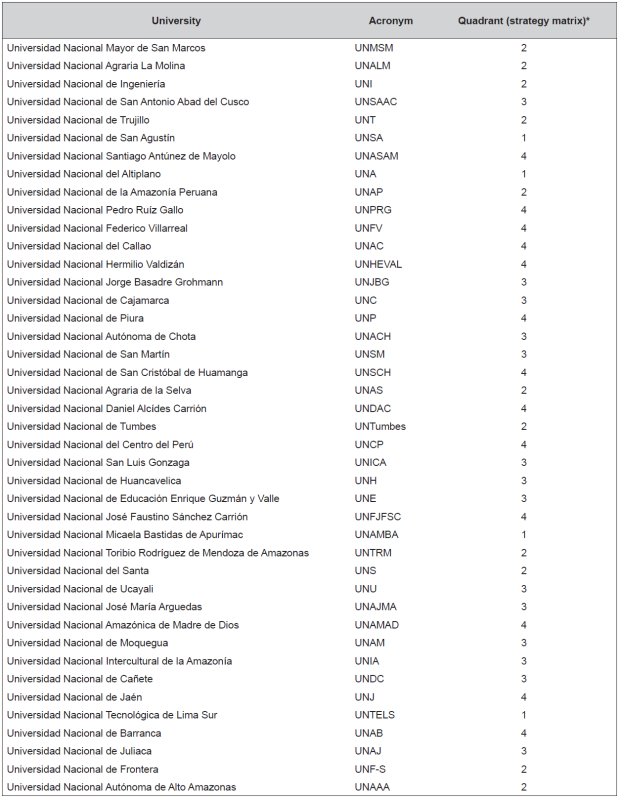
* Classification based on Figure 1.
Source: SUNEDU (2016).
Based on a model proposed by Ramírez and Alfaro (2013), slightly modified to measure the research function, the only input used was the budget in millions (MM) of soles of each university and two outputs: the number of researchers assigned to the Renacyt program (formerly Regina) and the number of undergraduate, master’s and doctoral students enrolled. Other inputs, such as number of professors, have a high correlation with the budget in public universities. Additionally, it was not possible to specify the number of articles per university published in indexed journals because they are not available, as mentioned above.
Variables to be correlated with TE were seniority (years), representing the institution's experience, and educational quality measured with a proxy variable, such as the place occupied by the institution in the ranking of universities by the CSIC (2019), which ranges from 1 to 25000, where 1 is the most desirable score. To establish positive relationships with the OTE, we inverted the ranking values, applying the inverse function (1/ranking), and then determined the percentage of the relative participation of each university (world ranking index) in the total values of the inverse function, which guarantees that the higher the value, the higher the quality of the educational institution.
Data Processing and Analysis Technique
DEA was applied. Arieu (2004) states that this analysis allows for the identification of the “best performance”, thereby making it possible to use the benchmarking technique, as opposed to regression analysis, which is based on “average performance”. In addition to measuring relative efficiency, DEA provides:
An empirical envelope surface, which represents the behavior of the best performers
Anefficient metricto compare results.
Efficient projections on the frontier for each inefficient DMU.
An efficient reference set for each DMU, defined by the efficient units closest to it. (Arieu, 2004, p. 3)
SPSS Statistics 25 software was used for descriptive and correlational analysis, while Frontier Analyst software developed by Banxia Software was used for data processing with the DEA.
RESULTS
Descriptive Statistics for Inputs and Outputs
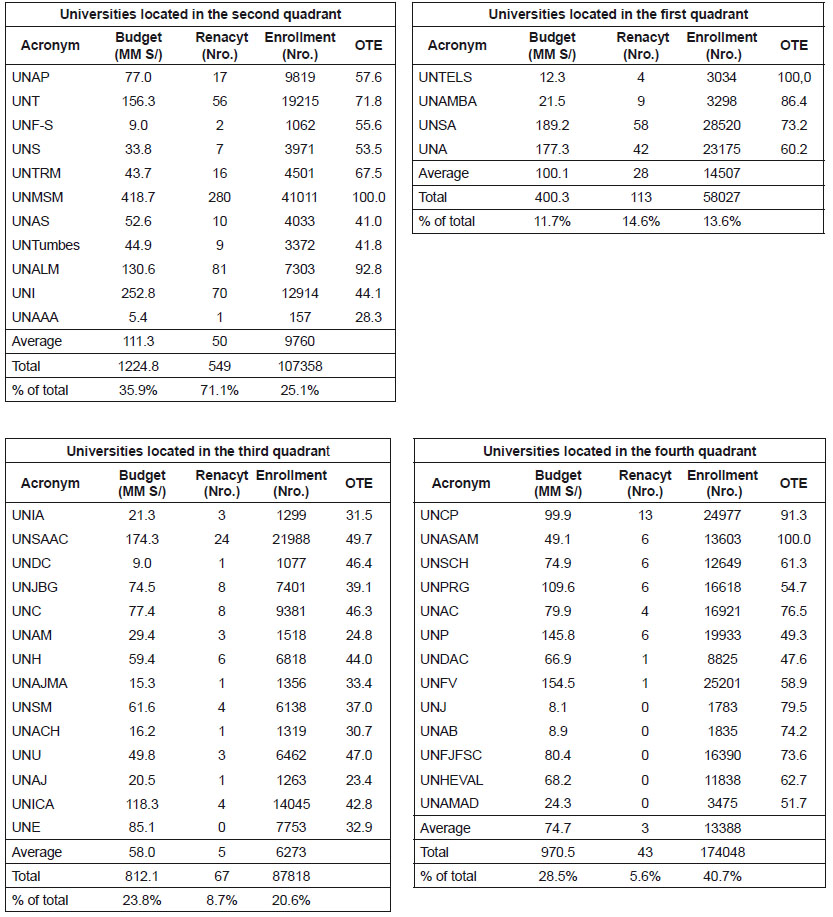
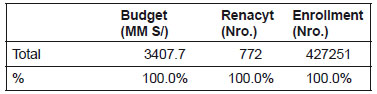
As OTE has a normal distribution (p > 0.05), whereas the PTE and EE values do not (p< 0.05), the Mann-Whitney U test was used to contrast the hypothesis stating that the distributions of the CRS and VRS models come from the same population (Martín, 2006; Martín, 2008). Results show that they are indeed equal (p> 0.05), which is evidence that constant returns to scale prevail in the Peruvian public university education sector. Table 2 presents the results of the OTE, the current levels of inputs and outputs, and the respective benchmarking plan on potential output improvement for 42 Peruvian public universities, as well as the variables that will also be correlated with the OTE.
Table 2. Efficiency, Current Levels and Potential Output Improvement for 42 Peruvian Public Universities and Variables to Correlate with the OTE.
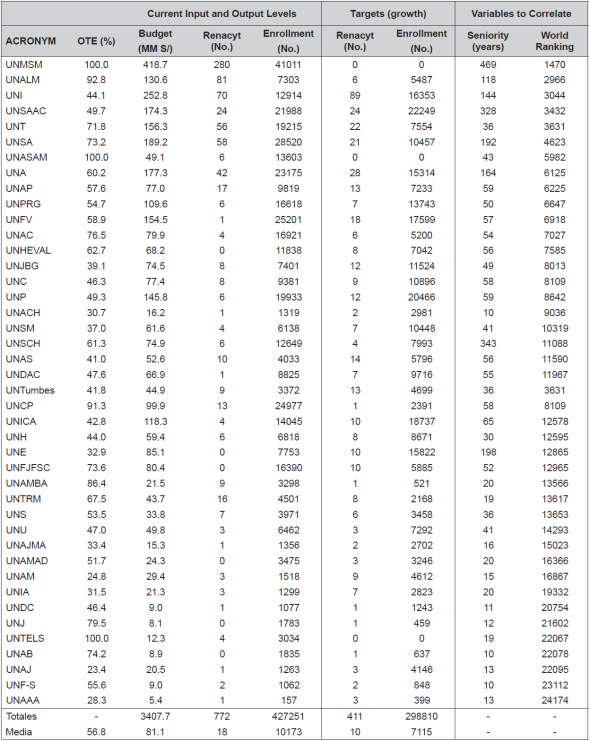
OET: overall technical efficiency; MMS/.: millions of soles; No.: number of individuals.
Source: Prepared by the authors.
Figure 1 shows the Matrix of strategic orientation towards research and universal education (MOEIM, by its Spanish acronym) of 42 Peruvian public universities. This matrix overlaps the graph of the universities’ production frontier, developed by dividing the outputs by the input, so that for each DMU we estimated 1. the number of Renacyt researchers per 100 million soles of budget (Renacyt_100MMSoles on the Y-axis), and 2. student enrollment per million soles of budget (Enrollment/million soles on the X-axis). It is observed that the production frontier line (output-oriented model) links the efficient universities (UNMSM, UNTELS and UNASAM), while the inefficient universities are located below this frontier.
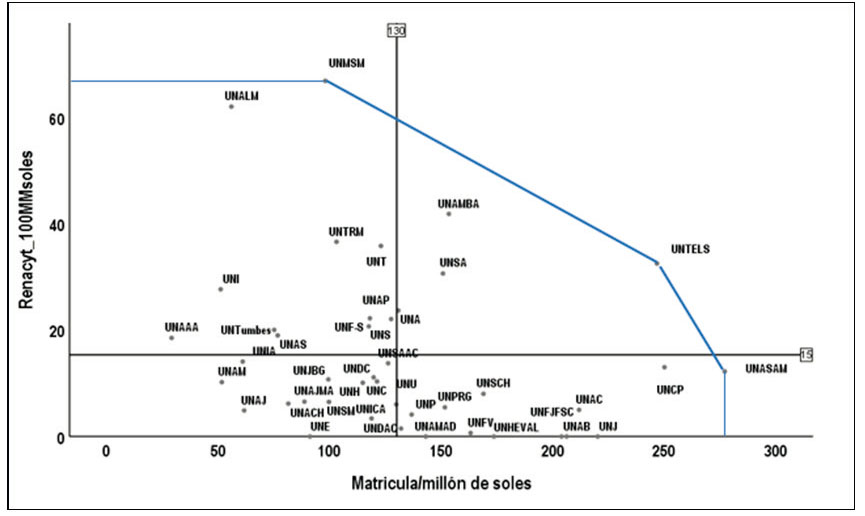
Note: The line joining the three efficient universities represents the production frontier. Source: Preparedby the authors.
Figure 1 Matrix of strategic orientation towards research and universal education (MOEIM) of 42 Peruvian public universities.
The MOEIM was divided into four quadrants based on the average values of each variable analyzed (see Appendix 1). Accordingly, in the case of the Renacyt researchers variable, the institution has a high research orientation (indicative of research quality) when the average value is above the mean and low orientation when it is below the mean. As for the case of the enrollment variable, the institution has a high orientation to universal education (high level of student enrollment) when the average value is above the mean and low when it is below the mean, although it could also be categorized as high and low orientation teaching orientation, as has been done in other countries (Shamohammadi & Oh, 2019).
The first quadrant (upper right) includes research-oriented and universal education-oriented institutions, led by UNTELS. The second quadrant (upper left) includes universities with a high research orientation, with UNMSM and UNALM leading with the highest scores; also, those universities with a low orientation towards universal education are also located in this quadrant. The third quadrant (lower left) includes universities with a low orientation towards both research and universal education, which is the worst case among the four types of performance analyzed. Finally, the fourth quadrant (lower right) includes universities with a low orientation towards research but a high orientation towards universal education, led by UNASAM.
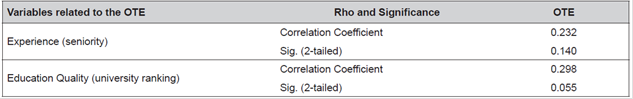
Shapiro-Wilk test statistically corroborated that the variables experience (seniority) and education quality (ranking) of the institution do not have normal distributions (p< 0.05), so they were correlated with OTE using Spearman’s Rho coefficient (Table 3). Results indicate that the TE of public universities in Peru is not correlated to experience or education quality.
DISCUSSION
Research on the education sector and, particularly, on higher education, is of utmost importance in light of the existence of public policy guidelines aimed at improving higher education developed by prestigious international and national institutions such as UNESCO, UNICEF, the World Bank, UNFPA, UNDP (2015) and SUNEDU (Arias, 2019), to name a few. Putting these guidelines into practice would make it possible to capitalize on the great comparative and competitive advantages, as well as to achieve sustainable development in Peru.
Among the main problems encountered when analyzing efficiency in universities is the existence of a wide variety of inputs and outputs in the literature (Huamaní et al., 2016; Nieto, 2016; Blanco et al., 2019; Shamohammadi, & Oh, 2019; Mojahedian et al., 2020), in addition to the difficulties in measuring them in some cases (Gómez, 2010; Ayaviri & Zamora, 2016; Buitrago et al., 2017). It was therefore decided to use the model of Ramírez and Alfaro (2013), slightly modified, to measure the research function. The original model was successfully used in 25 Chilean universities. In this model, other inputs such as teachers, estimated in terms of their salaries, have a high correlation with the budget, thus advising against its use, as it contributes very little to the results. The model was also output-oriented, as is customary in the university sector, due to the fact that, in most cases, inputs are not controlled by the universities studied -this is more evident in public institutions whose main objective is to achieve the best possible value in outputs as they are financed by the State (Buitrago et al., 2017).
Upon justifying the orientation of the model to be used, the production frontiers of the CRS and VRS models were determined, as has been done in previous studies (García & Palomares, 2008; Agasisti et al., 2011; Buitrago et al., 2017). Moreover, the hypothesis according to which Peruvian public universities exhibit production functions of constant returns to scale was accepted. A statistical demonstration of which of the production frontiers was the most appropriate was carried out in this research, just as in Martín (2008); other studies on efficiency have calculated the two types of frontier, failing to demonstrate statistically which one prevails (Haider et al., 2019). This demonstration was based on a nonparametric statistical test which allowed us to prove that CRS prevails, a model that has been employed by other authors (Pino et al., 2010).
Based on the CRS (OTE ratio) and the product-oriented model, a 56.8% of TE was estimated for public universities in Peru during 2016. Although in different contexts, this is a low value compared to that reported by other authors. For instance, Ramírez and Alfaro (2013) reported an average efficiency of 80.89% in public and private universities in Chile. Very similar values were obtained by Navarro et al. (2016) when they applied a DEA model to a group of 32 public universities in Mexico and obtained an OTE of 80.7%.
As for Peru, Nunez and Cornejo (2018) conducted an efficiency study in 42 public and private universities and reported efficiency values of 55.2% and 58.9% for public universities in two out of the four DEA models they evaluated. Such values are higher than those reported for private institutions and are very similar to those obtained in our research, thereby confirming a highly heterogeneous educational sector.
The ET results also enabled the elaboration of a matrix that served as a basis for classifying institutions into four categories according to their strategic orientation (high or low) towards research or universal education. This dichotomy is very present in higher education, especially in Latin America (Cabrera et al., 2014; García de Fanelli, 2017), and, as such, has also been reported in Peru (Lavalle & de Nicolas, 2017; Nunez & Cornejo, 2018).
The relationship between TE of Peruvian public universities and the experience of the educational institution (seniority) was also analyzed; the result obtained by applying Spearman’s Rho correlation test indicates that there is no correlation between TE of Peruvian public universities and experience, a fact that confirms the findings of Coria (2019), who found no relationship between TE of Argentine public universities and the seniority of the same.
Similarly, the relationship between TE of Peruvian public universities and the quality of the institution, based on the university ranking prepared by the CSIC (2019), was also analyzed. Spearman’s Rho coefficient test was found that the TE of Peruvian public universities is not correlated to the education quality of the institution. This result disagrees with those of other researchers who reported a positive relationship between efficiency and university rankings, among them the Shanghai ranking (Blanco et al., 2019), possibly due to the fact that they evaluated the 50 best universities in the world. Likewise, Huamaní et al. (2016) demonstrate the feasibility of this relationship, as the place occupied in the rankings is a solid indicator of education quality (Lavalle & de Nicolas, 2017).
Finally, an improvement plan was proposed based on the DEA methodology and can be applied as a benchmarking tool (Avkiran, 1999; Zhu, 2009, p. 131), particularly in the case of universities (Shamohammadi & Oh, 2019). This plan was sufficiently demonstrated, as efficient universities that would function as leaders (benchmarks) for inefficient universities could be identified.
CONCLUSIONS
Peruvian public universities have constant returns to scale production functions (average OTE = 56.8%), used as a basis for classifying institutions into four categories according to their strategic orientations (high or low) towards research or universal education.
Technical efficiency of Peruvian public universities is not related to the institution's experience.
Technical efficiency of Peruvian public universities is not related to the quality of education.
Restricted access to publications or patents developed by universities is considered a limitation and should be addressed in future research. The data are only available in the institutional portals. More inputs and outputs can also be included, in order to compare the results with those of this model involving few variables and, additionally, it is important to compare public and private education.
REFERENCES
[1] Abdurakhmanova, G., Shayusupova, N., Irmatova, A., y Rustamov, D. (2020). The Role of the Digital Economy in the Development of the Human Capital Market.International Journal of Psychological Rehabilitation, 24(07), 8043-8051. [ Links ]
[2] Agasisti, T., Dal Bianco, A., Landoni, P., Sala, A., y Salerno, M. (2011). Evaluating the Efficiency of Research in Academic Departments: An Empirical Analysis in an Italian Region.Higher Education Quarterly, 65(3), 267-289. Recuperado de https://doi.org/10.1111/j.1468-2273.2011.00489.x [ Links ]
[3] Arieu, A. (2004).Eficiencia técnica comparada en elevadores de granos de Argentina, bajo una aplicación de análisis de envolvente de datos. La situación del puerto de Bahía Blanca. Buenos Aires: Asociación Argentina de Economía Política. Recuperado de https://aaep.org.ar/anales/works/works2004/Arieu.pdf [ Links ]
[4] Arias, P. (2019). La investigación: requisito para el avance de la calidad en las universidades peruanas.In Crescendo, 10(3), 447. [ Links ]
[5] Avkiran, N. (1999). An Application Reference for Data Envelopment Analysis in Branch Banking: Helping the Novice Researcher.International Journal of Bank Marketing, 17(5), 206-220. Recuperado de https://doi.org/10.1108/02652329910292675 [ Links ]
[6] Ayaviri, V., y Zamora, G. (2016). Medición de la eficiencia en las universidades. Una propuesta metodológica. Perspectivas , ( 37), 7-22. [ Links ]
[7] Banker, R., Charnes, A., y Cooper, W. (1984). Some models for estimating technical and scale inefficiencies in data envelopment analysis.Management Science , 30(9), 1078-1092. Recuperado de https://doi.org/10.1287/mnsc.30.9.1078 [ Links ]
[8] Blanco, M., Bares, L., y Hrynevych, O. (2019). Análisis de la eficiencia global de las 50 mejores universidades del mundo.Revista Espacios, 40(9), 30. Recuperado de https://www.revistaespacios.com/a19v40n09/19400930.html [ Links ]
[9] Blecich, A. (2020). Factors Affecting Relative Efficiency of Higher Education Institutions of Economic Orientation.Management: Journal of Contemporary Management Issues , 25(1), 45-67. Recuperado de https://doi.org/10.30924/mjcmi.25.1.3 [ Links ]
[10] Buckle, R., y Creedy, J. (2019). The Evolution of Research Quality in New Zealand Universities as Measured by the Performance-Based Research Fund Process,New Zealand Economic Papers, 53(2), 144-165. Recuperado de https://doi.org/10.1080/00779954.2018.1429486 [ Links ]
[11] Buitrago O., Espitia A., y Molano, L. (2017). Análisis envolvente de datos para la medición de la eficiencia en instituciones de educación superior: una revisión del estado del arte.Revista Científica General José María Córdova , 15(19), 147-173. [ Links ]
[12] Cabrera, A., Pérez, P., y López, L. (2014). Evolución de perspectivas en el estudio de la retención universitaria en los EE. UU.: Bases conceptuales y puntos de inflexión. En P. Figuera (Ed.),Persistir con éxito en la universidad: de la investigación a la acción(págs. 15-40). Barcelona, España: Laertes. [ Links ]
[13] Campoverde, J., Romero, C., y Borenstein, D. (2019). Evaluación de eficiencia de cooperativas de ahorro y crédito en Ecuador: aplicación del modelo Análisis Envolvente de Datos DEA.Contaduría y administración, 64(1), 1-19. [ Links ]
[14] Castañeda, P. (2019).Modelo de medición de la productividad para fábricas de software. (Tesis doctoral). Universidad Nacional Mayor de San Marcos, Lima. [ Links ]
[15] Charnes, A., Cooper, W., Lewin, A., y Seiford, L. (1994). Data Envelopment Analysis: Theory, Methodology, and Application.Kluwer Academic Publishers ,Norwell. [ Links ]
[16] Charnes, A., Cooper, W., y Rhodes, E. (1978). Measuring the efficiency of decision making units.European journal of operational research, 2(6), 429-444. [ Links ]
[17] Coelli, T., Prasada, D. y Battese, G. (1998).An Introduction to Productivity and Efficiency Analysis. Boston, Estados Unidos: Kluwer academic publishers. [ Links ]
[18] Coria, M. (2019). Eficiencia técnica de las universidades argentinas de gestión estatal.Ensayos de Política Económica, 1(5), 44-64. [ Links ]
[19] Consejo Superior de Investigaciones Científicas (2019).Ranking Web de Universidades. Recuperado dehttps://www.webometrics.info/es [ Links ]
[20] Cooper, W., Seiford, L., y Tone, K. (2006). Introduction to Data Envelopment Analysis and its Uses: With DEA-Solver Software and References.Springer Science & Business Media. [ Links ]
[21] Díaz, J. (2008). Educación superior en el Perú: tendencias de la demanda y la oferta. En M. Benavides (Ed.),Análisis de programas, procesos y resultados educativos en el Perú: contribuciones empíricas para el debate(págs. 83-129). Lima, Perú: GRADE. [ Links ]
[22] Escalona, L. (2013). Eficiencia técnica para las universidades públicas venezolanas a través del modelo de análisis de datos envolventes DEA.Revista Científica “Teorías, Enfoques y Aplicaciones en las Ciencias Sociales”, 5(12), 45-62. [ Links ]
[23] Farrell, M. (1957). The measurement of Productive efficiency.Journal of the Royal Statistical Society. Series A, General , 125, 252-267. [ Links ]
[24] García, A., y Palomares, D., (24-26 de setiembre de 2008).Evaluation of Spanish Universities: Efficiency, Technology and Productivity Change[artículo académico]. Prime-Latin America Conference, México D. F., México. [ Links ]
[25] García de Fanelli, A. (2017). Políticas públicas ante la masificación de la educación universitaria: el reto de elevar la graduación, garantizando la inclusión y la calidad. En C. Marquis (Ed.),La agenda universitaria III. Propuestas de políticas y acciones(págs. 167-201). Buenos Aires, Argentina: Universidad de Palermo. [ Links ]
[26] Barbosa, S. (2010).Evaluación de la eficiencia de las escuelas de la Universidad Industrial de Santander aplicando análisis envolvente de datos (DEA). (Tesis doctoral). Universidad Industrial de Santander, Bucaramanga. [ Links ]
[27] Haider, M., Raza, Q., Jameel, S., y Pervaiz, K. (2019). A Comparative Study of Operational Efficiency of Pakistani and Malaysian Islamic Banks: Data Envelopment Analysis Approach.Asian Economic and Financial Review, 9(5), 559-580. [ Links ]
[28] Huamaní, G., Huamaní, S., Salcedo, J., y Fernández, C. (2016). Modelo de Análisis Envolvente de Datos (DEA) para evaluar la eficiencia de las escuelas profesionales de Ingeniería Industrial en el Perú con enfoque de desarrollo sostenible.Tecnia, 26(2), 2-72. [ Links ]
[29] Jiang, J., Lee, S., y Rah, M. (2020). Assessing the Research Efficiency of Chinese Higher Education Institutions by Data Envelopment Analysis.Asia Pacific Education Review, 21(3), 423-440. [ Links ]
[30] Kumar, A., y Thakur, R. (2019). Objectivity in Performance Ranking of Higher Education Institutions Using Dynamic Data Envelopment Analysis.International Journal of Productivity and Performance Management, 68(4), 774-796. [ Links ]
[31] Lavalle, C., y de Nicolas, V. L. (2017). Peru and its New Challenge in Higher Education: Towards a Research University.PloS one,12(8). Recuperado de https://doi.org/10.1371/journal.pone.0182631 [ Links ]
[32] Macilwain, C. (2010). Science Economics: What Science is Really Worth.Nature,465(7299), 682-684. Recuperado de https://doi.org/10.1038/465682a [ Links ]
[33] Martín, R. (2006).La evaluación de la eficiencia técnica. Una aplicación del DEA a la Universidad de la Laguna[artículo científico]. XV Jornadas de la Asociación de la Economía de la Educación. Granada, España. [ Links ]
[34] Martín, R. (2008). La medición de la eficiencia universitaria: una aplicación del análisis envolvente de datos.Formación Universitaria, 1(2), 17-26. Recuperado de http://dx.doi.org/10.4067/S0718-50062008000200004 [ Links ]
[35] Martin, J., y Roman, C. (2010). Evaluating the Service Quality of Major Air Carriers: A DEA Approach.International Journal of Applied Management Science, 2(4), 351-371. [ Links ]
[36] Mojahedian, M., Mohammadi, A., Abdollahi, M., Kebriaeezadeh, A., Sharifzadeh, M., Asadzandi, S., y Nikfar, S. (2020). A Review on Inputs and Outputs in Determining the Efficiency of Universities of Medical Sciences by Data Envelopment Analysis Method.Medical Journal of the Islamic Republic of Iran (MJIRI), 34(1), 34-42. Recuperado de http://mjiri.iums.ac.ir/article-1-6288-en.html [ Links ]
[37] Navarro, J., Gómez, R., y Torres, Z. (2016). Las universidades en México: una medida de su eficiencia a través del análisis de la envolvente de datos con bootstrap. Acta universitaria , 26(6), 60-69. Recuperado de https://www.redalyc.org/jatsRepo/416/41649084008/html/index.html [ Links ]
[38] Nieto, L. (2016).Eficiencia y financiación en las universidades públicas españolas. (Tesis doctoral). Universidad Católica San Antonio de Murcia, Murcia. [ Links ]
[39] Nunez, N., y Cornejo, G. (2018). Haciendo mucho con poco: eficiencia de la investigación científica en el Perú.Revista Espacios, 39(26), 1-7. Recuperado de http://www.revistaespacios.com/a18v39n26/a18v39n26p07.pdf [ Links ]
[40] Pino, J., Solís, M., Delgado, M., y Barea, R., (2010). Evaluación de la eficiencia de grupos de investigación mediante análisis envolvente de datos (DEA).El profesional de la información, 19(2), 160-167. Recuperado de https://doi.org/10.3145/epi.2010.mar.06 [ Links ]
[41] Ramírez, P., y Alfaro, J. (2013). Evaluación de la eficiencia de las universidades pertenecientes al consejo de rectores de las universidades chilenas: Resultados de un análisis envolvente de datos.Formación universitaria ,6(3), 31-38. Recuperado de http://dx.doi.org/10.4067/S0718-50062013000300005 [ Links ]
[42] Rhodes, E. (1978).Data envelopment analysis and related approaches for measuring the efficiency of decision-making unit with application to Program follow through U.S. education. (Tesis doctoral). Carnegie-Mellon University School of Urban and Public Affair, Pittsburgh. [ Links ]
[43] Rojas, M. (2010).Clasificación de los grupos de investigación de la facultad de Ingeniería de la Universidad Nacional de Colombia, mediante la estimación de la eficiencia técnica utilizando análisis envolvente de datos. (Trabajo de grado de maestría). Universidad Nacional de Colombia, Bogotá. Recuperado de https://repositorio.unal.edu.co/bitstream/handle/unal/7466/02-822021.2010.pdf?sequence=1&isAllowed=y [ Links ]
[44] Salas-Velasco, M. (2020). The Technical Efficiency Performance of The Higher Education Systems Based on Data Envelopment Analysis with an Illustration for the Spanish Case.Educational Research for Policy and Practice, 19(2), 159-180. Recuperado de https://doi.org/10.1007/s10671-019-09254-5 [ Links ]
[45] Schwab, K. (Ed.) (2019).The Global Competitive Report 2019. World Economic Forum. Recuperado dehttp://www3.weforum.org/docs/WEF_TheGlobalCompetitivenessReport2019.pdf [ Links ]
[46] Shamohammadi, M., y Oh, D.-H. (2019). Measuring the Efficiency Changes of Private Universities of Korea: A Two-Stage Network Data Envelopment Analysis.Technological Forecasting and Social Change,148, 119730. Recuperado de https://doi.org/10.1016/j.techfore.2019.119730 [ Links ]
[47] Sigler, L. (2004).Aplicación del Data Envelopment Analysis a la producción de investigación económica en la Ciudad de México: La eficiencia relativa del CIDE, COLMEX, IPN, UAM y UNAM (1990-2002)[Ponencia]. 4th International Symposium of Data Envelopment Analysis and Performance Management, Birmingham, England. [ Links ]
[48] SUNEDU (2018).Información estadística de universidades. Recuperado dehttps://www.sunedu.gob.pe/informacion-estadistica-universidades-licenciadas/ [ Links ]
[49] Torres, M., Vásquez, C., Luna, M, Bucci, N., Viloria, A., y Cabrera, D. (2019). Clustering of Top 50 Latin American Universities in SIR, QS, ARWU, and Webometrics Rankings.Procedia Computer Science,160, 467-472. Recuperado de https://doi.org/10.1016/j.procs.2019.11.063 [ Links ]
[50] Torres, M., Vásquez, C., Viloria, A., Borrero, T., Varela, N., Cabrera, D., Gaitán, M., y Gutiérrez, J. (2018). Efficiency analysis of the visibility of Latin American Universities and their impact on the ranking web. En Y. Tan, Y. Shi, y Q. Tang (Eds.),Data Mining and Big Data International Conference on Data Mining and Big Data(págs. 235-243). Cham, Siuza: Springer. Recuperado de https://doi.org/10.1007/978-3-319-93803-5_22 [ Links ]
[51] UNESCO, UNICEF, Banco Mundial, UNFPA, PNUD, O. M. y A. (2015).Declaración de lncheon y Marco de Acción para la realización del Objetivo del Desarrollo Sostenible 4. Unescodoc, 1-84. Recuperado dehttps://unesdoc.unesco.org/ark:/48223/pf0000245656_spa [ Links ]
[52] Wodon, Q. (2019). Measuring the Contribution of Faith-based Schools to Human Capital Wealth: Estimates for the Catholic Church.The Review of Faith & International Affairs, 17(4), 94-102. Recuperado de https://doi.org/10.1080/15570274.2019.1681782 [ Links ]
[53] Zhao, Y. (2020). Transformation of Educational Management Mode in Ocean Colleges and Universities.Journal of Coastal Research,110(1), 67-70. Recuperado de https://doi.org/10.2112/JCR-SI110-017.1 [ Links ]
[54] Zhu, J. (2009).Quantitative Models for Performance Evaluation and Benchmarking. Data Envelopment Analysis with Spreadsheets(3aed.). USA: Springer. [ Links ]
Received: February 25, 2021; Accepted: April 15, 2021
 Este es un artículo publicado en acceso abierto bajo una licencia Creative Commons
