


Servicios Personalizados
Revista

Articulo
 texto en
  Inglés (pdf)
 Articulo en XML
 Referencias del artículo
 Enviar articulo por email
Indicadores
-
 Citado por SciELO
Links relacionados
-
 Similares en
SciELO
Similares en
SciELO
Compartir

 Permalink
Industrial Data
versión impresa ISSN 1560-9146versión On-line ISSN 1810-9993
Ind. data vol.24 no.1 Lima ene./jun 2021
http://dx.doi.org/10.15381/idata.v24i1.19814
Production and Management
Production Line Balancing Model to Improve Productivity in a Tempered Glass Processing Company

1Industrial engineer from Universidad Nacional de Ingeniería. Currently working as Head of Production Planning and Control at Glasstempcorr S.A.C. (Callao, Peru). E-mail: oescalante@glasstempcorr.com.pe
A line balancing model for a tempered glass processing company was developed in this study, aimed at demonstrating how its implementation helps to improve productivity. The model is based on the development of the five steps of the theory of constraints (TOC): identify the constraint, exploit the constraint, subordinate everything to the constraint, elevate the constraint, and check if there is a new constraint. Once the restriction was identified, it was exploited using improvement actions, such as the detection and elimination ofmudas(wastes), and the application of the 5S methodology until a production capacity in line with demand was achieved. As economic investments had to be made, a table with a cost structure before and after the implementation of the model was prepared in order to calculate the return on investment (ROI) value to determine that the investment made promoted the increase in productivity.
Key words: line balancing; productivity; mudas; 5S; theory of constraints
INTRODUCTION
Most companies or organizations in the country apply various improvement theories, techniques and tools in order to increase their productivity; in many cases, this involves imitating improvement experiences that were applied in other companies and resulted in a significant increase in productivity and, consequently, in a competitive advantage over their competitors. The proper implementation of a set of continuous improvement tools is essential to achieve a real change within the organization so as to improve productivity, reduce costs and obtain a higher, sustainable profit margin over time.
The vast majority of companies in the country are SMEs, which lack fully automated production lines, and thus need to correctly balance each workstation in order to maximize the use of their resources. In general, machinery assembly and production line distribution are carried out empirically, without any improvement techniques or tools to capitalize on available resources to increase productivity. Such cases require a set of continuous improvement tools that are adjusted to the economic, spatial and demand needs of each organization.
This study was conducted in a company engaged in the processing of tempered glass used in the architectural sector as part of construction finishes. Most of the machines used for tempered glass processing are made in Italy and are often purchased from different suppliers, for economic reasons or because the supplier does not offer machinery to assemble the entire processing line. This results in different production capacities in the work areas at the time of assembly of the production line.
The purpose of this article is to implement a line balancing model that encompasses the use of continuous improvement and lean manufacturing tools for the entire production line (cutting, edging, notching and furnace areas), to address the company’s problems of low productivity and wasted man-hours resulting from the failure to correctly balance the production capacities of the work areas. Unlike other research and theses where the use of line balancing is developed as an improvement tool to increase productivity based on the development of strategies to balance the processing capacities of each work area, here a “line balancing model”, which is a selection of continuous improvement and lean manufacturing tools that will allow achieving an increase in productivity, will be used.
To balance the tempered glass processing line, a model based on the execution of the 5 steps of the theory of constraints (identify, exploit, subordinate, elevate and repeat) will be used. Lean manufacturing tools (detection and elimination ofmudas) and continuous improvement (5S methodology) will also be used to implement the improvement actions of step 2 (exploit the constraint). As mentioned by Alcalde (2010), the 5S methodology is based on order and cleanliness, as this allows the creation of a new culture within the organization. By using already existing continuous improvement tools in this research, it is possible to state that its use in the development of this line balancing model is expanding.
In order to implement the line balance model, an analysis of the work performed in all areas has to be completed; it includes the review of production reports and shift schedules to determine the time used by the operator for production under normal conditions, at a speed and work rate that should be in accordance with the demand. From this information, the production capacity of each work area under normal conditions is obtained, thus determining which has the lowest capacity and which is the limiting factor in the production line.
In view of the above, the main objective of this research is to determine whether there is a relationship between the implementation of this line balance model and an improvement or increase in productivity in the tempered glass processing company under analysis. The formulation of a hypothesis will be necessary and will subsequently be contrasted against the results to verify if there is a relationship between the model and the increase in productivity. The hypothesis is as follows: “The implementation of a line balancing model will improve the productivity of a tempered glass processing company”.
A cost structure will also be prepared at the start and end of the implementation of the model to analyze the economic impact of the finished product selling price on the company and, finally, the return investment value (ROI) will be calculated to determine if the investment made was beneficial to the company.
Line Balancing
To Salazar (2019), line balancing is a method of great importance to control production, because if a correct balance of the production line is achieved, it will be possible to optimize other variables that influence productivity, including: inventory of parts to be processed, average processing time and partial dispatches of finished parts.
Suñé et al. (2004) state that when designing the production line, the tasks must be distributed so that resources are used throughout the process. The most complicated part of balancing the production line is to divide the process into workstations where a group of tasks will be executed, so that the optimal workload is achieved within the production cycle time. Regarding the latter, García et al. (2004) indicate that the objective of balancing a production line is that each workstation produces the same amount of finished material and has the same production cycle time, in order to prevent the accumulation of load to be processed.
According to Suñé et al. (2004), the steps to initiate line balancing are as follows:
Determine and identify all the tasks that make up the production process.
Determine the standard time necessary for each task.
Determine the necessary resources for each task.
Determine the execution sequence.
Meyers (2000) maintains that bottlenecks can be identified after implementing line balancing. As a result of the variability of demand and the use of machinery of varying capacities, different processing times are required, thus generating dynamic bottlenecks.
A balanced production line requires a correct theoretical application, redistribution of resources and even financial investments.
According to Calampa (2014), balancing the production line helps to:
Reduce and standardize costs.
Develop a bonus structure for achieved productivity level.
Obtain the expected output quantity within the established deadline.
Improve production management.
Increase overall productivity and staff motivation.
Determine times and motions to improve workload distribution.
Eliminate work-in-process inventories and bottlenecks.
Improve process flow between production areas.
Engage workers in the elimination of the 7 wastes ormudasof lean manufacturing (overproduction, waiting times, transportation, processes, inventories, movements and defective products).
Theory of Constraints (TOC)
The term “bottleneck” is found in line balancing. In Goldratt’s (2004) Theory of Constraints (TOC), the concept of “bottleneck” is referred to as the lack of capacity of a workstation to satisfy the demand of a preceding station, thus creating a “constraint”. According to Saidi et al. (2017), these “bottlenecks” determine production capacity. Consequently, the workstation with the lowest capacity among all is generating a negative impact on the total cycle time. For Kikolski (2016), this sets the pace of the production process.
Chase et al. (2009) state that the theory of constraints consists of a set of tools for continuous improvement, which is achieved by applying these 5 steps:
Identify the constraint. This is considered a complicated step, because the entire process must be evaluated in order to detect the activity that restricts the process flow rate. This refers not only to the process, but also to the entire company.
Exploit the constraint. This involves finding methods capable of increasing the capacity of the constraining activity, i.e. increasing the throughput (speed of the system to increase its profits).
Subordinate everything to the constraint. The constraint should operate at 10% of its capacity, since it sets the work pace.
Elevate the constraint. The capacity of the constraint must be increased; the use of financial resources can be considered here.
Check if there is a new constraint. If the initial constraint is eliminated, proceed to repeat the previous steps with the next constraint of the production process.
5S Methodology
According to Hernández (2016), the purpose of the 5S is to improve and maintain order in the work areas; thus, improving working conditions, organizational climate and work performance, which will result in increased productivity and improved product quality.
Seiri(Sort). According to Bonilla et al. (2010), it consists of classifying items into useful and non-useful, keep only those that are useful and remove those that are not because they take up space.
Seiton(Set in order). According to Bonilla et al. (2010), it consists of organizing the sorted items from the previous step, so that they can be easily located, thus saving time and avoiding unnecessary movements.
Seiso(Shine). It consists of cleaning and removing any trash; as mentioned by Rey (2005), the work area should be cleaned to keep it free of dust and encourage the worker to do it daily at the beginning and end of the workday.
Seiketsu(Standardize). It is based on the first three S’s, and its purpose is to avoid delays in the previous stages, and its execution should be part of the daily routine. According to Cuatrecasas and Torrel (2010), standardization involves instilling a habit in workers to comply with the previous steps. A good organization structure and order will be essential to achieve standardization.
Shitsuke(Sustain). According to Dorbessan (2010), it is the most important step because it is responsible for the compliance of the previous 4 S's. It proactively encourages discipline, as the benefits will be beneficial for both the company and the workers. As long as workers are self-disciplined and committed, the company will achieve great results in terms of quality and productivity levels.
Mudas: Wastes
A basic objective of lean manufacturing is to eliminate or reduce the waste ormudasproduced by various tasks that do not generate any value. Socconini (2019) explains that lean manufacturing classifies them into seven groups:
- Overproduction: involves producing more than required.
- Waiting: time wasted when the operator is waiting for the machine to finish the cycle.
- Transportation: useless displacement of people or parts in process that does not generate value.
- Overprocessing: processes that do not increase the value of the final product.
- Inventory: materials, un-finished or finished products that exceed the demand of the commercial area.
- Motion: movements of materials or tools within the process that do not generate value and, on the contrary, increase costs.
- Defects: loss of resources that were used at the time of producing a non-conforming product.
Productivity
For García (2006), productivity is the efficiency level with which the available resources are used to achieve the objectives; he further states that the productivity of a company is examined in order to determine the problems that may affect it and, subsequently, to establish the strategies to solve them.
The ILO (1996) defines productivity as a ratio between the output produced and the input used; it adds that productivity can be affected by different external factors, as well as by deficiencies in its internal activities.
METHODOLOGY
This is an applied research with an experimental design, as the independent variable “line balancing model” is intentionally manipulated, which produces an effect on the dependent variable “productivity”.
Tempered Glass Production Line
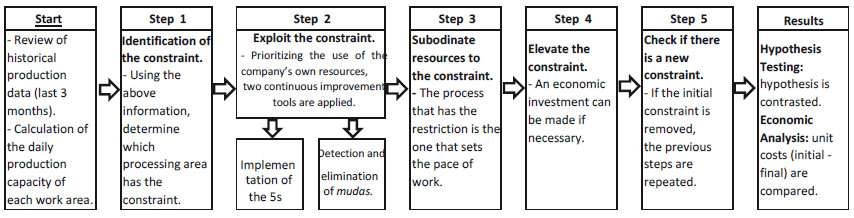
The study was conducted at Glasstempcorr, a company located in the district of Ventanilla. The plant is on a site of approximately 5000 m2and the production line is composed of the cutting, edging, notching, washing and furnace areas. At present, its productivity is not adequate due to poor control of work between areas, reprocessing and waste. For this reason, the implementation of a line balance model based on the 5 steps of the theory of constraints is used as a continuous improvement tool, so that, at the time of implementing the improvement actions, the detection and elimination ofmudasare used in conjunction with 5S methodology in the work area where the restriction is detected. This sequence can be observed in Figure 1.
Evaluation and Implementation of the Theory of Constraints (TOC)
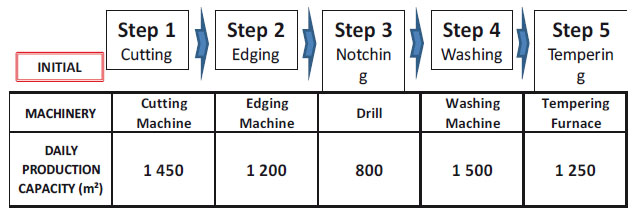
Step 1 is applied. As the historical production data is available, it is possible to obtain the production capacity of each area and an average of square meters of tempered glass processed in the last 3 months. Based on these data, it is possible to determine the area that has the lowest production capacity and, therefore, generates the constraint. In Figure 2, it is shown that the restriction of the line lies in the notching area. At this initial stage, a cost structure can be developed to calculate the unit cost value and compare it with the one obtained after the implementation of the line balancing model.
In step 2, the constraint must be exploited, therefore, actions must be taken to increase the production capacity of the notching area using only the area’s own resources (operators and machinery). Two continuous improvement tools, which are part of the proposed model, are applied in parallel; the first was the implementation of the 5S. Prior to implementation, a baseline was determined, abnormal conditions were photographed and a score was assigned to each category (sorting, order, cleanliness, standardization and maintenance) to determine the issues to be corrected. The Quality Manager, with the support of the area managers, directed the implementation, which consisted of three phases: in the first phase, the personnel involved were trained and informed; in the second phase, the methodology was implemented; and in the third phase, a follow-up of the previous implementation was conducted.
The second tool is the identification and elimination of themudasthat exist within the production process, which is used in lean manufacturing. When analyzing the notching process,mudasrelated to waiting times caused by lack of information on the work to be performed and stops due to unscheduled maintenance were found; a considerable percentage of defective products is also detected, resulting in waste of raw material and man-hours. Action plans must be developed to reduce this waste, such as preparing in advance all the information on the work to be performed, improving the monthly preventive maintenance program, and training personnel to reduce defective products due to mishandling. Once the improvement actions have been implemented, the production line will be balanced, as shown in Figure 3.
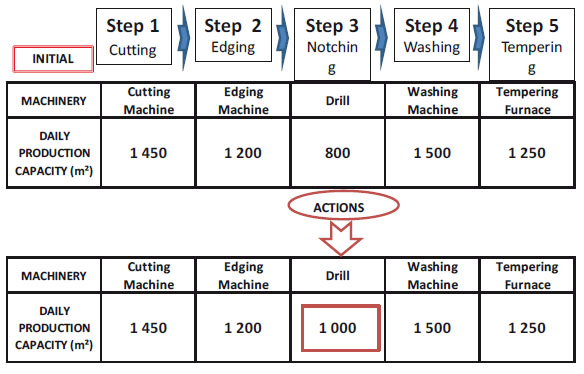
Source: Prepared by the author.
Figure 3 Production capacity values after implementation of improvement actions from step 2.
Step 3 consists of subordinating everything else to the current capacity of the constraint, in other words, the notching area sets the work pace and, consequently, the resources used in all other production areas (operator and machinery) must be rationed to achieve a capacity that slightly exceeds that of the notching area so as to achieve a homogeneous processing capacity throughout the line. Often managers must be convinced of the need to reduce the work pace in other areas that generate excess production; therefore, it is important to have the support of management for this step.
Step 4 consists of elevating the restriction, for which an economic investment will be needed to acquire a hand drill and hire 2 operators, which will increase the capacity of the notching area to 1300 m2, as shown in Figure 4.
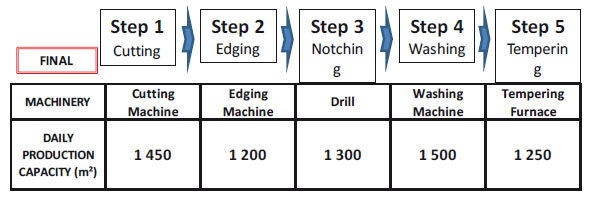
Step 5 consists of checking whether the limiting process has been eliminated. In this case, it can be seen that the notching area is no longer a constraint but the edging area is; therefore, the previous steps need to repeated until obtaining a production capacity in accordance with the demand posed by the commercial area.
RESULTS
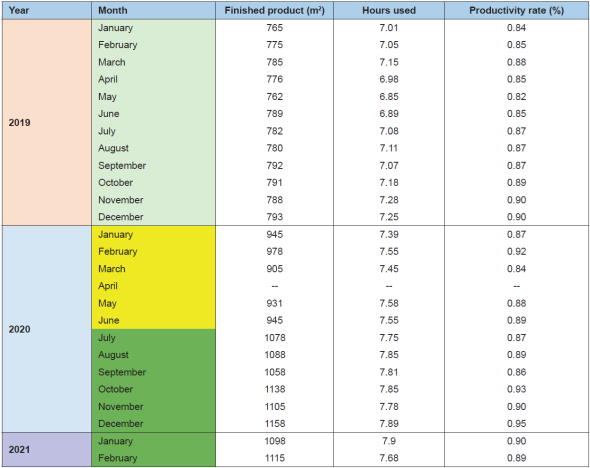
The line balancing model allows comparing the production capacity before and after its implementation. In this research, a contrast of the hypothesis will be carried out first, which consists of determining if the productivity of the tempered glass production line was increased. For this purpose, information on the production from January 2019 to February 2020 is presented in Table 1, detailing the productivity rate during the months in which the line balance model was applied. The productivity rate before the implementation of the line balance model can be seen in the data presented for 2019. From January to June 2020, an increase in the productivity rate following the implementation of the first improvement actions using the area’s own resources is observed. It is important to bear in mind that in March the plant only operated until the 16th and no production was reported in April as the plant was closed due to the COVID-19 pandemic. Finally, other productivity rate values were obtained between July 2020 and February 2021 after the application of step 4 of the Theory of Constraints (TOC).
Hypothesis Testing
To test the hypothesis, productivity data is extracted from Table 1 and run in Minitab 18 to determine whether or not the data has a normal distribution.
The following graphs of the productivity comparison at the beginning and after the implementation of the model are extracted from Minitab 18.
Source: Prepared by the author
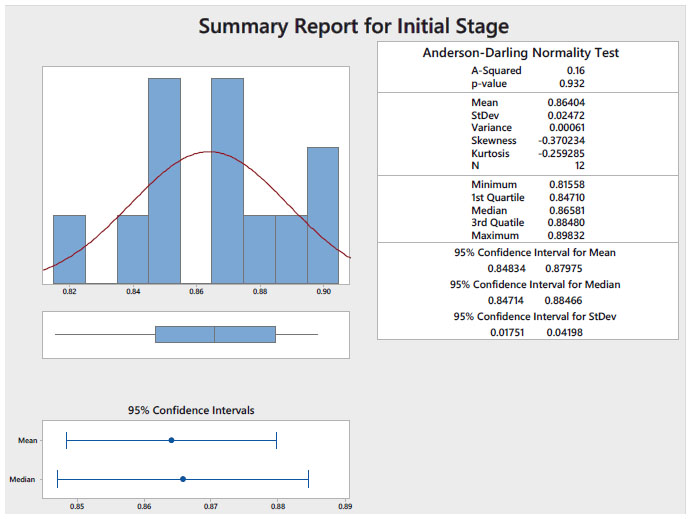
Figure 5 Graph of the normality distribution of the productivity values at the beginning of the implementation.
Source: Prepared by the author.
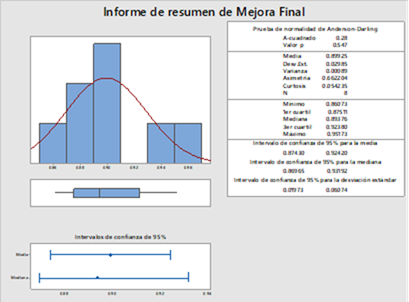
Figure 6 Graph of the normality distribution of productivity values after model implementation.
It is determined from the normality test that the distribution is normal because thep-value is greater than 0.05, the curve is bell-shaped and, if a vertical line is drawn, it intersects the mean and median.
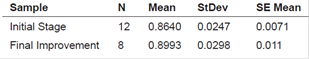
Upon determining that, for the information collected, the data has a parametric behavior, the Student’s t-test for two samples is used to compare the productivity at the beginning and at the end of the implementation of the model and to demonstrate the hypothesis.
Two-Sample T-Test and CI: Initial Stage and Final Improvement
Method
μ₁: mean of Initial Stage
µ₂: mean of Final Improvement
Difference: μ₁ - µ₂
Equal variances are not assumed for this analysis.
Descriptive Statistics
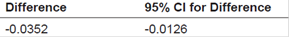
Estimation for Difference
Test
Null hypothesis H0: μ₁ - µ₂ = 0
Alternative hypothesis H₁: μ₁ - µ₂ < 0
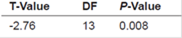
If ap-value ≥ 0.05 is obtained, H0will be accepted as a valid answer; however, if ap-value < 0.05 is obtained, Hawill be accepted and H0will be rejected.
As thep-value is less than 0.05, the null hypothesis is rejected and the alternative hypothesis is accepted, which indicates that the difference µ1-µ2 < 0, thus demonstrating that the productivity percentage increased as of July 2020. Therefore, this comparison proves that the hypothesis stating that “The implementation of a line balancing model will improve the productivity of a tempered glass processing company” is correct.
Economic Analysis
A comparative analysis of the average unit costs at the beginning and after the implementation of the 5 steps of the TOC will be conducted. Table 2 shows the cost structure at the beginning of the study.
Table 2 Initial Cost Structure for Step 1. Cost Structure - Initial Conditions. Average values for a demand of 800 m2
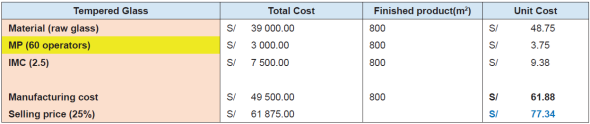
IMC = Indirect manufacturing cost equal to 2.5 times the cost of man power (MP).
Source: Prepared by the author.
Based on the table above, unit selling price per square meter is S/ 77.34 or $ 21.48 ≈ $ 22.00, which is the current market price per square meter for an 8 mm thick glass, this calculated for a line production capacity of 800 m2. Table 3 shows the resulting cost structure after the application of step 4.
Table 3 Cost Structure After Step 4. Cost Structure - Final Conditions. Average values for a demand of 1200 m2. A hand drill was acquired and two operators were hired.
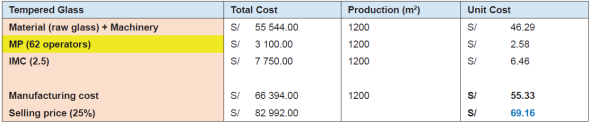
IMC = Indirect manufacturing cost equal to 2.5 times the cost of man power (MP).
Source: Prepared by the author.
Based on Table 3, unit selling price per square meter has decreased to S/ 69.16 or $ 19.21 ≈ $ 20.00 for an 8 mm thick glass, this calculated for a line production capacity of 1200 m2. The cost of the acquired machinery (1 drill) has been included in this table and its value has been distributed for a 5-year service life. The amount of the final selling price is below the market price, allowing the company to offer the customer a price below the market price without affecting profit.
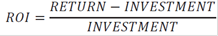
A return on investment analysis is carried out in the notching area to determine how profitable it was for the company. From the values obtained in Tables 1 and 2, Table 4 is prepared to determine the ROI value using the formula shown below.
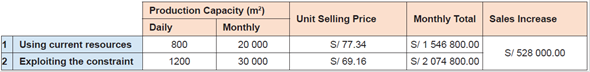
G = S/ 528 000.00 Return
I = S/ 422 350.00 Investment
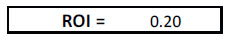
It can be deduced from the result that for every sol invested in this line balancing model, S/ 0.20 profit will be obtained, which makes the project profitable.
DISCUSSION
This line balancing model is structured around the execution of the 5 steps of the theory of constraints. On this basis, a series of improvement actions were identified upon the application of step 2, using only the own resources of the analyzed area in which the restriction was detected, and no additional economic investment. In order to carry out the improvement actions, elimination ofmudas -waste detected in the notching area-, was contemplated. The 5S were also implemented, with an emphasis on the first three, due to the low score obtained in the baseline report. During the implementation of the 5S methodology, the Quality Manager appointed the people in charge of the “notching” production area (one for each shift: day and night), who are in responsible for distributing tasks to 5 operators. For Vargas (2002), appointing a person in charge is important because it helps with the continuous compliance of this tool and also contributes to the integration and training of the workers.
The line balancing model (independent variable) applied influenced productivity (dependent variable), in view of the fact that the hypothesis was validated by means of statistical software. After the analysis of the final cost structure, a unit selling price of S/ 69.11 was obtained, which is lower than the unit selling price of the initial cost structure, S/ 77.34. This outcome benefits the company because the product can be offered at a below-market price, thus allowing it to attract more customers while maintaining its profit margin. The production line will be balanced at a capacity of 1200 m2, which represents an increase of 400 m2over the initial capacity; this line balance allowed the company to take advantage of the area’s resources: use and availability of the machinery, and time used by the operators.
Niebel and Freivalds (2004) believe that the possibility for a business to grow and increase its profits lies in increasing its productivity. Such productivity improvement translates into an output increase during the working hours employed, as evidenced at the end of the application of step 4 of TOC, where the production capacity increased after investment and implementation of improvement actions.
Andrade (2011) believes that it is easier to measure the benefits that the acquisition of a tangible asset (machinery) generates for the company, than to evaluate investments when the acquired asset is related, for example, to the hiring of personnel. In this study, it was easier to determine profitability because a large part of the investment consisted of the acquisition of a drill and hiring only 2 additional workers.
CONCLUSIONS
To implement the line balancing model, this study relied on the execution of the 5 steps of the theory of constraints; good results were obtained by using lean manufacturing tools, such as the detection and elimination of wastes ormudas, and continuous improvement tools, such as the 5S methodology. These tools were jointly applied in the improvement actions established in step 2 of the theory of constraints.
To properly implement the 5S methodology in the notching area and achieve an acceptable score in a final audit, it is very important to train the area’s production manager, who will guide and engage the personnel in charge of the area to meet the objectives set.
Based on the results obtained after the implementation of the line balancing model and the demonstration of the hypothesis, productivity was indeed improved, as the improvement actions made it possible to better capitalize on the area’s resources and obtain a greater production capacity and, consequently, lower production costs, as can be observed in the final cost structure.
As for the analysis of this study, ROI value of the implementation of the line balancing model can be measured, according to which positive results were obtained in terms of profitability.
This line balancing model could be applied to other organizations within the same industry, as most tempered glass manufacturing companies in the country (7 in total) tend to have low productivity in their production processes. This happens because their production lines are very similar and have the same type of machinery and distribution of operators; therefore, they would have the same initial conditions and an increase in productivity could be achieved after the application of the line balancing model, considering that it was beneficial for this case study.
RECOMMENDATIONS
The tempered glass production line should be analyzed continuously, taking as a reference the line balancing model proposed to timely eradicate new constraints that may arise in the production line and thus prevent it from becoming a limitation.
Production capacities of each production area should not be balanced individually; the goal should be to obtain a production flow equivalent to that required by the demand of the commercial area.
Lean manufacturing and continuous improvement tools, such as the detection and elimination ofmudasand the 5S methodology, which were used in the line balancing model, can be applied. All these tools can also be applied in other areas of the company, such as maintenance, warehouse, office, etc., to obtain positive results.
Constant training of the workers (area managers) who will support the implementation of 5S technology is important, as they maintain direct contact with the operators assigned to their work shift and are the ones who operate the machines.
REFERENCIAS BIBLIOGRÁFICAS
[1] Alcalde, P. (2010).Calidad. Madrid, España: Paraninfo. [ Links ]
[2] Andrade, A. (2011).Análisis del ROA, ROE y ROI. Contadores y Empresas, (170). Recuperado dehttp://hdl.handle.net/10757/608313. [ Links ]
[3] Bonilla E., Díaz B., Kleeberg, F., y Noriega, M. (2010).Mejora continua de los procesos: herramientas y técnicas. Lima, Perú: Fondo Editorial de la Universidad de Lima. [ Links ]
[4] Calampa S. (2014).Aplicación de la Línea de Balance en el Sistema Last Planner en Proyectos de Edificaciones. (Tesis de pregrado). Pontificia Universidad Católica del Perú, Lima. [ Links ]
[5] Chase, R., Jacobs, F. y Aquilano, N.( 2009 ). Administración de operaciones: Producción y cadena de suministros. México: McGraw Hill. [ Links ]
[6] Cuatrecasas L. y Torrell F. (2010).TPM en un entorno de Lean Management: Estrategia competitiva. España: Editorial Profit. [ Links ]
[7] Doberssan, J. (2010).Las 5S, Herramientas del cambio .Argentina: Editorial Universitaria de la Universidad Tecnológica Nacional. [ Links ]
[8] García, J., Alarcón, F. y Albarracín, J. (2004).Problemas resueltos de diseño de sistemas productivos y logísticos. Valencia, España: Universidad Politécnica de Valencia. [ Links ]
[9] García, R. (2006).Estudio del Trabajo: Ingeniería de métodos y medición del trabajo. México: Editorial McGraw Hill. [ Links ]
[10] Goldratt, E. (2004).La Meta. México: Ediciones Castillo. [ Links ]
[11] Hernández, J. A. (2016).Propuesta de Implementación de la herramienta de mejora continua 5S en los almacenes de los talleres aeronáuticos de reparación en Bogotá D.C - Colombia. Recuperado de http://hdl.handle.net/10654/15453 [ Links ]
[12] Kikolski, M. (2017). Identification of production bottlenecks with the use of Plant Simulation software.Engineering Management in Production and Services, 8(4), 103-112. [ Links ]
[13] Meyers, F. (2000).Estudio de tiempos y movimientos. México: Pearson Educación. [ Links ]
[14] Niebel, B., y Freivalds, A. (2004).Ingeniería Industrial: métodos, estándares y diseño del trabajo. Edición. México: Alfaomega Grupo Editor S.A. [ Links ]
[15] OIT (1996).Introducción al estudio del Trabajo. Ginebra, Suiza. Editorial Limusa. [ Links ]
[16] Saidi, R., Soulhi, A., y El Alami, J. (2017). The role of the overall equipment effectiveness as a decision support tool for structuring the roadmap of a TFS transformation (Constraint theory, safety of operation, and six sigma).Journal of Theoretical and Applied Information Technology, 95(15), 3441-3449. [ Links ]
[17] Salazar, B. (16 de junio de 2019).Balanceo de línea. Recuperado dehttps://www.ingenieriaindustrialonline.com/produccion/balanceo-de-linea/. [ Links ]
[18] Socconini, L. (2019).Lean Manufacturing: paso a paso .España: Editorial Marge Books. [ Links ]
[19] Suñé, A., Gil, F., y Arcusa, I. (2004). Manual práctico de diseño de sistemas productivos .Madrid, España: Ediciones Díaz de Santos. [ Links ]
[20] Rey, F.(2005).Las 5S: orden y limpieza en el puesto de trabajo. Madrid, España: FC Editorial. [ Links ]
[21] Vargas, H. (2004).Manual de implementación del programa 5S. Colombia: Corporación Autónoma Regional de Santander. [ Links ]
Received: March 03, 2021; Accepted: May 25, 2021
 Este es un artículo publicado en acceso abierto bajo una licencia Creative Commons
