


Services on Demand
Journal

Article
 text in
  English (pdf)
 Article in xml format
 Article references
 Send this article by e-mail
Indicators
-
 Cited by SciELO
Related links
-
 Similars in
SciELO
Similars in
SciELO
Share

 Permalink
Industrial Data
Print version ISSN 1560-9146On-line version ISSN 1810-9993
Ind. data vol.24 no.2 Lima July/Dec. 2021 Epub Dec 31, 2021
http://dx.doi.org/10.15381/idata.v24i2.18942
Production and Management
Design and Implementation of the Balanced Scorecard (BSC) to Improve Business Management in a Lima-based Company that Manufactures Ink for the Graphic Sector

2 Bachiller in Industrial Engineting from Universidad Nacional Mayor de San Marcos. Currently working as an independent consultant. (Lima, Peru). E-mail: hperaltal@unmsm.edu.pe
This article presents the research conducted in a small-size Peruvian enterprise with economic, financial and sustainability problems. The balanced scorecard (BSC) was designed and implemented in the company under study as a new business management model. To this end, an internal and external analysis of the company was carried out; the vision, values, objectives and strategic indicators were established; and the owners and collaborators were involved in the implementation of the strategic initiatives. The results obtained from the design and implementation of the BSC showed that sales increased and the profit margin improved compared to the same period of the previous year.
Keywords: Balanced Scorecard; business management; sales; profitability.
INTRODUCTION
According to the report “Perú: Estructura Empresarial, 2016” by Instituto Nacional de Estadística e Informática (2017), 94% of the total number of companies in Peru are micro-enterprises and 4% are small enterprises. All these companies face an increasingly competitive and dynamic business environment. Business management systems, business models, emergence of new local and/or external competitors, changes in customer preferences, technological effects on the supply chain and production processes, etc., are some of the factors that determine the level of productivity and the ability of companies to compete successfully in the market. Most companies that fail to adapt to these changes are forced out of the market or experience reduced profitability levels that hinder their growth.
Operating in this new competitive and dynamic environment, business owners and managers must implement an adequate business management system that provides direction to the company in the short, medium and long term. An understanding of the ultimate goal of the company makes it possible to determine objectives, develop strategies, seek the best human talent available in the market, and set up an effective system for measuring performance and economic and financial results. As Suárez-Espinar (2018) states:
La gestión empresarial es un rasgo principal que debe tener todo hombre de negocios. La misma dentro del sistema empresarial es un instrumento fundamental para su progreso económico, ya que representa la dinámica de una economía de mercado, que es la que garantiza que la oferta cubra a la demanda en distintas actividades productivas, creando conjuntamente procedimientos que hacen que los costos bajen continuamente y beneficien al consumidor [Business management is a key feature that every businessman is expected to master. Within the business system, it is a fundamental instrument for economic progress as it represents the dynamics of a market economy, which guarantees that supply meets demand in different productive activities, jointly creating procedures that constantly lower costs and benefit the consumer]. (p. 45)
Similarly, Aguilar (2018) emphasizes that “Los sistemas de gestión permiten a las empresas desarrollar sus actividades de una forma coherente y estructurada que se orienta al logro de la mejora continua que beneficia a la organización en términos competitivos [Management systems allow companies to carry out their operations in a coherent and structured way, focused on achieving continuous improvement that benefits the organization in competitive terms]” (p. 26).
A common characteristic that many small-size Peruvian enterprises share is the lack of a business management model that allows them to improve their productivity and competitiveness. The Balanced Scorecard (BSC) is a modern and effective tool for improving the business management of any profit and non-profit company, so its study is relevant for the improvement of business management and production lines. According to Córdova (2008):
El Balanced Scorecard proporciona una serie de medidas diseñadas para unir la brecha entre la gran visión de la empresa y las acciones del día a día de los empleados. Ayuda a asegurar que los sistemas internos y los procesos estén orientados hacia la satisfacción del cliente y el desempeño financiero [The Balanced Scorecard offers a series of measures designed to bridge the gap between the company’s grand vision and employees’ everyday actions. It helps ensure that internal systems and processes are oriented toward customer satisfaction and financial performance]. (p.89)
This study was carried out in a small-size family business with more than 10 years of experience as a supplier of ink for the Peruvian graphic industry. This company had no business management system in place; in recent years, it experienced serious problems increasing its sales volumes and achieving economic and financial sustainability. Considering the problematic situation of the company, to what extent will the implementation of the BSC improve the management of the company under study?
The objective of this study is to improve business management, which would be reflected mainly in the increase in sales and profitability of the company in the short and medium term. The following general hypothesis was formulated based on the above: The design and implementation of the BSC improves the business management of the company under study. The following specific hypotheses were also proposed:
HE1: The design and implementation of the BSC improves business management in terms of sales growth of the company under study.
HE2: The design and implementation of the BSC improves business management in terms of profitability of the company under study.
This research provides new knowledge through the methodology used and the results obtained from the design and application of the BSC in the company under study. Specifically, in the field of strategy and management of small industrial companies, such knowledge is novel and can be replicated in companies with similar characteristics.
This research is justified in a pragmatic way as its main beneficiaries are the company in general and its owners and workers in particular. It is also justified in a theoretical way as it delves into the field of management and the various management tools, such as the strategic plan, the analysis of the macro and micro business environment, the structure and strategic management of companies, and the BSC, among others. The methodology used, and the findings, conclusions and recommendations obtained may have a positive impact on the company under study in the short and medium term. It may also serve as a benchmark for other research with similar characteristics, and/or may be replicated in other Peruvian companies of equal, smaller or larger size in either the same or a different economic sector.
The study, design and implementation of the BSC were supported by the owners and collaborators of the company; nevertheless, the company’s name will not be disclosed for reasons of confidentiality.
THEORETICAL FRAMEWORK
To address the BSC, the emergence of management theory within the history of social disciplines must be reviewed. In this regard, there are several definitions of management, one of which is that of Fayol (1916), who states that “Management is to forecast, to organize, to command, to co-ordinate and to control” (p. 7). Koontz, Weihrich and Cannice (2012) define it as “the process of designing and maintaining an environment in which individuals, working in groups, efficiently accomplish selected aims” (p. 4).
Management sciences have evolved under several approaches such as the classical approach, the humanistic approach and the neoclassical approach. Following the end of World War II, business managers began to stress the importance of factors they could not control and affected the company, such as uncertainty, risk, instability and the ever-changing environment. This led to the emergence of strategic planning. In the 1990s, strategic management emerged, based on the theoretical and academic sources of strategic planning. For David (2008), strategic management involves thinking about the future (strategic planning) and creating the future (responding quickly by being flexible, creative and innovative). The BSC emerged in the United States, within modern, strategically-managed organizations as a successful method of business management. Its creators were Robert Kaplan, a Harvard University accounting professor, and David Norton, a business consultant at Nolan Norton. In 1990, Kaplan and Norton became convinced that financial measures of business activity were becoming obsolete; this insight prompted them to conduct a study to analyze new methods for measuring performance and results. A dozen heavy industry and high-tech companies participated in this study called “Measuring Performance in the Organization of the Future: A Research Study”.
Kaplan and Norton (2000) state that the BSC evolved from a system of indicators improved to measure performance, to become a central management system; they point out that “The balanced scorecard provides executives with a comprehensive framework that translates a company’s vision and strategy into a coherent set of performance measures” (p.37).
The BSC has been used by manufacturing, service, profit and non-profit, public and private companies both in developed and developing countries. As years passed by, the BSC evolved into a management tool. Initially, it was used for two purposes: measuring the work performed by the company and, later on, for implementing the company’s strategy.
According to Niven (2003), “The core elements of any effective Balanced Scorecard are mission, values, vision, and strategy” (p. 17). He adds that “The Balanced Scorecard translates our vision and strategy into a coherent set of measures in four balanced perspectives” (p. 44).
Kaplan and Norton (2000) add that, “Además de una visión compartida, el Cuadro de Mando Integral establece un modelo común de actuación y comunica un enfoque holístico a la vinculación de esfuerzos y logros individuales con los objetivos de la unidad de negocio [More than a shared vision, the Balanced Scorecard establishes a common pattern of performance and conveys a holistic approach to linking individual efforts and achievements to business unit goals] (p. 266), see Figure 1.

Definition: The BSC is a long-term strategic management system for all types of organizations, which links the organization’s strategy with operations and their respective managers through strategic maps, indicators, goals and strategic actions.
Perspectives of the BSC
The BSC comprises four perspectives which are applied to the company under study (Kaplan and Norton, 2000):
Financial Perspective. Financial performance measures indicate whether the implementation of strategy in a company contributes to its improvement through objectives, indicators and strategic actions. There are three strategic themes in the financial perspective: revenue growth and mix, cost reduction/productivity improvements, and asset utilization/investment strategy. The objectives and indicators are related to the company’s profitability, return on investment, return on assets, among others.
Customer Perspective. It allows companies to compare their customers' key indicators (satisfaction, retention, acquisition and profitability) against the customer and market segments in which the company operates. Also, it allows the identification and measurement of customer value propositions. Core indicators include market share, customer acquisition, customer satisfaction and customer profitability.
Internal-Business-Process Perspective. Company managers identify the most critical processes related to the achievement of shareholder and customer objectives. Objectives and indicators are thus translated into strategies aimed at satisfying shareholder and selected customer expectations. The indicators of this perspective include: brand, new products and services management, procurement leadership, post-sales service, etc.
Learning and Growth Perspective (L & G). It develops objectives and indicators to drive the learning and growth of the organization and its employees. The objectives of this perspective provide the necessary infrastructure to achieve the objectives outlined in the previous three perspectives. The key indicators of this perspective are employee retention and productivity, which depend on employee satisfaction within the company. Companies use strategies to improve the work environment, enhance employee skills and develop the necessary technological infrastructure for this purpose.
Strategy Map: A strategy map is a graphic representation of the cause-and-effect relationships of the company’s strategies. The relationship between the objectives and indicators of the perspectives must be explained so that they can be managed and validated (Kaplan and Norton, 2000), see Figure 2.

In the Ibero-American context, Rodríguez (2003) states that:
La integración de los diferentes procesos en la empresa facilita la visión de la misma como un todo; esta visión global permite llevar a cabo la estructuración de los cuadros de mando, así como la coordinación de las actividades desarrolladas por los diferentes estamentos de la empresa. [The integration of the different processes in the company facilitates the vision of the company as a whole. This global vision allows the structuring of the scorecards, as well as the coordination of the activities undertaken by the different company area] (p.180)
Nonetheless, in spite of the advantages of implementing a management system such as the BSC, Saldias, Seguel, and Torres (2007) mention that:
La sola incorporación de las prescripciones de un modelo no es garantía de un mejor desempeño. Se requiere “internalizar” un sistema de trabajo diferente y más completo, donde se tome en cuenta gran parte de los factores que son decisivos para el éxito [The sole incorporation of a model’s specifications does not guarantee an improvement in performance. A different and more complete work system, where a large part of the factors that are decisive for success are taken into account, must be “internalized”]. (p.65)
METHODOLOGY
This is a non-experimental study. A descriptive methodology is used, as it seeks to specify the properties, characteristics and profile of the company under study by analyzing the four perspectives that make up the BSC (Hernández, Fernández, & Baptista, 2010).
The design and subsequent implementation of the BSC as a business management system takes several months and years to complete in any given company. For this case study, the research consisted of three stages:
Stage 1: Analysis of the company’s competitive position. The external factors that influence the company were identified and analyzed (EFE Matrix) either as opportunities or threats. Next, the microenvironment was analyzed using the five competitive forces methodology (Porter, 2017). Based on the score obtained, the ink manufacturing industry has low attractiveness. A new business management model must therefore be implemented to enable the company to address each competitive force.
During the company’s internal analysis, the key factors classified as strengths or weaknesses were identified using the EFI matrix. The cross SWOT analysis summarizes the key indicators of the business environment and the strategic capabilities of a company that may affect the development of the strategy. Based on the current capabilities of the company under study, four types of strategies are proposed: SO, WO, ST and WT strategies (see Table 1).
Table 1 Cross SWOT Analysis.
| STRENGTHS | WEAKNESSES |
|---|---|
| S1. Efficiency and personalized customer service | W1. Low business profitability |
| S2. Company flexibility to cope with downturns in demand | W2. Inability of the commercial area to increase sales |
| S3. Customers perceive the products as being of good quality | W3. Lack of a modern business management system adapted to their needs |
| S4. Experienced, competent, and committed personnel | W4. Lack of motivated staff |
| S5. Proficiency in product manufacturing processes | W5. Reduced operational and financial capabilities |
| W6. Higher production costs compared to large competitors | |
| W7. Competitors with better brand position in the market | |
| OPPORTUNITIES | THREATS |
| O1. Government support for SME growth | A1. Political instability |
| O2. Growth of the graphic industry at the national level | A2. Increased competition among ink suppliers |
| O3. Increased availability of qualified human capital | A3. Perception of citizen insecurity, delinquency, and crime |
| O4. Access to less polluting inputs of national origin | A4. Avance de la tecnología de materiales, de procesos y de equipos |
| A5. Introduction of substitute products at lower prices and better/equal quality | |
| A6. Increased awareness of society regarding the conservation and protection of the environment | |
| A7. Increasingly fewer barriers to entry for new competitors | |
| SO “Maxi-Maxi” Strategy | WO “Mini-Maxi” Strategy |
| SO1: Leverage government support for training, technical assistance and financing | SO1: Implement a new business management system with a focus on sales growth and profitability |
| SO2: Invest in strengthening the sales and marketing areas by incorporating new personnel and key management indicators | |
| ST “Maxi-Mini” Strategy | WT “Mini-Mini” Strategy |
| ST1: Implement strategies for customer loyalty, brand positioning and attracting new clients nationwide | WT1: Develop and implement the company’s strategic plan for the short and medium term |
| ST2: Implement the Japanese 5S as management technique to improve efficiency in the production process | WT2: Restructure the company and implement a new business management system |
| ST3: Invest in Research, Development and Innovation (R+D+i) | WT3: Consider alternatives such as merging with other companies, downsizing and selling assets, selling the company or declaring bankruptcy or liquidation |
Source: Prepared by the author.
The Ansoff matrix (1957) was used to determine that the growth strategy to be implemented would be “Market Development”, based on the fact that the product (inks for the graphic advertising industry) already existed, and therefore was not considered a new product.
Data was gathered via surveys, information analysis, direct observation and documentation of the company.
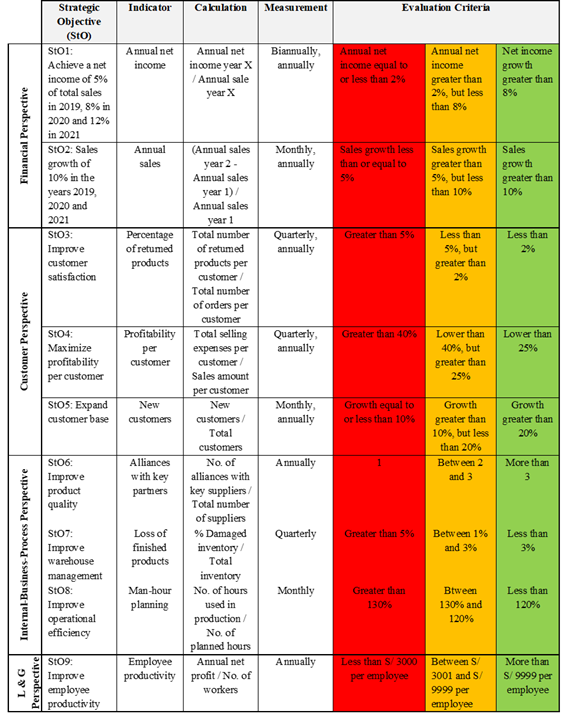
Stage 2: Design of the four components that make up the BSC. Based on the information collected in the previous phase, the BSC was designed (see Table 2).
Table 2 Design of the BSC for the period 2019-2021.

N/A: Not Available.
Source: Prepared by the author.
In addition to establishing the strategic objectives, the team responsible for the implementation of the BSC was organized and led by the general manager and owner of the company. During this stage, the project received favorable feedback from management and the commitment of the collaborators to the proposed mission, vision, values, objectives and strategies. In accordance with Nogueira, Medina, Hernández, Nogueira and Hernández (2009):
Hasta hace pocos años, la alternativa utilizada para medir la eficiencia de la empresa se basaba en el análisis exhaustivo de su información financiera. Las empresas ya no se gestionan solamente a través de sistemas de control de gestión construidos en torno a indicadores y metas financieras que tienen una reducida relación con el progreso en el logro de los objetivos estratégicos de medio y largo plazo. Se requiere de una visión holística de los negocios, de la necesidad de establecer medidas no financieras orientadas hacia el futuro de la organización, como la satisfacción de los recursos humanos o la innovación de nuevos productos y procesos [Up until recently, company efficiency was measured on the basis of an exhaustive analysis of their financial information. Companies are no longer managed solely through management control systems built around financial indicators and goals that have little relation with the achievement of medium- and long-term strategic objectives. Instead, a holistic view of the business is required, as well as the need to establish non-financial measures oriented towards the future of the organization, such as human resource satisfaction or innovation of new products and processes]. (p. 223)
Data was gathered via brainstorming, development of process flow charts, design of the indicator matrix and the strategy map.
Stage 3: Implementation period of the BSC. The final implementation and assimilation of the BSC throughout the organization was estimated to take place in 2019, 2020 and 2021. The first stage of the BSC implementation period took place between January and September 2019. In this stage, the mechanism for measuring progress in meeting the strategic objectives was established. If the achieved target is lower than expected, an alarm is triggered and the dashboard turns red. If the objective achieved is within the expected parameters, the dashboard turns yellow for evaluation and follow-up. If the objective achieved is higher than expected, the dashboard turns green. The dashboard is shown in Table 3.
Data was gathered in this phase from awareness-raising workshops, work meetings and feedback activities.
RESULTS
Table 4 shows the results of the implementation of the BSC. The strategic initiatives (SI) implemented to achieve the objectives of the Financial Perspective are shown below.
For strategic objective “Growth sales of 10 % in 2019, 2020 and 2021”
IE1: Sales capabilities of the commercial area staff were strengthened.
IE2: New sales and distribution channels were developed nationwide.
IE3: Established alliances with distributors and authorized representatives.
IE4: New products of greater value to the client were launched.
IE5: Measures to attract new customers were implemented.
For the strategic objective “Achieve a net income of 5% of annual sales by 2019, 8% by 2020 and 12% by 2021”
SI6: A new business management model focused on sales and profit growth was implemented.
SI7: The cost structure was optimized and the company’s cash flow was strengthened by establishing a fixed remuneration for family members who are part of the company.
SI8: Inventory levels of inputs and finished products were reduced.
SI9: Better financing conditions were obtained and the company’s solvency was improved.
Table 4 Results of the implementation of the BSC.

N/A: Not Available.
Source: Prepared by the author.
The strategic initiatives (SI) implemented to achieve the objectives of the Customer Perspective are shown below.
For strategic objective “Improve customer satisfaction”
SI10: Sales and distribution processes were improved.
For strategic objective “Maximize profitability per customer”
SI11: Average sales per client were increased.
For strategic objective “Expand customer base”
SI12: A marketing and sales plan was drawn up and implemented.
The strategic initiatives (SI) implemented to achieve the objectives of the Internal-Business-Process Perspective are shown below.
For strategic objective “Improve product quality”
SI13: The purchasing process was optimized to be able to acquire better quality inputs at a better price and under better payment conditions.
For strategic objective “Improve warehouse management”
SI14: A customized inventory control system for finished products was implemented.
For strategic objective “Improve operational efficiency”
SI15: Production processes were planned following the sales estimates of the sales area.
The strategic initiatives (SI) implemented to achieve the objectives of the Learning and Growth Perspective are shown below.
For strategic objective “Improve employee productivity”
SI16: A new corporate culture focused on meeting individual, team and organizational objectives was fostered.
SI17: Outstanding performance was encouraged and rewarded.
SI18: Work climate began to be measured and measures were taken to improve it.
SI19: Group dynamics were carried out to sensitize personnel on the importance of their work within the organization.
SI20: A database of qualified personnel with the potential to be hired for various positions was created.
Hypothesis Testing
As shown in Table 4, the results of the design and implementation of the BSC indicate that the implementation of the BSC as a business management system has provided direction to the company under study for the short, medium and long term. The benefits obtained from the implementation of the BSC as a business management system are evidenced in profitability, sales growth, customer base growth, proactive monitoring of the competitive environment, design and implementation of management strategies, and in the new corporate culture. From the above, the company has substantially improved its business management, thus the general hypothesis of the research is accepted.
Similarly, provided that the design and implementation of the BSC improved the business management of the company under study in terms of sales growth as shown in Table 5, HE1 is also accepted.

As the BSC implementation succeeded in improving the business management of the company under study in terms of profitability, as shown in Table 6, HE2 is also accepted.
DISCUSSION
The performance of the indicators in the four CMI perspectives for the year 2019 will be analyzed and forecast below. The results obtained up to September will be used as a baseline.
Financial Perspective Forecast
The indicators show a favorable trend and it is estimated that the strategic objectives of this perspective will be met (see Table 7). As reflected in the company’s strategy map, the client, internal processes and learning and growth perspectives have a direct effect (cause-and-effect relationship) on the results of the financial perspective.
Table 7 Financial Perspective Forecast as of December 31, 2019.
| Strategic Objectives | Indicator | Calculation | Jan-Set 2019 | Forecast 2019 |
|---|---|---|---|---|
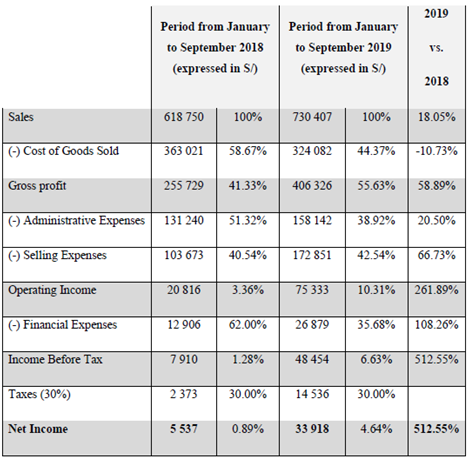
| Sales growth of 10% in 2019, 2020 and 2021 | Annual sales | (Annual sales year 2 - Annual sales year 1) / Sales year 1 | 18% | Sales growth greater than 10% over previous year |
| Achieve net income of 5% of total sales in 2019, 8% in 2020 and 12% in 2021 | Annual net income | Net profit year 2 vs. Net profit year 1 | 4.64% | Net income with projection greater than 5% |
Source: Prepared by the author.
Customer Perspective Forecast
The new approach of the sales area is intended to generate more sales by expanding the customer base and measuring profitability and customer satisfaction; this represents a major challenge that the company will have to overcome in the coming months or years. Corporate leaders must receive constant feedback in order to timely amend any deviations that may occur.
As shown in Table 8, it is possible to meet the objectives established in the “new customers” and “percentage of returned products” indicators; however, improving profitability per customer will require more time. As a new strategic management system, the CMI will allow the company to optimize customer profitability in the short and medium term.
Table 8 Customer Perspective Forecast as of December 31, 2019.
| Strategic Objectives | Indicator | Calculation | Jan-Set 2019 | Forecast 2019 |
|---|---|---|---|---|
| Improve customer satisfaction | Percentage of returned products | Returned products per customer / Total orders per customer | 6% | Less than 5% but greater than 3% |
| Maximize profitability per customer | Profitability per customer | Selling expenses per customer / Sales amount per customer | 45% | Greater than 40% |
| Expand customer base | New customers | New customers / Total customers | 22% | Growth greater than 20% |
Source: Prepared by the author.
Internal-Business-Processes Forecast
Indicators show a favorable trend and it is forecasted that the strategic objectives of this perspective will be met (see Table 9).
Table 9 Internal-Business-Processes Perspective Forecast as of December 31, 2019.
| Strategic Objectives | Indicator | Calculation | Jan-Set 2019 | Forecast 2019 |
|---|---|---|---|---|
| Improve product quality | Alliances with key partners | No. of alliances with key suppliers/ Total suppliers | More than 3 | |
| Improve warehouse management | Loss of finished products | Damaged inventory (%) / Total inventory | 2.30% | Between 1% and 3% |
| Improve operational efficiency | Man-hour planning | No. of hours used in production / No. of planned hours | 125% | Between 130% and 120% |
Source: Prepared by the author.
The indicators established in this perspective foster purchasing, manufacturing and warehousing process efficiency; they also have a positive economic and financial impact on the company. In the coming years, the BSC might be consolidated as an open strategic management system with the capacity to evaluate and assign new indicators to the strategic objectives of this perspective, such as alliances with key distributors, improvement of inventory turnover, improvement of production costs, among others.
Learning and Growth Perspective Forecast
Projection of the “employee productivity” indicator for 2019 is positive and it is estimated that it will continue to increase in 2020 and 2021.
As shown in Table 10, up to September 2019, each employee generated around S/. 3392 profitability.
Table 10 Learning and Growth Projection as of December 31, 2019.
| Strategic Objectives | Indicator | Calculation | Jan-Set 2019 | Forecast 2019 |
|---|---|---|---|---|
| Improve employee productivity | Employee productivity | Net profit / No. of employees | S/ 3392 | Between S/ 3001 and S/ 9999 per employee |
Source: Prepared by the author.
Further improvements in employee productivity would ensure the company’s sustainability in the market, as well as its ability to pay dividends to its shareholders and distribute profits among its employees. As a result, a virtuous circle that allows for improved productivity at the organizational, group and individual levels would be generated.
CONCLUSIONS
The design and implementation of the BSC substantially improved business management in the Lima-based company that manufactures ink for the graphic sector located in the city of Lima.
Over the period January-September 2019, sales increased by 18% compared to the same period of the previous year. Likewise, profitability increased from 0.89% to 4.64% net margin in the same period.
By implementing the BSC as a business management system, the company improved its capacity to increase sales.
The BSC as a new business management system led to changes in all areas of the company, as well as in the relationship with its customers, suppliers and creditors. As a result, profitability margins improved substantially.
Prior to the implementation of the BSC, the company studied was in a weak internal position and was not competitive. It was found that its competitive advantage lies in manufacturing good quality products at competitive prices for a specific market segment. The BSC and its components made it possible to align organizational objectives with the strategy to be adopted.
Through the implementation of the BSC, the company strengthened its ability to monitor its dynamic competitive environment, minimize threats and take advantage of opportunities.
ACKNOWLEDGMENT
A special thank you to MBA Bronny Gonzalo Loayza Alvarado for his advice in the elaboration of this article.
REFERENCES
Aguilar, R. (2018). Sistema de gestión basado en el cuadro de mando integral para la mejora de la competitividad de una empresa del sector industrial ubicado en el distrito de Chorrillos. Industrial Data, 21(2), 25-34. https://doi.org/10.15381/idata.v21i2.15600 [ Links ]
Ansoff, I. (1957). Strategies for diversification. Harvard Business Review, 35(5), 113-124. Recuperado de http://sgpwe.izt.uam.mx/files/users/uami/sppc/13O/Gestion_y_Control_Estrategico_I/Lectura_10._Ansoff_Igor_Strategies_for_Diversification.pdf [ Links ]
Córdova, L. (2008). Aplicación del Balanced Scorecard como metodología de gestión en las mypes y pymes peruanas. Revista Ingeniería Industrial, (26), 85-97. Recuperado de https://doi.org/10.26439/ing.ind2008.n026.636 [ Links ]
David, F. (2008). Conceptos de administración estratégica. México D.F., México: Pearson Educación. [ Links ]
Fayol, H. (1916). Administración industrial y general. París, Francia: Dunod Editeur. [ Links ]
Hernández, R., Fernández, C., y Baptista, P. (2010). Metodología de la investigación. México D.F., México: Mc Graw Hill. [ Links ]
Instituto Nacional de Estadística e Informática (2017). Perú: Estructura Empresarial, 2016. Recuperado de https://www.inei.gob.pe/media/MenuRecursivo/publicaciones_digitales/Est/Lib1445/ [ Links ]
Kaplan, R., y Norton, D. (2000). Cuadro de mando integral. Barcelona, España: Gestión 2000. [ Links ]
Koontz, H., Weihrich, H., y Cannice, M. (2012). i. México D.F., México: Mc Grawn Hill. [ Links ]
Niven, P. (2003). El cuadro de mando integral paso a paso. Maximizar la gestión y mantener los resultados. Barcelona, España: Gestión 2000. [ Links ]
Nogueira, D., Medina, A., Hernández, G., Nogueira, C. y Hernández, A. (2009). Control de gestión y cuadro de mando integral: énfasis en la perspectiva financiera - aplicación en una empresa de servicios de informática. Revista de Administração - RAUSP, 44(3), 222-235. Recuperado de https://www.redalyc.org/articulo.oa?id=223417462004 [ Links ]
Porter, M. (2017). Ser competitivo. Barcelona, España: Ediciones Deusto. [ Links ]
Rodríguez, R. (2003). El diseño del cuadro de mando integral en empresas agrarias. Revista Iberoamericana de Contabilidad de Gestión, 1(1), 155-180. Recuperado de https://dialnet.unirioja.es/servlet/articulo?codigo=765475 [ Links ]
Saldias, N. y Torres, C. (2007). El cuadro de mando integral y los sistemas normativos de gestión. Análisis para la pyme chilena. Revista Ingeniería Industrial, 6(1), 55-68. Recuperado de http://revistas.ubiobio.cl/index.php/RI/article/view/119 [ Links ]
Suárez-Espinar, M. J. (2018). Gestión Empresarial: un paradigma del siglo XXI. Revista Científica FIPCAEC, 3(8), 44-64. Recuperado de https://doi.org/10.23857/fipcaec.v3i8.57 [ Links ]
Received: October 22, 2020; Accepted: July 05, 2021
 Este es un artículo publicado en acceso abierto bajo una licencia Creative Commons
