


Services on Demand
Journal

Article
 text in
  English (pdf)
 Article in xml format
 Article references
 Send this article by e-mail
Indicators
-
 Cited by SciELO
Related links
-
 Similars in
SciELO
Similars in
SciELO
Share

 Permalink
Industrial Data
Print version ISSN 1560-9146On-line version ISSN 1810-9993
Ind. data vol.25 no.1 Lima Jan./Jun. 2022 Epub July 31, 2022
http://dx.doi.org/10.15381/idata.v25i1.21501
Production and Management
Management Model for the Implementation of Lean Manufacturing Tools to Improve Productivity in a Flame-Resistant Clothing Manufacturing Company in Lima, Peru
1
*
 http://orcid.org/0000-0002-9605-3670
2
http://orcid.org/0000-0003-2839-8383
3
http://orcid.org/0000-0001-7173-988X
1 Mechatronic engineer from Universidad Nacional de Ingeniería - UNI (Lima, Peru) and PhD in Business Management from Universidad Nacional Mayor de San Marcos - UNMSM (Lima, Peru). Currently working as associate and postgraduate professor at the School of Industrial Engineering of UNMSM (Lima, Peru). E-mail: jortizp@unmsm.edu.pe
2 Industrial engineer and PhD in Industrial Engineering from Universidad Nacional Mayor de San Marcos - UNMSM (Lima, Peru). Currently working as main and postgraduate professor at the School of Industrial Engineering of UNMSM (Lima, Peru). E-mail: jsalasb@unmsm.edu.pe
3 Graduate in Textile and Apparel Engineering from Universidad Nacional Mayor de San Marcos (Lima, Peru). Currently working as an independent consultant (Lima, Peru). E-mail: lisseth.huayanay@unmsm.edu.pe
4 Undergraduate student of Occupational Safety and Health Engineering from Universidad Nacional Mayor de San Marcos (Lima, Perú). Currently working as an independent consultant (Lima, Peru). E-mail: rosiand.manrique@unmsm.edu.pe
5 Electronic engineer from Universidad Mayor Nacional de San Marcos (Lima, Peru) and Master in Control and Automation Engineering from Pontificia Universidad Católica del Perú (PUCP). Currently working as professor at PUCP (Lima, Peru). E-mail: sobrado.ea@pucp.edu.pe
This research focuses on the analysis of the manufacturing process and standard times of a company that manufactures flame-resistant clothing in Lima, Peru, to elaborate a management model based on Lean Manufacturing tools aimed at improving the company’s productivity and providing a model that can be implemented in similar environments. The first step was to identify the problems and, upon observation, a continuous improvement plan was drawn up following the DMAIC methodology (define, measure, analyze, improve and control), which focuses on the incremental improvement of processes. Following the implementation of the 5S (that creates a continuous process of improvement of the work environment and helps to make problems visible), learning instructions, a time study and a total maintenance plan, there was a 20% increase in man-hour productivity. The model was also subjected to expert judgment and obtained an Aiken V validation value of 100%, indicating that the model is effective in improving productivity in clothing companies.
Keywords: lean manufacturing; improvement plan; 5S; time study; maintenance; management model.
INTRODUCTION
In 2019, domestic demand in the Peruvian textile sector contracted by 9%, while exports contracted by 6% (Saavedra, 2019), largely as a result of foreign import prices, which reduces the income of the national textile sector and leads to the closure of several companies. To cope with this situation, companies in the sector are incorporating greater added value to their products, to have tools other than price to compete in the market. The Sociedad Nacional de Industrias (2019) reports that, although a 3.3% growth in national textile production was expected for 2019, textile exports continue to be low with approximately 2 billion US dollars, compared to the agricultural export sector, which exceeds 7 billion US dollars. Representatives of this institution stated that, in order to solve this problem, it is necessary to work towards increasing the productivity of companies and making them sustainable, so as to reduce costs and wastage, save energy and run more efficient businesses.
The company under study is located in the Constitutional Province of Callao and specializes in the manufacture of firefighter suits made according to existing models in the international market, using inputs imported in their entirety directly from the United States; its products are UL certified and comply with NFPA 1971 and protection standards for the assembly of firefighter suits against structural fire. In view of the current conditions, the company under study found it necessary to improve its processes and reduce its deficiencies to increase productivity. Accordingly, the objective of this article is to propose and implement a management model based on Lean Manufacturing tools, designed to improve the company’s manufacturing process in terms of quality, standardization and time. In addition, our goal is to ensure that this model will not only meet its objective in the company under study, but can also be implemented in other companies in the sector with similar results. The research hypothesis is that there is a significant difference in productivity after the implementation of the continuous improvement model, and that the paradigm obtained is suitable for implementation in similar contexts.
This paper is intended to be useful in the research field as a guide for further studies on process continuous improvement. It is also intended to be useful for those companies in the industrial sector that require a Lean Manufacturing model to improve their processes. The relevance and novelty of this research work lies in the elaboration of a model consisting of a group of tools selected to address the main problems of the garment industry: operator skill level, machine maintenance, lack of order and cleanliness, and high cycle time, which leads to an increase in productivity. Therefore, the research contributes to further development of the topic, since the management model designed constitutes a new alternative for the garment industry in terms of continuous improvement, as well as in the research sector.
The importance of Lean Manufacturing in the management of operational processes of companies is demonstrated in research such as those of Vargas, Muratalla and Jimenez (2018), who in their article Sistemas de producción competitivos mediante la implementación de la herramienta Lean Manufacturing data on cases of improvement of different production systems. The main problems identified were costs, area used, inventories, quality and lead time, and the result evidenced that 60% of the activities of the companies under study did not add full value; however, this percentage was reduced using the continuous improvement tools. Likewise, González, Marulanda and Echeverry (2018), in their article entitled Diagnóstico para la implementación de las herramientas Lean Manufacturing, desde la estrategia de operaciones en algunas empresas del sector textil confección de Colombia: reporte de caso, demonstrated that in all areas of the textile company under studied where Lean Manufacturing was applied, competitive advantages arise that allow its continuous improvement. Also noteworthy are Curillo et al. (2018) who in their article entitled Aplicación de herramientas de manufactura esbelta en la empresa textil Anitex, Atuntaqui, Ecuador studied and implemented continuous improvement tools such as Value Stream Mapping, 5S, TPM, SMED, Just-in-Time and Kanban in a textile company. Each of the tools led to improvements; for instance, the application of 5S improved performance in the cutting area by 47%.
Process and Productivity
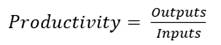
A process can be defined as a unit that accomplishes a meaningful objective for an organization, and also for the customer, adding value. Therefore, it can be said that a process is a set of activities, interactions and resources, whose purpose and aim is to transform inputs into outputs that provide value to customers (Bravo, 2011). Speaking specifically of the manufacturing process, it consists in the transformation of the fabric that was cut in the previous stage into a product with the required shape or similar to that required by the end customer (Asociación Intersectorial para el Desarrollo Económico y el Progreso Social [CIDEP], 2012). Productivity implies comparing the amount of resources used with the amount of goods and services produced with said resources. This can be measured through a productivity indicator shown in equation 01, as shown below:
 Equation 01
As inputs might vary in terms of quantity, productivity can be expressed as partial productivity, physical productivity, average productivity, gross productivity, man-hour productivity, among others (Carro & González, 2008). The importance of productivity lies in the fact that, as an indicator, it allows measuring the efficiency of a process and, based on this, proposing measures to improve or maintain its quality, since the increase in productivity also leads to economic growth. Among the factors that affect productivity are the quality of resources, capital and labor (Céspedes, Lavado & Ramírez, 2016).
Lean Manufacturing
Lean Manufacturing is an organization and management model of the manufacturing system -people, materials, machines and methods- that seeks to improve quality, service and efficiency through the continuous elimination of waste (Socconini, 2019). The ideal application context for Lean Manufacturing is the repetitive manufacturing of product families using discrete processes. The volumes can be large, medium or small (Gisbert, 2015). There are many factors to take into consideration for the correct implementation of Lean Manufacturing, mainly knowledge in data gathering and analysis and having a trained team (Kafuku, 2019).
Lean Manufacturing uses tools such as the 5S, the value stream map (VSM) and total productive maintenance (TPM); the expression “5S” comes from the five Japanese words seiri (sort), seiton (set in order), seiso (shine), seiketsu (standardize) and shitsuke (sustain), which summarize the five steps for implementing this methodology (Manzano & Gisbert, 2016). The five S methodology focuses on improving workplace conditions, which leads to and allows improving safety and quality, reducing breakdowns, reducing changeover times (muda) and its variation (mura) by eliminating time consuming searches and minimizing displacements when handling the equipment and tools needed for the changeover, and reducing the operator’s cycle time and its variation (mura) by having the tools and supplies needed to perform the work cycle properly (Randhawa & Ahuja, 2017). The Value Stream Map (VSM) is a graphic model that represents the value chain, showing both the materials flow and the information flow from the supplier to the customer (Jimmerson, 2017), and aims to depict all the productive activities in a simple way, in order to identify the value chain and detect, at a global level, where the greatest waste in the process occurs. The VSM helps, in a visual way, to identify activities that do not add value to the business in order to eliminate them and gain efficiency (Rohac & Januska, 2015). As for Total Productive Maintenance (TPM), it is itself a paradigm of production system management. Lean Manufacturing does not share the main indicator used by TPM, the OEE (Overall Equipment Effectiveness); however, it takes advantage of its methodologies to achieve machine stability (Suzuki, 2017).
Management Model Based on Lean Manufacturing Tools for Productivity Improvement in Clothing Companies
This relates to a set of operations and procedures based on carefully selected and designed Lean Manufacturing tools, whose orderly application is aimed at improving productivity in the area of the company where it is implemented (Laureano & Mejía, 2019). It is intended to simplify the process of design and implementation of a strategic plan for productivity improvement that companies in the textile industry may experience, as although each case is unique and more specialized advice is sometimes necessary depending on the particular problem presented, the model proposes the fundamental principles to identify, assess and solve problems using Lean Manufacturing through a series of stages (Gento, Pimentel & Pascual, 2020).
The model (see Figure 1) includes the following Lean Manufacturing tools: 5S, instruction sheets for operators, value flow map and total equipment efficiency. All these tools were chosen for their proven support in the solution of the main problems that arise in clothing companies regarding materials, labor, method and machinery (Salazar, 2019).
Preliminary Setup for the Implementation of the Model
First of all, the appointed leader will arrange a meeting with the workers of the area to present the Lean Manufacturing model, its characteristics and objectives. Questions and suggestions from the workers will be welcomed, as well as their opinion regarding the suitability of the model, and, jointly with them, the steps for its implementation will be planned according to the specific context of the company. The purpose, objective, the area where the plan will be implemented, the schedule and the make-up of the group that will guide the other workers through the different phases of the plan will be outlined in an agreement, which must be signed by all the workers to ensure that the general characteristics of the plan have been duly established (Céspedes et al., 2020). This group should be comprised of 4 to 8 people; this number may increase as long as the new members contribute with knowledge and expertise. Ideally, it should be made up of engineers from various disciplines, technicians, human resources and logistics personnel, operators and other workers’ representatives. There should also be a leader, responsible for ensuring the proper functioning of the plan; coordinator(s), responsible for following the established procedures step by step, planning the meetings (at least one two-hour meeting every 15 days) and other activities; and secretary(s), responsible for recording and documenting the issues and activities that are undertaken, by means of reports or questionnaires.
Action and Analysis
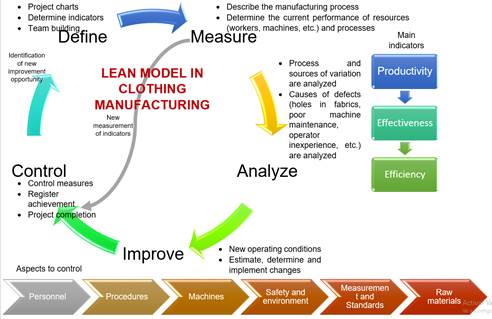
Once the basic considerations regarding the method to be followed are established, a series of steps will be followed according to the DMAIC methodology: define, measure, analyze, improve and control.
Define
First, strategies for the diagnosis of the main problem and its definition are established. The collaboration of all the workers in the area is necessary during this first stage. The designated manager will first distribute a chart listing the problems by activity, in which each worker must specify the problems he/she encounters while performing his/her work in a column, and the cause or causes related to each problem in the next column. Once the completed charts have been collected, the team in charge holds a meeting to discuss all the problems and classify them according to the variable they modify, using an Ishikawa or fishbone diagram to observe the main consequence that this entails (measured in numerical variables) and to be able to work on it. Once the main consequence is identified, a meeting is held with all the workers and members of the team to identify the main problem affecting the company, showing the Ishikawa diagram prepared. Based on these data, the definition of the problem is completed, and it is written in a project charter format, which must be signed by those responsible and properly communicated so that everyone is aware of the problem to be eliminated.
Measure
Upon determining the problem, it is measured with different tools that will be adapted to each of the 6 variables that define the problem, also known as “the 6M” (manpower, materials, machine, methods, measurement and mother nature). The variable or variables will be analyzed according to the type of problem encountered and the relevance of the variable with respect to the problem. It is important that work teams include personnel who are familiar with the implementation of these tools.
Analyze
After collecting the data from the measurement stage, it will be analyzed using a statistical program (SPSS, Minitab, etc.) to determine the characteristics of the variables to be analyzed and, subsequently, inferential statistics (correlation, regression) will be used to determine the influence of one on the other. The results must be compiled in a report and distributed at a meeting with the members of the company. All members’ proposals for solutions to the problem will be heard at the meeting, allowing each one to express his or her opinion in turn. Ideally, finding a solution should not take too long, as this may discourage workers.
Improve
The proposed solution is implemented in this stage following these steps:
Elaboration of a schedule and report specifying, at a minimum, start date, end date, activities to be carried out and person in charge of each activity.
Group training to train workers in the improvement strategy.
On-site implementation as specified in the report and as coordinated in trainings.
Verification of the proper implementation at each stage, activity carried out by the work team according to their functions.
Follow-up of the implementation process, detection and recording of any anomalies that may arise during compliance with the solution plan.
Upon completion of the established period, collect the same types of data that were collected in the “measure” stage, following the implementation of the solution, so that the respective comparison can be made.
Control
Using the data obtained in the previous stage, the statistics are re-examined and compared against the initial data obtained in the “measure” stage. If, after comparing the results, it is found that there was an improvement, it is important that the plan is maintained over time so that it leads to further improvements, thus repeating the cycle. If, on the other hand, a detriment rather than an improvement is observed, remedial action should be taken either to amend the plan or to redesign it, assembling the committee and the workers to detect at which point the plan began to fail. Whether success was achieved or not, everything must be recorded and contrasted with the initial status of the company (Sarria, Fonseca & Bocanegra, 2017).
Program Continuity
At the meeting to evaluate the results, all employees should be invited to participate voluntarily and provide feedback. It is important to determine the continuity of the plan, whether positive results that the company wishes to continue to improve have been obtained or negative results that it wishes to correct by amending the plan. If the plan is continued, implementation will be faster because of prior experience (Soto, 2017). Along with the continuity of the program, a periodic monitoring of new or existing problems should be ensured, incorporating the continuous improvement philosophy in the workers’ decision making, so that all their actions are aimed at improving the company, and spreading the knowledge of the plan, as well as the methodology and procedures to the entire company (Temoche, 2019).
METHODOLOGY
A quantitative approach was used in this research. According to Hernández, Fernández and Baptista (2014), a quantitative approach refers to a set of sequential and evidence-based processes, where the researcher is objective and conducts an organized study based on numerical measurement and statistics and follows a predictable and structured pattern, with which the theories and phenomena investigated can be demonstrated through deductive reasoning from which hypotheses are obtained. The latter are tested to achieve the objective proposed, under an explanatory research level. The research design was pre-experimental. According to Hernández et al. (2014), the pre-experimental design is a study in which one or more independent variables are manipulated, after which the consequences that this action exerts on the dependent variables are analyzed. The unit of analysis was the Production area of the clothing company, from where relevant information concerning the company was obtained. The processes and existing defects in the production of flame-resistant shirts of the clothing company were analyzed, each of which was subjected to evaluation.
The study population was composed of 180 flame resistant shirts equivalent to one month of production. The sample represented 100% of the production of one day, which was randomly selected according to probability sampling. The sample was selected with a margin of error (5%) and a confidence level of 95%, obtaining a total of six units. Data collection was conducted as follows:
Relevant data was collected from the clothing manufacturing area: standard time of each process, step-by-step details of each activity using an operations diagram.
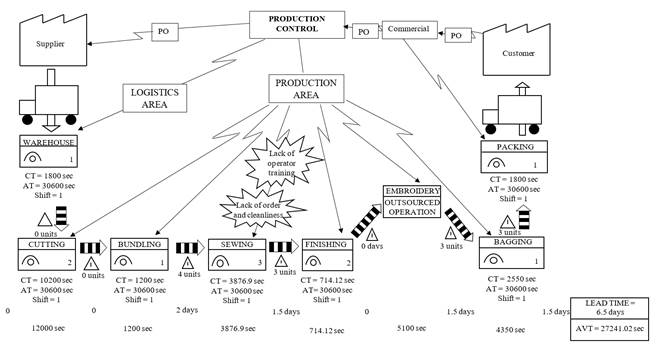
The main problem areas were identified by means of a value stream map and the research area was determined.
An initial diagnosis was made based the observations, and a Continuous Improvement Plan was drawn up based on the DMAIC methodology.
An action plan was devised and the 5S were implemented.
Instruction sheets were prepared and distributed to enhance skill level.
A time study was conducted to determine standard manufacturing times.
Machine problems were measured using the FMEA matrix, followed by the implementation of a preventive maintenance plan and a daily maintenance log.
Performance was compared at a later stage to perceive the improvements in terms of indicators.
A management model proposal was prepared based on the results obtained and submitted for validation by expert judgment.
All data were classified, recorded and coded using different formats for quality tools, some of them provided by the Lean Six Sigma Institute, which are certified as suitable for use in continuous improvement projects. In addition, descriptive and inferential statistics were used to test the validity of the hypotheses and to obtain conclusions by means of Minitab software and, subsequently, the information was interpreted.
RESULTS
Work hours at the company under study are from 8:00 a.m. to 5:30 p.m., with a lunch break from 1:00 p.m. to 2:00 p.m. This means that there are 8 and a half available working hours (8.5 hours/day) 5 days a week. That is, a total of 42.5 working hours per week.
The daily demand, based on the data of a production order selected for the study with a total of 6 units of flame-resistant shirts, was estimated using the following formula:
Por tanto, la productividad se puede calcular como sigue a continuación:
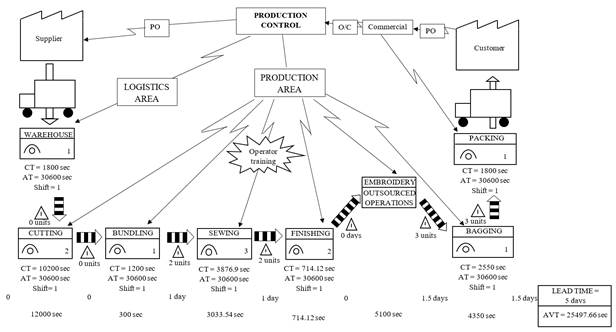
Calculations were then made by area in order to draw up the company’s current Value Stream Map, which is shown in Figure 2.
The problems that aroused during the production of a production order were quantified according to the number of occurrences. This allowed identifying those that needed to be addressed first in the continuous improvement plan. To this end, a Pareto chart was created, as shown in Figure 3, where it can be seen that 80% of the problems are caused by the lack of order and cleanliness, lack of operator training, unnecessary movements and displacements, and machine failures.
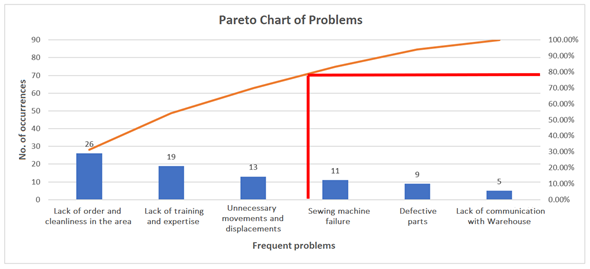
Source: Prepared by the authors.
Figure 3 Pareto Chart Showing the Problems Encountered in the Production Area.
Therefore, in collaboration with the Management area, the Engineering area and the personnel of the Production area, improvement tools were implemented to address each of the aforementioned problems, as shown in Table 1.
Table 1 Tools to Be Implemented per Problem.
| N.° | Problem | Tool |
|---|---|---|
| 1 | Lack of order and cleanliness in the area | 5S |
| 2 | Lack of training and expertise | Instruction sheets |
| 3 | Unnecessary movements and displacements | Time and movement study |
| 4 | Sewing machine failure | FMEA, TPM |
Source: Prepared by the authors.
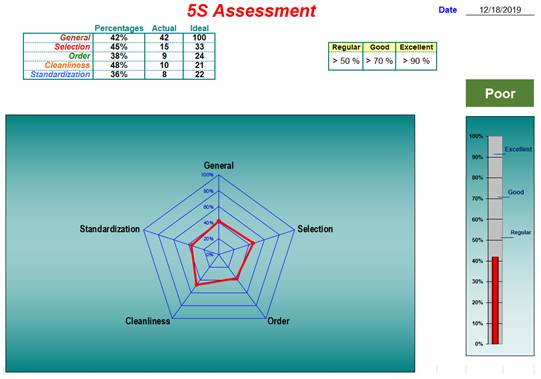
After conducting an internal audit of the problems found in the production area, a 5S value of 42% was found, as shown in Figure 4.
Two one-hour training session were held during the morning working hours (when workers are most productive) to implement the 5S. The activities undertaken for the implementation of the 5S in the aforementioned company according to the established schedule are shown in Table 2.
Table 2 Activities Planned for the Implementation of the 5S.
| Implementation of the 1st S: SORT | Implementation of the 2nd S”: SET IN ORDER | Implementation of the 3rd S: SHINE | Implementation of the 4th S: STANDARDIZE | Implementation of the 5th S: SUSTAIN |
|---|---|---|---|---|
| Communicate the improvement process to workers | Set in order the production areas | Cleaning the production areas | Standardize production areas | 1-hour meetings/training sessions |
| Classify the manufacturing areas | Label the articles in the production area | Temporary waste containers for different types of waste or garbage | Set up company safety measures: evacuation plans, fire extinguishers, safety signs and first aid kits | Presentation of results |
| Designate a red/quarantine area | Code the machines | Records of work areas and sanitary facilities cleaning | Set up a Basic Training Plan (mandatory training: first aid, use of fire extinguishers, emergency drills) | |
| Prepare the checklist for preserving or discarding quarantined products | Checking of labeling and coding by workstations | Implementation and filling out of improvement opportunity record cards | Assign workstation and cleaning responsibilities | |
| Elaboration and revision of improvement opportunity list | ||||
| Display graphic hand-washing instruction sheets for personnel |
Source: Prepared by the authors.
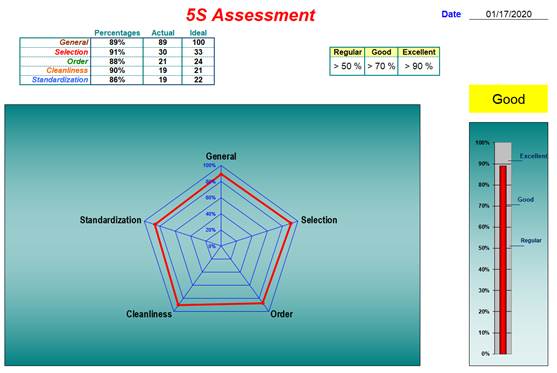
After completion of the final audit at the end of the 5S implementation schedule, a 5S value of 89% was obtained, which is shown in Figure 5.
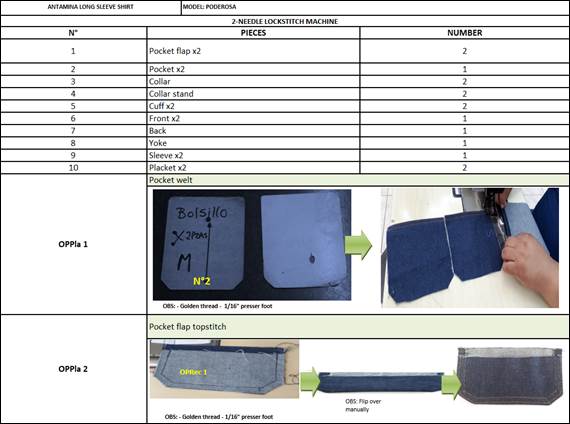
Subsequently, instruction sheets were prepared for the less efficient operators. An instruction sheet was prepared for each of the machines used in the shirt manufacturing process, showing the beginning, end and process of each operation. These were placed in visible places and explained to the operators. An example of these instruction sheet is shown in Figure 6, which illustrates the one made for the 2-needle lockstitch machine.
Source: Prepared by the authors.
Figure 6 Example of instruction sheet for the use of the 2-needle lockstitch machine in shirt making.
To assess operator skill level, a table containing the standard times was drawn up from the time study, which will be shown in the following section. In this table, the machine operations are classified into three levels: A, B and C. As the difficulty of each level increases according to the time it takes the operator to perform the operation, we assigned a weight to each operation based on the evaluation of the workshop manager.
Similarly, a list of skill levels (see Table 3) was drawn up in collaboration with the workshop manager, who trained the operators in the production of the shirts, to calculate the skill level acquired during training.
Table 3 Assessment of Operator Skill Level.
| No. | Skill Level | From | To |
|---|---|---|---|
| 1 | Requires assistance very frequently | 0% | 29% |
| 2 | Exhibits little progress, performs few operations independently | 30% | 49% |
| 3 | Exhibits acceptable progress, performs some operations independently | 50% | 69% |
| 4 | Hardly requires assistance, is able to perform several operations independently | 70% | 89% |
| 5 | Requires no assistance, is able to provide instruction to others | 90% | 100% |
Source: Prepared by the authors.
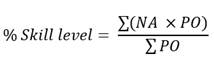
Based on these data, the skill level percentage of each of the operators in each operation was calculated using the following formula:
As there are a total of 36 machine operations, the calculations were summarized to show the initial and final skill level of each operator. Note that the “initial” is the training given by the workshop manager, and the “final” is the one after the implementation of the instruction sheets.
The following average initial skill level values were obtained for operator Yorely S.:
% Skill level = (62%×10+86%×10+⋯+43%×35+59%×35)/875=56%
After the implementation of the instructions, the following average final skill level value was obtained for the operator Yorely S.:
% Skill level = (79%×10+90%×10+⋯+51%×35+62%×35)/875=71%
The following average initial skill level values were obtained for operator Sandy C.:
% Skill level = (45%×10+69%×10+⋯+42%×35+61%×35)/875=47%
After the implementation of the instructions, the following average final skill level value was obtained for the operator Sandy C.:
% Skill level = (58%×10+72%×10+⋯+56%×35+74%×35)/875=68%
Prior to the implementation of the 5S and instruction sheets, and due to the fact that the efficiency of these operators is initially low, a time study was conducted. Very long times were recorded in the manufacturing process, some of which had to be eliminated to estimate the standard time. The valuation factor (VF), equivalent to operator efficiency, is a value assigned by the Engineering staff. The tolerance factor (TF) of each of the operators is calculated using the additional times from the OIT table. Once the calculations were made, it was found that the manufacture of a long sleeve flame-resistant denim shirt for the production order in the study took 64.615 minutes.
Upon implementation of the two aforementioned tools, the standard time for the manufacture of flame resistant shirts with the same characteristics decreased to 50.559 minutes. In addition, a Failure Modes and Effects Analysis was conducted, as shown in Figure 7, in order to determine the main failures that could occur during the manufacturing process. The degree of severity, detection and occurrence of these failures was also measured, and solutions were proposed through the implementation of TPM.
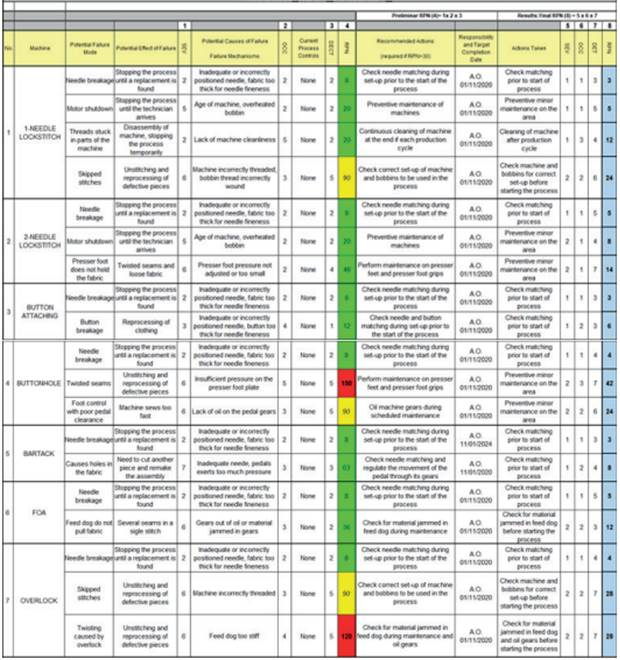
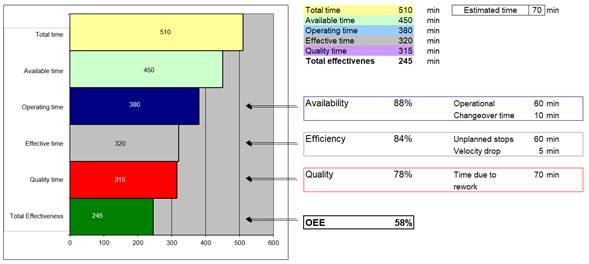
After noticing the presence of critical points in the FEA, the initial OEE was calculated (Figure 8) to gain a rough idea of the overall effectiveness of the equipment.
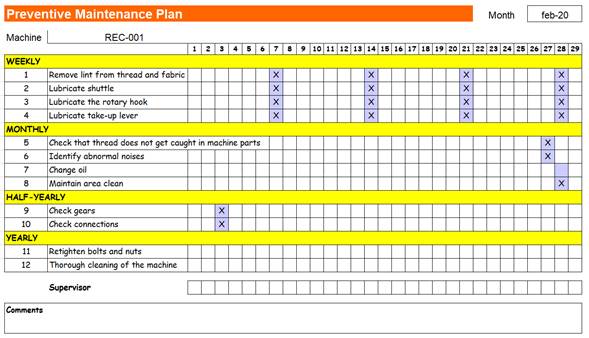
In view of the severity of the problems presented by each machine, a total productive maintenance plan was implemented for each one of them, an example of which can be seen in Figure 9. It was also necessary to provide daily maintenance to the machines before and during operations and at the end of the shift. Maintenance is performed in a few minutes, in order to inspect the proper functioning of the machine before it starts operating and thus reduce time losses due to machine failure.
Source: Prepared by the authors.
Figure 9 Preventive Maintenance Plan for the 1-Needle Lockstitch Machine.
.After the implementation of the preventive maintenance plan and daily maintenance, the OEE value was obtained, as shown in Figure 10.
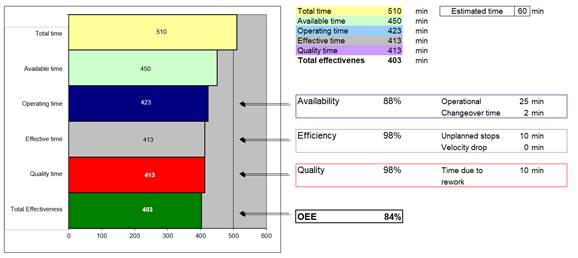
Initially, the OEE was 56%, which is unacceptable according to the metric presented in Table 4. In other words, the equipment was initially quite unproductive, which represented significant economic losses. After the implementation of the preventive maintenance plan and the daily maintenance log, a value of 84% was achieved, which is acceptable according to the metric. Although there are still slight economic losses and competitiveness is slightly low, the OEE is nevertheless higher than it was initially.
Table 4 Metric for OEE Values.
| OEE | Metric |
|---|---|
| < 65% | Unacceptable |
| 65% ≤ OEE < 75% | Regular |
| 75% ≤ OEE < 85% | Acceptable |
| 85% ≤ OEE < 95% | Good |
| ≥ 95% | Excellent (World Class Values) |
Source: González, Ramírez, Poblano and Mendoza (2016).
Finally, after the implementation of the proposed tools, the future value stream map is drawn up (Figure 11), based on the new time values and the company’s inventory.
At the end of the implementation of the tools, the productivity value was recalculated and the following values were obtained:
Comparing it with the initial value obtained, we have:
Following the experimentation conducted in the company and in view of the positive results obtained, the Lean Manufacturing model for clothing companies was determined. A questionnaire was elaborated to validate it, considering the research variables, and was applied to 8 experts in the field. The results were used for the Aiken’s V test (averages of the value assigned to each item), whose values obtained can be seen in Table 5.
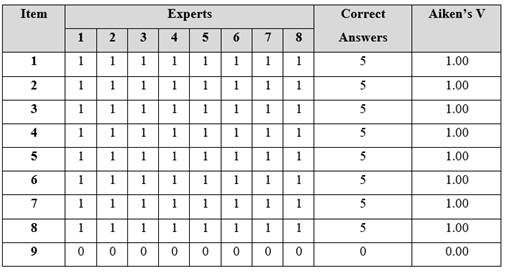
*p < .05
Experts = 8
It is worth mentioning that the last item corresponds to Observations, which is to indicate whether any correction, change or improvement should be made to the model, where it is possible to choose Yes (1) or No (0).
The Aiken’s V coefficient is obtained with the following formula:
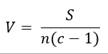
Where:
S |
sum of Si |
Si |
value assigned by expert i |
n |
number of experts |
c |
number of values in the scale (in this case there are two: 0 and 1) |
Using the formula above, we obtain:
As 1 > 0.80, the Lean Manufacturing model proposed in this research is valid for its application, with 100% validity by Aiken’s V test.
Upon obtaining these results, the hypothesis testing was performed to confirm the assumption made at the beginning of the research. First, the Saphiro Wilk, for samples smaller than 50, was performed with Minitab 2018 statistical software to determine whether or not the data followed a normal distribution with the following parameters:
p ≤ α, data do not follow a normal distribution
p > α, data follow a normal distribution
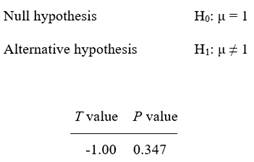
Based on the data, a p-value equal to .10 was obtained, which is greater than the significance value of .05; therefore, the data have a normal distribution. Following this demonstration, a Student’s t-test was performed for the acceptance or rejection of the hypotheses, which is presented in Table 6, considering the following premises:
H0 = There is no significant difference in productivity improvement before and after the implementation of the continuous improvement model.
H1 = There is a significant difference in productivity improvement before and after the implementation of the continuous improvement model.
Table 6 Student’s T-Test for Two Samples for the Acceptance or Rejection of the Hypothesis on the Lean Manufacturing Model.
Source: Prepared by the authors.
Considering that a p-value equal to .347 was obtained, H0 is rejected and H1 is accepted. Therefore, there is a significant difference in productivity after the implementation of the continuous improvement model. Consequently, it is understood that the proposed management model has achieved its objective. This result can be extended to other organizations by implementing the model in other environments, where, having demonstrated its validity and functionality, productivity improvement results will be obtained.
DISCUSSION
During the validation of the Lean Manufacturing Model, all the experts interviewed agreed on an acceptable value of Aiken’s V, thus it can be said that this model contributes to the productivity of the companies in the sector. This statement is based on the use of 5S, VSM, implementation of instruction sheets, time studies and TPM. These results are consistent with those of Gonzales and Samán (2020), who state that the implementation of these tools led to an increase in business productivity from 36% to 80%, doubling the number of items produced per day. Likewise, Quispe and Requena (2019) demonstrated that the application of these tools improved production times, efficiency and productivity, with which they managed to achieve a 29% increase in the latter indicator. Huaripata and Matos (2017) found that the implementation of these tools reduces raw material cost overruns by 13%.
CONCLUSIONS
There is a significant difference in productivity before and after the implementation of the management model based on Lean Manufacturing tools, since the productivity of the Production area of the aforementioned company increased from 0.10 units/man-hour to 0.12 units/man-hour, which represents an increase of 20% with respect to the initial stage. In addition, the production of shirts in the same period increased from 6 to 7 units, which means that the model, that was validated by experts in the field, meets the objective.
The value stream map was used to identify the most time-consuming and critical stages of the production process. At the end of the investigation, a 6.4% decrease in lead time was observed with respect to the initial level. This is useful for the management model because it demonstrates the importance of VSM as the first step of lead time measurement.
The 5S acts within the management model reduces unnecessary time and movements, in addition to promoting a culture of order within the organization, as was demonstrated in the respective implementation.
As a result of the implementation of instruction sheets, a skill level of 71% and 68% was achieved among the operators; likewise, interruptions for consultations were reduced to 16 times and reprocessing to 10 times. Thus, it is a tool that allows operators to increase their efficiency.
REFERENCIAS BIBLIOGRÁFICAS
Asociación Intersectorial para el Desarrollo Económico y el Progreso Social. (2012). Manual de Corte y Confección.: Madrid, España. [ Links ]
Bravo, J. (2011). Gestión de Procesos (Alineados con la estrategia) (4a ed.). Santiago de Chile, Chile: Evolución S.A. [ Links ]
Carro, R., y González, D. (2008). Productividad y Competitividad. Mar del Plata, Argentina: Facultad de Ciencias Económicas y Sociales de la Universidad Nacional de Mar del Plata. [ Links ]
Céspedes, N., Lavado, P., y Ramírez, N. (Eds.). (2016). Productividad en el Perú: medición, determinantes e implicancias. Lima, Perú: Universidad del Pacífico. [ Links ]
Céspedes, R., Hurtado, J., Macassi, I., Raymundo, C., y Dominguez, F. (2020). LEAN Production Management Model based on Organizational Culture to Improve Cutting Process Efficiency in a Textile and Clothing SME in Peru. IOP Conference Series: Materials Science and Engineering, 796, 1-6. [ Links ]
Curillo, E., Saraguro, R., Lorente, L., Ortega, E., y Machado, C. (2018). Aplicación de herramientas de manufactura esbelta en la empresa textil Anitex, Atuntaqui, Ecuador. Revista Observatorio de la Economía Latinoamericana, (marzo 2018). [ Links ]
Gento, A., Pimentel, C., y Pascual, J. (2020). Lean school: an example of industry-university collaboration. Production Planning & Control, 32(6) 1-15. [ Links ]
Gisbert, V. (2015). Lean manufacturing. Qué es y qué no es, errores en su aplicación e interpretación más usuales. 3C Tecnología, 4(13), 42-52. [ Links ]
Gonzales, M., y Samán, F. (2020). Propuesta de mejora en el área de confecciones para aumentar la productividad en una empresa textil aplicando el Lean Manufacturing. (Trabajo de investigación para obtener el grado de bachiller). Universidad Tecnológica del Perú, Lima. [ Links ]
González, H., Marulanda, N., y Echeverry, F. (2018). Diagnóstico para la implementación de las herramientas Lean Manufacturing, desde la estrategia de operaciones en algunas empresas del sector textil confección de Colombia: reporte de caso. Revista Escuela De Administración De Negocios, (85), 199-218. [ Links ]
Hernández, R., Fernández, C., y Baptista, P. (2014). Metodología de la Investigación. México D.F., México: McGraw Hill. [ Links ]
Huaripata, J., y Matos, A. (2017). Propuesta de mejora del proceso productivo en una empresa de confección textil aplicando la metodología Lean Manufacturing. (Tesis de maestría). Universidad Tecnológica del Perú, Lima. [ Links ]
Jimmerson, C. (2017). Value stream mapping for healthcare made easy. Boca Ratón, FL, EE. UU.: CRC Press. [ Links ]
Kafuku, J. (2019). Factors for Effective Implementation of Lean Manufacturing Practice in Selected Industries in Tanzania. Procedia Manufacturing, 33, 351-358. [ Links ]
Laureano, A., y Mejía, M. (2019). Propuesta de mejora de la productividad en una empresa de confecciones mediante el uso de técnicas del Lean Manufacturing. Universidad Tecnológica del Perú, Lima. [ Links ]
Manzano, M., y Gisbert, V. (2016). Lean manufacturing: implantación 5S. 3C Tecnología, 5(4), 16-26. [ Links ]
Quispe, A., y Requena, S. (2019). Propuesta de mejora para el incremento de la productividad de la empresa Manfo inversiones S.A.C. mediante el uso de herramientas Lean Manufacturing. (Trabajo de investigación para optar por el grado académico de bachiller). Universidad Tecnológica del Perú, Lima. [ Links ]
Randhawa, J., y Ahuja, I. (2017). 5S - a quality improvement tool for sustainable performance: literature review and directions. International Journal of Quality & Reliability Management, 34(3), 334-361. [ Links ]
Rohac, T., y Januska, M. (2015). Value Stream Mapping Demonstration on Real Case Study. Procedia Engineering, 100, 520-529. [ Links ]
Saavedra, A. (2019). ¿Por qué el sector textil volverá a caer en el 2019? SEMANAeconómica. https://semanaeconomica.com/sectores-empresas/industria/366552-por-que-el-sector-textil-volvera-a-caer-en-el-2019 [ Links ]
Salazar, M. (2019). Optimización del proceso de producción de blusas en el área de costura para mejorar la productividad en una empresa de confecciones aplicando herramientas de manufactura esbelta. Tesis Para optar el Título Profesional de Ingeniera Textil y Confecciones, Universidad Nacional Mayor de San Marcos, Facultad de Ingeniería Industrial, Lima, Perú. [ Links ]
Sarria, M., Fonseca, G., y Bocanegra, C. (2017). Modelo metodológico de implementación de lean manufacturing. Revista Escuela De Administración De Negocios, (83), 51-71. [ Links ]
Sociedad Nacional de Industrias (2019). Industria Textil y Confecciones. [ Links ]
Socconini, L. (2019). Lean manufacturing. Paso a paso. Barcelona, España: Marge books. [ Links ]
Soto, P. (2017). Aplicación del Lean Manufacturing para incrementar la productividad en las PYMES de confecciones textiles en la región Arequipa: Caso Empresa “CP”. Universidad Nacional de San Agustín de Arequipa, Escuela de Posgrado, Arequipa, Perú. [ Links ]
Temoche, A. (2019). Aplicación del modelo Lean Manufacturing en empresas de confección del Parque Industrial en el asentamiento humano de Huaycán. (Tesis de maestría). Universidad Nacional Federico Villareal, Lima. [ Links ]
Vargas, J., Muratalla, G., y Jimenez, M. (2018). Sistemas de producción competitivos mediante la implementación de la herramienta Lean Manufacturing. Ciencias Administrativas, (11). [ Links ]
Suzuki, T. (Ed.). (2017). TPM en industrias de proceso. Oxfordshire, England, UK: Routledge. [ Links ]
Received: November 08, 2021; Accepted: December 23, 2021
 Este es un artículo publicado en acceso abierto bajo una licencia Creative Commons
