


Servicios Personalizados
Revista

Articulo
 texto en
  Inglés (pdf)
 Articulo en XML
 Referencias del artículo
 Enviar articulo por email
Indicadores
-
 Citado por SciELO
Links relacionados
-
 Similares en
SciELO
Similares en
SciELO
Compartir

 Permalink
Industrial Data
versión impresa ISSN 1560-9146versión On-line ISSN 1810-9993
Ind. data vol.25 no.1 Lima ene./jun. 2022 Epub 31-Jul-2022
http://dx.doi.org/10.15381/idata.v25i1.20769
Production and Management
Management Modeling Including Process Quality and Technology for Service Improvement by Applying Structural Equations

1Industrial Engineering and Master’s in Management. Currently working as consultant for RENIEC’s General Management (Lima, Peru). E-mail: rgonzales@reniec.gob.pe
2PhD in Engineering. Currently working as professor at the Industrial Engineering School at Universidad Mayor de San Marcos. (Lima, Peru). E-mail: juanmanuelcevallos@gmail.com
This study proposes a model to improve identity registration service and correlates this service to the process quality and technology by means of structural equations using SPSS and AMOS. To reinforce the analysis of the information obtained from documents and records of the processes of identity registration, a 21 question survey was given to citizens coming to 1 of 16 regional headquarters, from which it was possible to demonstrate through structural equations, the existence of a strong relationship between the three variables: process quality, technology and service improvement.
Keywords: process quality; technology; service improvement; structural equations.
INTRODUCTION
RENIEC is the only institution in Peru with the great responsibility of identifying Peruvians and guaranteeing the technical and legal security of all civil acts. However, despite the actions and efforts related to the coverage of services and attention to the population, there is a population growth of more than 30 million Peruvians that is increasing and that demands better attention with respect to the services provided. Consequently, efforts regarding the registration and identification of individuals must keep pace with the current needs of the population since institutions must find ways to improve their performance in a competitive context.
Importance
This study seeks to review the information gathered to expose the practical and theoretical support of the existing correlation between (1) the use of technology, the attention, and the improvement of good practices that are successful in other countries, and (2) the process quality (certified lines, application of quality models) in order to improve the identity registration service.
Background
For this study, previous works on the subject were reviewed, in which the variables “process quality”, “technology” and their incidence on “service improvement” were studied.
In his doctoral thesis, Sistemas y tecnologías de información y comunicaciones en el proceso de dirección de calidad total, González (1999) determined that the relationships between technologies and the total quality management process as key factors for company failure or success. He concluded that the strategic application of information systems and technology focuses especially on improving the knowledge the company has regarding customer needs, reducing delivery times, and improving the quality of products/services.
Likewise, Cuevas, Aguilera y González (2015), in La relación de la innovación de procesos y el rendimiento empresarial de las MiPymes industriales de Guanajuato, considered two significant contributions. The first provided knowledge support by observing the existing relationship between the implementations that add value to processes, and business productivity in relation to MSMEs. The second contribution was the use of a new methodology to demonstrate the theoretical model by proving the constructs through second order confirmatory factor analysis and validating its hypothesis through structural equation modeling (SEM). For this, a survey was designed comprising the variables “process innovation” and “business performance” with a total of 17 items measured on a 5-point Likert scale. A Cronbach's alpha of over 0.7 was obtained from the reliability assessment of the instrument. The results obtained through structural equation modeling with the software EQS 6.1 proved the hypothesis that indicated that newness in processes influence business productivity by 66%.
In his work Análisis causal con ecuaciones estructurales de la satisfacción ciudadana con los servicios municipales, García (2011) studied the level of satisfaction perceived by users of certain types of services provided by the provincial municipality of A Coruña. The data were obtained through a survey to users of this municipality, which has 5705 inhabitants, so the study sample was 247. Five dimensions were identified through factor analysis: overall satisfaction, management, cleanliness, sanitation services and infrastructure. The structural equation modeling study was employed with the use of AMOS from 18 observed variables that constituted the survey items to study and calculate user satisfaction with municipal services; thus, causal relationships were found and those that exert a greater impact on citizens regarding decision-making were identified.
In the same way, Rodríguez (2016), in his presentation Modelo de gestión y su relación con el marco estratégico, el gobierno corporativo y la gestión del cambio, maintains that a management model in an organization should be based on processes, people and technology. Processes must be worked on and reinforced taking into account the principles of a quality management system, the continuous improvement, and the idea that technology integrates information into business processes, thus helping people to make decisions to achieve objectives.
The general objective of this article is “to design a management model including process quality and technology that strengthens the improvement of the identity registration service”. The specific objectives are “to evaluate how, following international guidelines, the management of identity registration processes will improve the identity registration service in terms of time, quality, and costs”, “to study how the digitization of documentation will improve the identity registration service in terms of time, quality, and costs”, “analyze how the systematization of biometric verification will improve the identity registration service in terms of time, quality, and costs” and “evaluate how the implementation of e-government services will improve the identity registration service in terms of time, quality, and costs”.
General Hypothesis
The design of a management model including process quality and technology improves the identity registration service.
Specific Hypotheses
Following international guidelines in the process management of the identity registration service improves the service in terms of time, cost and quality.
The digitization of documentation improves the identity registration service in terms of time, quality, and costs.
The systematization of biometric verification improves the identity registration service in terms of time, quality, and costs.
The implementation of e-government services in the identity registration service improves the service in terms of time, quality, and costs.
Justification
Constant changes and the different organizational culture in the entities of each nation influence management systems, which also cause them to update and innovate. In this sense, this study seeks to objectively expose the development of processes based on the adoption of international standards and/or quality models, as well as new technologies adopted for service improvement.
Limitations
A limiting factor was evident when collecting the responses from citizens in relation to the questions related to the variable “technology”, since, due to the nature of this type of questions, it was possible that they were not understood, which was evidenced when analyzing the results of one of the specific hypotheses.
Another limiting factor was the access to documents and certain records due to the security of the existing information in the organization, so the researcher, in her analysis prior to the use of structural equations, took referential data for the study of the relationship of the three variables.
In relation to the authors consulted for the variables studied, about the service improvement associated with the quality of processes and technology, and applied to structural equations, the following is exposed:
Process Quality
The process management following international guidelines represents the implementation of the international standard ISO 9001:2015 to improve service, as mentioned by Cruz (2001). His most relevant conclusions are that the implementation of a quality system is motivated by competitiveness, the desire to improve service, product, and employee satisfaction, as well as to reduce costs, among others.
Likewise, Pérez (2004), in his book Gestión por procesos, points out that financial measurements that until recently were considered the most relevant do not necessarily provide data to support improvement, so other perspectives that contribute information for dynamic management are indispensable.
Technology
Rodríguez (2009), in his article El AFIS del Reniec: avanzada tecnología biométrica de identificación al servicio de los peruanos y sus instituciones, points out that the Senior Management of Reniec (Peruvian National Registry of Identification and Civil Status), with a futuristic vision, took an important and historic step by deciding to acquire the Automated Fingerprint Identification System (AFIS).
In El proceso innovador y tecnológico: estrategias y apoyo público, Sánchez (2008) points out that the rapid technological changes that have occurred in recent years have made technology a key factor for competitiveness within organizations.
Service Improvement
In the first chapter of his book Mejoramiento de la calidad, un enfoque a los servicios, Acuña (2005) indicates that, in recent years, organizations are immersed in a great competition that increasingly forces them to fight for customer preferences.
Likewise, Prieto (2005), in his book El servicio en acción. La única forma de ganar todos, indicates that the population nowadays evaluates the attention it receives from companies and looks for the benefits it can find through the product; therefore, the meaning of “service” becomes relevant.
Structural Equations
Closas (2011), in his article Ecuaciones estructurales, presents a statistical technique to formulate and contrast models of cause-effect relationships, and points out that it is convenient that certain areas of knowledge - when it is necessary to provide clarification of the relationship between variables, dependent (one) and independent variables (more than one), as well as the relationship that may exist between two or more hidden (latent) variables- are studied through structural equations. These multivariate statistical models involve correlation and regression to incorporate webs of interconnected variables into the study.
Hoyos and Ramos (2018), indicate in their thesis that when public management does not follow proper planning, it becomes necessary to study and establish an optimal structural equation model to evaluate the overall satisfaction of the population about public services.
Nigro (2014) also shows in his work that the relationships between variables are obtained from SEMs, which make it possible to assess the result and the relationships between many variables. Generally, the variables are quantitative, and a measurement instrument is used, to which a Likert scale is applied.
METHODOLOGY
The research was explanatory and of correlational level. The population surveyed were those citizens who go to the premises of the 16 regional headquarters where most transactions or procedures are carried out; thus, the survey was applied to a sample of 572 citizens.
The research methodology was used by means of exploratory factor analysis, confirmatory factor analysis and structural equation modeling. The specialized software Statistical Product and Service Solutions (SPSS) was used for the exploratory factor analysis, and AMOS (Analysis of Moment Structures) was used for the confirmatory factor analysis and structural equation modeling.
Sample Size
The formula was applied for a finite population, where the total population is known, and it is desired to know how many of the total should be studied:
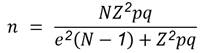
Where: n is the sample size to be found, N is the total number of users/citizens (population), Z is the safety margin obtained from the normal distribution, p is the expected proportion of the parameter to be evaluated. For the study, N = 12 000, Z = 1.96 for a safety margin of 95%, p = .5, q = (1 - p) and the sampling error is 3%, that is to say, e = 0.03. By replacing these data in the formula, a size of 572 surveys was obtained.
The sample was selected by stratified sampling, dividing the population into strata, and selecting a sample for each stratum. Stratified sampling exposes a minimum of errors, which increases the precision of the sample (Hernández, Fernández & Baptista, 1998, p.181).
Table 1 shows the details of the sample for each regional headquarters. The following is specified in each column:
JR = (From JR1 to JR16); regional headquarters name = name of each of the 16 regional headquarters; type of premises = OR (registry) or AG (agency); premises code = code assigned according to JR; premises name = name of premises according to JR, transaction per day = average number of daily procedures; sample size = stratified calculation according to formula (ni).
Table 1 Average Number of Largest Transactions in Each Headquarters.
| JR code | Name of Regional Headquarters | Type of Premises | Premises Code | Premises Name | Transactions per Day (on average) | Sample Size |
|---|---|---|---|---|---|---|
| JR1 | PIURA | OR | 351 | CHICLAYO | 1032 | 49 |
| JR2 | TRUJILLO | OR | 310 | TRUJILLO | 978 | 47 |
| JR3 | TARAPOTO | OR | 586 | TARAPOTO | 240 | 11 |
| JR4 | IQUITOS | OR | 431 | IQUITOS | 645 | 31 |
| JR5 | CHIMBOTE | AG | 33 | SANTA | 407 | 19 |
| JR6 | HUANCAYO | AG | 281 | HUANCAYO | 911 | 43 |
| JR7 | AYACUCHO | AG | 121 | HUAMANGA | 467 | 22 |
| JR8 | AREQUIPA | OR | 91 | AREQUIPA | 1860 | 89 |
| JR9 | CUSCO | OR | 191 | CUSCO | 1297 | 62 |
| JR10 | LIMA | OR | 371 | LIMA CERCADO | 1842 | 88 |
| JR11 | PUNO | AG | 559 | SAN ROMÁN | 567 | 27 |
| JR12 | ICA | AG | 271 | ICA | 450 | 21 |
| JR13 | PUCALLPA | OR | 701 | PUCALLPA | 556 | 27 |
| JR14 | HUANCAVELICA | OR | 221 | HUANCAVELICA | 127 | 6 |
| JR15 | HUÁNUCO | AG | 241 | HUÁNUCO | 430 | 21 |
| JR16 | AMAZONAS | AG | 158 | JAÉN | 191 | 9 |
| 12 000 | 572 |
Source: Prepared by the authors.
As the number of citizens is distributed according to the access to the different Agencies (per regions), the following formula was applied (ni):
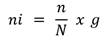
Where ni is the sample size per premises that is to be found; n is the general sample size; N is the total number of transactions; and g is the population group (number of transactions per premises/region).
Questionnaire
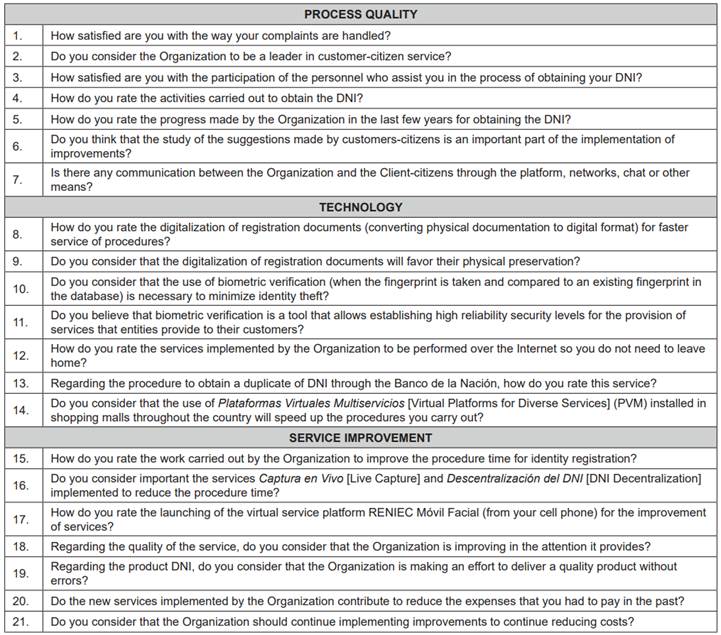
The measurement instrument consisted of 21 questions related to three dimensions: “process quality”, “technology” and “service improvement”. Questions 1 to 7 belong to the dimension “process quality”; questions 8 to 14 belong to the dimension “technology”; and questions 15 to 21 belong to the dimension “service improvement” (see Appendix 1).
First, the reliability and internal consistency analysis was performed to the Likert scale applied to the questionnaire using SPSS for the survey data in its 21 items and 572 responses. An excellent result was achieved: a total Cronbach’s alpha of 0.922; that is, a reliable result that endorses a continuation of the study.
Exploratory Factor Analysis
The exploratory factor analysis (EFA) was performed by verifying that the determinant in the correlation matrix is close to zero, that is, that the variables used are linearly related, which means that the factor analysis is a pertinent technique for its analysis. Likewise, the results of the KMO = 0.851, with a significance level of 0, which demonstrate the correlation of variables.
The Varimax rotated component matrix was applied under the belief that it is possible to work with three dimensions or factors, according to theoretical considerations.
The items (questions) are then distributed in three components (factors), F1: V20, V18, V17, V19, V21, V14, V13; F2: V2, V5, V1, V4, V7, V3, V6; F3: V8, V9, V10, V12, V11. It is observed that there is an overlap of V16 and V15 in F2. They are removed, and the process is performed again, but with 19 variables. It is obtained that in the new rotated component matrix the items are also distributed in three components (factors), F1 = SERVICE IMPROVEMENT: V13, V14, V17, V18, V19, V20, V21; F2 = TECHNOLOGY: V8, V9, V10, V11, V12; F3 = PROCESS QUALITY: V1, V2, V3, V4, V5, V6, V7.
Now, for the 19 items, a total Cronbach’s alpha equal to 0.915 is obtained, which is a very positive value. Likewise, for each of the components, a Cronbach’s alpha of 0.897 was obtained for the seven elements of the component “service improvement”; 0.939 for the five elements of the “technology” component; and 0.869 for the seven elements of the “process quality” component. Additional results were obtained: KMO = 0.852, a significance level of 0 and a total variance explained that, based on Kaiser’s rule, provides a factorial structure with three factors or components that explain 65.622% of the total variance, which is appropriate, since the authors suggest a percentage of 50% or more.
Confirmatory Factor Analysis
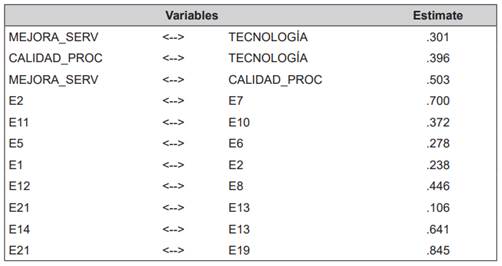
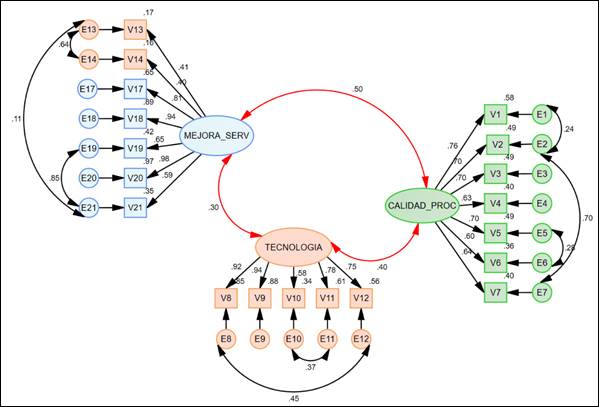
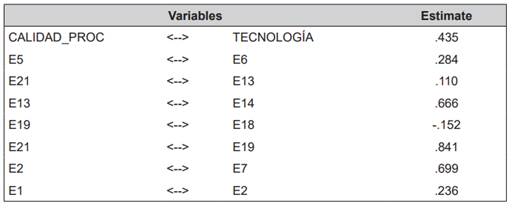
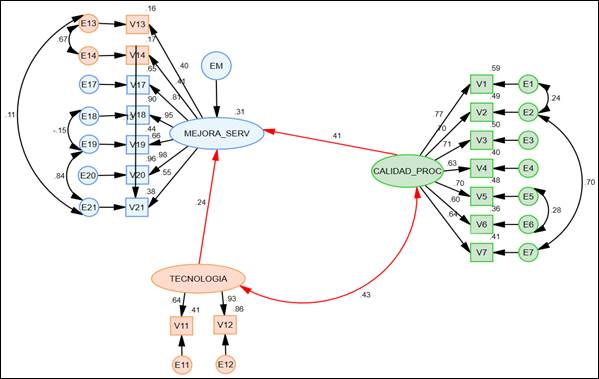
Based on the result obtained from the exploratory factor analysis (EFA), there are 19 variables and 3 dimensions (latent variables) for the study. It is customary in EFA to use causal relationship diagrams to represent the relationships between variables and factors. In this sense, AMOS was applied to obtain the following goodness-of-fit indicators after the necessary adjustments: chi-square = 611.416, GFI = 0.900, RMSEA = 0.076, NFI = 0.929, TLI = 0.932 and CFI = 0.944. These values are within the required parameters and correspond to the confirmatory factor analysis model. Figure 1 and Table 2 show the correlations between the variables, as well as some correlations between the errors, taking into account that in order to relate two errors they must belong to the same factor. In this sense, the correlations -for example, for the factor TECHNOLOGY, between the errors of items 10 (Do you consider that the use of biometric verification (when the fingerprint is taken and compared to an existing one in the fingerprint database) is necessary to minimize identity theft? ) and 11 (Do you think that biometric verification is a tool that allows establishing high reliability security levels for the provision of services that the entities provide to their clients?)- were gradually understood. The same happened, for the factor CALIDAD_PROC, to the correlation between the errors in items 2 (Do you consider that the organization is a leader in customer-citizen service?) and 7 (Is there communication between the organization and its customers-citizens through the platform, networks, chat or other means?).
Structural Equation Modeling
Structural equation modeling (SEM) is a multivariate statistical technique that assesses the outcome and relationships between several variables. These models make it possible to formulate the type and direction of the relationships expected to be found among the multiple variables, to then estimate the measures described by the theoretically proposed relationships.
Thus, the result of the CFA served as the basis for obtaining the Structural Equation Model (SEM) by using AMOS and after several processes, the best model was obtained according to the goodness-of-fit indicators: Chi-square = 364.423, GFI = 0.925, RMSEA = 0.071, NFI = 0.944, TLI = 0.945, CFI = 0.957; these results are optimal. Figure 2 and Table 3 show the correlations between the variables, as well as some correlations between the errors belonging to the same factor. For example, the factor MEJORA_SERV has the errors of items 18 (Con relación a la calidad del servicio. ¿Considera que la Organización está mejorando en la atención que le brinda? [Regarding the quality of service, do you consider that the organization is improving the service it provides?]) and 19 (Con relación al producto DNI. ¿Considera que la Organización está esforzándose por entregar un producto de calidad y sin errores? [Regarding the DNI, do you consider that the organization is making an effort to deliver a quality product without errors?]).
RESULTS
Escobedo et al. (2016) in Modelos de Ecuaciones Estructurales: Características, Fases, Construcción, Aplicación y Resultados, express that, there is an advantage when working with structural equation models, for it allows testing all the hypotheses at the same time. In fact, in this study the results are expressed in the “Structural Equations”, which are shown in Table 4, obtained from the last adjustment in search of the most optimal result, the same that are constructed with the Estimate of the regression weights and adding the values of Variances that represent the errors that go from E1 to E21 (without E8, E9, E10, E15, E16).
Table 4 Structural Equations.
| MEJORA _SERV = 0.214 CALIDAD_PROC | V1 = CALIDAD_PROC + 0.398 |
| MEJORA_SERV = 0.153 TECNOLOGIA | V2 = 0.878 CALIDAD_PROC + 0.447 |
| V14 = 0.907 MEJORA_SERV + 0.627 | V3 = 0.889 CALIDAD_PROC + 0.448 |
| V21 = 1.109 MEJORA_SERV + 0.390 | V4 = 0.913 CALIDAD_PROC + 0.713 |
| V20 = 2.167 MEJORA_SERV + 0.033 | V5 = 0.801 CALIDAD_PROC + 0.386 |
| V19 = 1.328 MEJORA_SERV + 0.350 | V6 = 0.708 CALIDAD_PROC + 0.507 |
| V18 = 2.139 MEJORA_SERV + 0.078 | V7 = 0.831 CALIDAD_PROC + 0.570 |
| V17 = 1.644 MEJORA_SERV + 0.222 | V11 = 0.693 TECNOLOGIA + 0.256 |
| V13 = MEJORA_SERV + 0.788 | V12 = TECNOLOGIA + 0.061 |
Source: Prepared by the authors.
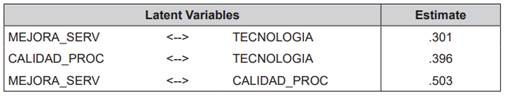
Regarding the achievement of the general objective, the general hypothesis “the design of a management model including process quality and technology improves the registration of people identification service” is answered. The factor analysis was used to test the creation of a management model that relates the three latent variables or factors “process quality”, “technology” and “service improvement”. By applying AMOS to 572 respondents, goodness-of-fit indicators were obtained with parameters required in FCA. Likewise, the correlation between the 3 latent variables was checked, as shown in Figure 1 and Table 5.
Specific Hypotheses
“Following international guidelines in the process management of the identity registration service improves the service in terms of time, cost and quality”.
That is, V1, V2, V3, V4, V5, V6, and V7 impact V15, V16, and V17 (time); V18 and V19 (quality); and V20 and V21 (costs); which can be visualized in Figure 2 (existing causal relationship).
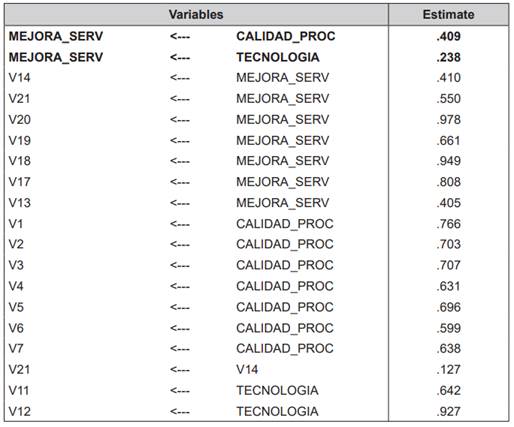
As mentioned earlier in the application of the structural equation model, with the exploratory factor analysis and the application of the rotated components matrix, since there was an overlap of the two variables V15 and V16, which were part of the time variables, a decision was made to remove them. However, with V17, it is verified that there is a causal relationship in which the quality of the processes improves service in terms of time. Based on the results derived from the analysis of standardized regression weights in Table 6, the causal relationship is determined to be 0.409, thus proving Specific Hypothesis 1.
“Digitizing the documentation improves the identity registration service in terms of time, quality, and costs”.
That is, V8 and V9 impact V15, V16 and V17 (time); V18 and V19 (quality); and V20 and V21 (costs).
During the search for the best SEM model, variables V8 and V9, which were part of the latent variable “technology” and which corresponded to the digitalization of documentation, had to be discarded in order to obtain better goodness-of-fit indicators. These results could be explained by the fact that the questions asked within the variable “technology” can always be difficult for the respondent to understand.
“The systematization of biometric verification improves the identity registration service in terms of time, quality, and costs”.
That is, V10 and V11 impact V15, V16 and V17 (time); V18 and V19 (quality); and V20 and V21 (costs). Based on the results derived from the analysis of standardized regression weights in Table 6, the causal relationship is determined to be 0.238, thus proving specific hypothesis 3.
“The implementation of e-government services in the identity registration service improves the service in terms of time, quality, and costs”.
That is, V12, V13 and V14 impact V15, V16 and V17 (time); V18 and V19 (quality); and V20 and V21 (costs). The results of the standardized regression weights analysis are shown in Table 6. With the causal relationship at 0.238, specific hypothesis 4 is demonstrated.
DISCUSSION
One of the sources used for data collection is the survey, as measurement instrument, which is applied through a previously elaborated questionnaire and through which the opinion or evaluation of the citizen is known, as was the case in this study. This instrument must meet desirable characteristics of reliability and validity. The reliability coefficient linked to internal consistency is Cronbach's alpha coefficient, which is recommended at values greater than 0.8. For the validity of the instrument, the KMO is used, acceptable at a value greater than 0.5.
In this study, a total Cronbach's alpha of 0.922 was obtained and a value of 0.869, 0.861 and 0.888 was obtained for each latent variable, as well as a KMO of 0.851. These results were compared with the research of Zabaleta, Brito and Garzón (2020) about methodology to estimate and evaluate a knowledge management model by means of structural equations, in which they reached a total Cronbach's alpha of 0.97 and 0.841, 0.819 and 0.914 for each latent variable. In other words, they proved a reliable and valid instrument.
To obtain the structural equations and apply them in research, it is necessary to generate the model’s goodness-of-fit indicators, which was done in this study and whose results (NFI = 0.944, CFI = 0.957 and RMSEA = 0.071) can be compared with those of other works. Thus, Cuevas et al. (2015) proved the hypothesis they proposed in their study, based on the good results of goodness-of-fit variables NFI = 0.925, CFI = 0.957 and RMSEA = 0.066.
CONCLUSIONS
The validity and reliability of the instrument used to measure all the items, as a whole and individually, have shown very good results, close to 1 for the KMO and Cronbach's alpha index.
With the application of structural equations, it was possible to determine a technique to create a model for improving the identity registration service.
This study made it possible to demonstrate that process quality and technology strengthen the improvement of the identity registration service.
The general hypothesis and the specific hypotheses were all proved.
REFERENCES
Acuña, J. (2005). Mejoramiento de la calidad, un enfoque a los servicios. Cartago, Costa Rica: Editorial Tecnológica de Costa Rica. [ Links ]
Closas, A. (2011). Ecuaciones estructurales, una técnica estadística para formular y contrastar modelos de relaciones causa-efecto. Revista de la Facultad de Ciencias Económicas de la Universidad Nacional de Nordeste-Argentina, 7, 175-189. http://dx.doi.org/10.30972/rfce.073921 [ Links ]
Cruz, S. (2001). Relación entre el enfoque de gestión de la calidad y el desempeño organizativo. (Tesis doctoral). Universidad de Valencia, Valencia. [ Links ]
Cuevas, H., Aguilera, L., y González, M. (2015). La relación de la innovación de procesos y el rendimiento empresarial de las MiPymes industriales de Guanajuato. Repositorio De La Red Internacional De Investigadores En Competitividad, 9(1), 1103-1122. [ Links ]
Escobedo, M., Hernández, J., Estebané, V., y Martínez, G. (2016). Modelos de ecuaciones estructurales: Características, fases, construcción, aplicación y resultados.Revista Ciencia & trabajo , 18(55), 16-22. https://dx.doi.org/10.4067/S0718-24492016000100004 [ Links ]
García, M. (2011). Análisis causal con ecuaciones estructurales de la satisfacción ciudadana con los servicios municipales. (Proyecto de fin de máster). Universidad de Santiago de Compostela, Galicia. [ Links ]
González, F. (1999). Sistemas y Tecnologías de Información y Comunicaciones en el Proceso de Dirección de Calidad Total. (Tesis doctoral). Universidad Politécnica de Madrid, Madrid. [ Links ]
Hernández, R., Fernández, C., y Baptista, P. (1998). Metodología de la Investigación. Ciudad de México, México. McGraw-Hill Interamericana Editores. [ Links ]
Hoyos, E., y Ramos, J. (2018). Modelo de Ecuaciones Estructurales óptimo para la Evaluación de la Satisfacción Global de la Población del cercado urbano acerca de los Servicios Públicos Básicos ofrecidos en la Ciudad de Lambayeque. Febrero-abril 2018. (Tesis de grado). Universidad Nacional Pedro Ruiz Gallo, Lambayeque. [ Links ]
Nigro, H. (2014). Modelo de ecuaciones estructurales no lineales para la construcción de índices de satisfacción del ciudadano con gobiernos locales. (Tesis doctoral). Universidad Nacional del Centro de la Provincia de Buenos Aires, Buenos Aires. [ Links ]
Pérez, A. (2004). Gestión por Procesos. Madrid, España: Esic Editorial. [ Links ]
Prieto, J. (2005). El servicio en acción. La única forma de ganar todos. Bogotá, Colombia: Ecoe Ediciones. [ Links ]
Rodríguez, J. (2016, 1-3 de agosto). Modelo de Gestión y su relación con el Marco Estratégico, el Gobierno Corporativo y la Gestión del Cambio 2016 Ponencia. Seminario Internacional de Identificación y Desarrollo, Ciudad de México, México. [ Links ]
Rodríguez, M. (2009). El AFIS del RENIEC: Avanzada Tecnología Biométrica de Identificación al Servicio de los Peruanos y sus Instituciones. Revista Académica para el personal del Reniec, 1(7), 55-58. [ Links ]
Sánchez, M. (2008). El proceso innovador y tecnológico: estrategias y apoyo público. La Coruña, España: Netbiblo, S.L. [ Links ]
Zabaleta, M., Brito, L., y Garzón, M. (2020). Metodología para estimar y evaluar un modelo de gestión del conocimiento mediante ecuaciones estructurales. Revista Orinoquia, 24(1), 94-110. https://doi.org/10.22579/20112629.595 [ Links ]
Received: July 12, 2021; Accepted: March 21, 2022
 Este es un artículo publicado en acceso abierto bajo una licencia Creative Commons
