


Services on Demand
Journal

Article
 text in
  English (pdf)
 Article in xml format
 Article references
 Send this article by e-mail
Indicators
-
 Cited by SciELO
Related links
-
 Similars in
SciELO
Similars in
SciELO
Share

 Permalink
Industrial Data
Print version ISSN 1560-9146On-line version ISSN 1810-9993
Ind. data vol.25 no.1 Lima Jan./Jun. 2022 Epub July 31, 2022
http://dx.doi.org/10.15381/idata.v25i1.22036
Production and Management
Influence of the Automated Configuration System on the Change Management Process of the IP Area of a Mobile Operator in Peru During the COVID-19 Pandemic

1Master in Strategic Management of Telecommunications. Electronic Engineer. Currently working as analyst at the Network Operation Center of Optical Networks (Lima, Peru). E-mail: romeroloveraj1@gmail.com
The objective of this research was to determine the influence of the automated configuration system on the change management process of the IP area of a mobile operator during the COVID-19 pandemic. A quantitative, experimental, applied, explanatory approach was used on a population and sample consisting of change management efforts between the years 2019 and 2020. The failure rate of change requests decreased from 74.95% in 2019 to 59.86% in 2020 and the success rate of change requests increased from 25.05% to 40.14% also, the system is resilient due to the fact that the success rate increased by 16.30%. It is therefore concluded that the automated system of configurations has a positive influence on the management process with a success rate increase of 60.28% and a failure rate decrease of 20.14%.
Keywords: change management; automated system; success rate; failure rate.
INTRODUCTION
Telecommunications have become a major foundation for economic, social and cultural development, as they have transformed society as a whole. According to Párraga, Zambrano and Reyes (2018), ongoing changes have led to the improvement of communication and interactions, as a result of the accelerated technological advances that includes mobile communications, bandwidth, internet, microwaves, satellites, among others. As a proof of this, there is a mobile operator company in the telecommunications sector whose share of mobile lines in the Peruvian market increased by 16.64% during 2019.
The mobile operator’s policy is to keep customers satisfied providing a quality service, thus leading to the measurement of the productivity of employees during their activities. From the measurement results, it was possible to determine the error rate during change management, estimated time of the processes, follow-up of incidents, effectiveness of maintenance services, among others (Membrillo, 2019). Among the most important findings was that 25.05% of the errors made during IP configuration management in 2018 were human errors due to lack of concentration on the activity, resulting in time overrun and user dissatisfaction; the detection of the above-mentioned scenario allowed the mobile operator to identify strategies for the reduction of the causes encountered. One of these strategies was the implementation of an automated configuration system that allowed to drastically reduce the figures registered in previous years.
Therefore, this research focuses on determining the influence of the automated configuration system on the change management process of the IP area of a mobile operator during the COVID-19 pandemic.
Several research works were analyzed in order to support the development of this research. Among them was that of Wambui and Gakuu (2019), whose objective was to study the impact of the automation of transportation service on customer satisfaction; the authors found that the quality of the system influences customer satisfaction in a positive and significant way, it is also influenced by the perceived usefulness, ease of use and the quality of the information generated by the system. In turn, Farfán (2020) concluded that the implementation of an automated system lowered costs for users in the processes applicable to the Ventanilla Única de Turismo (one-stop tourism permitting office in the Provincial Municipality of Callao.
Information from internationally renowned authors was used to describe the terms related to the process of configuration and the progress of new technologies and trends of change management in mobile operators for the promotion of service quality. After an extensive search in different databases, no similar examples were found in relation to the variables of this study; therefore, the topic is innovative and, because of the findings, may be of use to future researchers who intend to study the automation of a configuration system in change management. As a solution consistent with current trends, the automated configuration system aims to streamline configurations in the operational process of change requests, providing information for strategic management decision making and thus assessing the possibility of using automated processes as future solutions in other operational areas.
The hypothesis is as follows: The automated configuration system positively influences the change management process of the IP area of a mobile operator during the COVID-19 pandemic.
As this research addresses the problem related to the influence of process automation during the management of a certain activity in a mobile operator, it is justified in a pragmatic way, because it addresses a specific problem and intends to analyze the impact of a possible solution and the repercussions of its implementation. The problem of dissatisfaction caused by the configuration process, such as inconvenience and time overrun, is such that it is necessary to assess the impact of implementing an automated configuration system. Thus, the results of the research will directly benefit the users who access the service provided by the IP area of a mobile operator.
It is necessary to upgrade the quality of operations by improving the coverage and quality of the service offered to customers; therefore, an automated configuration system has been implemented.
The results evidence a significantly higher success rate, as the functions are reliably executed by the automated configuration system, which reduces the workload, boring, tedious and manual operations for the staff and ensures that the tasks are executed correctly and are not overlooked. This research demonstrates that it is advisable to use an automated system of configurations because of its various benefits; therefore, companies that implement this system will obtain positive results. As mentioned above, this research study can also be used as a reference for the implementation of this system in other operational areas of a company.
Automated Configuration System
According to Rodríguez, Díaz and Carnero (2017), the automation of a system is understood as the transfer of activities usually performed by people to a technological environment that allows them to be performed repetitively. These authors also note that the automation of a system makes it possible to standardize processes, avoid interpretation errors and improve decision-making in relation to the information obtained; likewise, streamlining processes reduces the time and cost of the activities. Configuration is the process of changing a set of data so as to modify the required characteristics, such as the configuration of a monitor, wheel drive or the structure of a vehicle (Pérez and Merino, 2016).
The automated configuration system makes it possible to create configuration templates according to the brand and model of the equipment, to load the data of the service to be configured. Should there be several nodes and several services, the data and the nodes to be configured can be entered as all the data entered can be executed simultaneously. As a result, the process is automated, configurations are streamlined and errors are avoided.
Configuration Management
Configuration management is a discipline that aims to update the respective versions and audits to ensure the availability of IT equipment, and therefore focuses on the technical support of equipment that is essential for the normal performance of activities within an organization, allowing the identification and recording of features such as reports, logs and configuration statuses (Zúñiga, Hurtado & Pérez, 2020). Configuration management is part of the ITIL best practices framework, as it focuses on a logical model of organizational infrastructure that identifies, controls and verifies the different elements that make up the IT ecosystem throughout the lifecycle.
Incident Management
An incident is understood as a total or partial interruption of a service; failures must be reported by a user in order to solve the problem. Incident management consists of the following stages (InGenio Learning, n.d.):
Incident logging: Anomalies detected in a service are reported to the IT area via different means.
Incident categorization: Incidents are categorized according to the scales established in the organization.
Incident prioritization: Reported incidents must be resolved according to the established scales to avoid a severe impact on the organization. Incidents can be categorized as critical, high, medium and low.
Initial diagnosis: A preliminary analysis is performed to determine the approximate time and expertise required to resolve the incident.
Task creation and management: A complex incident requires the intervention of specialized groups, so it is necessary to create sub-groups with specific knowledge to streamline activities.
SLA management and escalation: Continuity of organizations depends to some extent on the fulfillment of business agreements, so it is necessary to resolve incidents within a reasonable timeframe.
Incident resolution: An incident is considered temporarily or permanently resolved by IT staff when there is evidence that activities have been restored.
Incident closure: An incident is considered resolved when the user who made the request or the directly affected party determines that the problem experienced is no longer an impediment to the continuation of normal activities.
Process Management
Process management is a discipline comprised of technologies and methodologies intended to measure the effectiveness and efficiency of processes, for which the organization’s activities are designed, modeled, organized, documented and optimized on an ongoing basis (Domingo & Fernandez, 2016). Salimbeni (2019) states that process management seeks to improve the performance of an organization by improving the services or final products in relation to the needs of the users.
Change Management Process
Change management process is the set of mechanisms and tools that are prepared in such a way as to ensure that the required changes are executed as expected, so it is understood that it is a process that needs to be planned in detail to effectively meet expectations (Kotter, as cited in Laya, 2017). According to the above, it is a procedure that involves coordination to perform the change, configuration approval, scheduling and final review of the request.
Change management process indicators are detailed below:
Success rate: the success rate is the ratio between the number of change requests received and the number of requests executed without problems; successful requests are considered to be those that do not require additional time to makes corrections as a consequence of human error, thus making it possible to analyze the effectiveness of change management (Nebrija Universidad, 2012).
Change request growth rate: the change request growth rate is the variation that occurs in two different periods, therefore, change requests occurring on two equal dates, but in different periods, are analyzed to determine their variation (López, 2019).
METHODOLOGY
This research follows a quantitative applied approach, experimental design and explanatory method to assess the influence of an automated IP configuration system of a mobile telephony operator in relation to the IP change processes that occurred during the COVID-19 pandemic.
The unit of analysis and the population are comprised of the change management process performed in the IP area of a mobile operator, to which a non-probabilistic convenience sampling is applied, obtaining the management processes logged in the IP area between the years 2018 and 2020.
Figure 1 shows the data collection procedure:
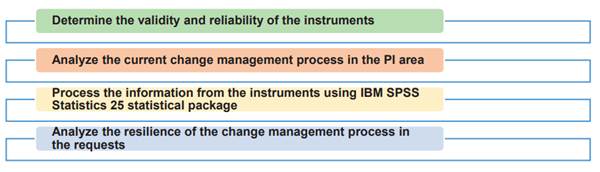
First, the validity and reliability of the instruments (change success rate and rate log) to measure the indicators were assessed to determine whether they were suitable for measuring the dependent variable. Then, the initial change management process of the IP area was analyzed, prior to the implementation of the automated configuration system, allowing for the analysis of the problems that arose. Data was collected by means of the instruments, involving the support of the IP area workers to securely download the information recorded on the logs. Data was collected twice, as the aim was to assess the process prior to the implementation of the automated system of configurations and the effects produced by its implementation. Subsequently, data from the instruments were run on the SPSS IBM 25 statistical package, which made it possible to determine the influence of the implementation of the automated system of configurations on the change management process, since the hypotheses were verified. Finally, the resilience of the change management process in the requests was analyzed.
Descriptive statistics was used for data analysis, which, according to Ñaupas et al. (2018), is a set of methods that facilitates the organizing, summarizing and presenting the information collected in an informative way; therefore, it is considered a fundamental activity for data processing involving the use of figures, graphs or summaries. Inferential statistics was also used, which, according to Ñaupas et al. (2018), allows the researcher to obtain basic information of the population from conclusions based on the significance of the results, and in contrast to descriptive statistics, mathematical-statistical procedures are used to validate the hypothesis testing.
RESULTS
The main function of the IP area is to perform the configuration management process requested by customers, for example, changes in network configuration, preventive maintenance or the requirements of the business. It is essential to successfully carry out the change process; however, this has not been happening according to expectations.
As shown in Figure 2, workers in a mobile company addressed 1264 configuration management requests manually between the months of June to December 2018, 769 of which were failed requests (FR) and 495 were successful requests (SR).
As evidenced, change management in the period from June to December 2018 registered problems in terms of its effectiveness, as it is an activity that consumes time and resources. For this reason, this Peruvian mobile operator implemented an automated configuration system that makes it possible to improve the equipment registration process, as well as the data loading interval of the service to be modified, allowing several nodes to be entered in parallel and thus speeding up the process and avoiding errors. The improvement achieved with the implementation of the system is shown in Figure 3.
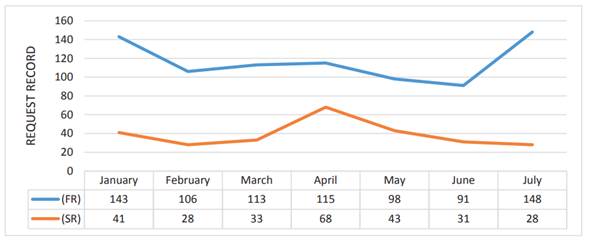
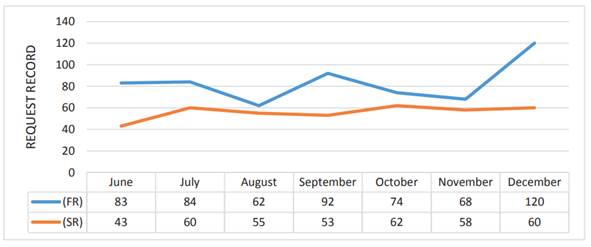
The request records using the automated configuration system are shown in Figure 3. A total of 1086 configurations were performed between January and July 2019, 814 of which are failed requests (FR) and 272 are successful requests (SR).
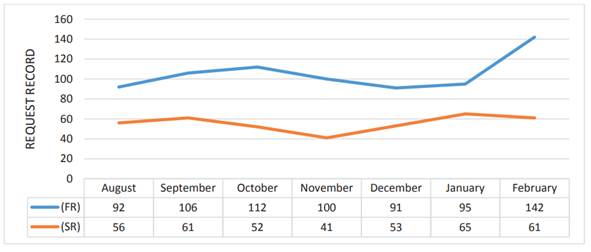
The request records using the automated configuration system are shown in Figure 4. A total of 1127 configurations were performed between August 2019 and February 2020, 738 of which are failed requests (FR) and 389 are successful requests (SR).
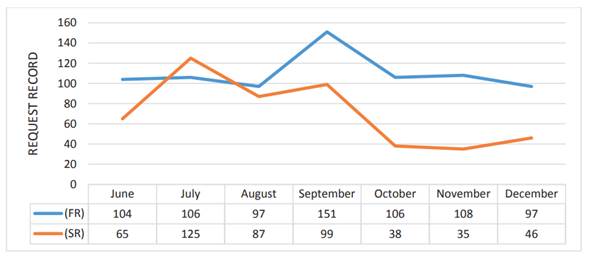
The request records using the automated configuration system are shown in Figure 5. A total of 974 configurations were performed between June and December July 2020, 583 of which are failed requests (FR) and 391 are successful requests (SR).
A descriptive analysis of the indicators of the change management process of the configuration management executed manually by the workers of the IP area of a mobile operator and the one that uses the automated configuration system is presented. The SPSS Statistics 26 statistical software was used for this analysis.
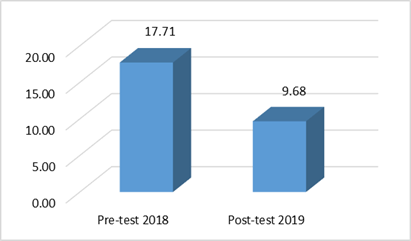
As shown in Figure 6, the results obtained for indicator “average rate of successful change requests” demonstrate the need to implement an automated configuration system for the change management process in the IP area. The results show that when performing the process manually (pre-test), request management from June to December 2018 has a mean of 17.71; while, in the post-test, request management from January to July 2019 has a mean of 9.68.
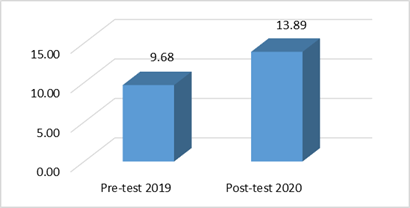
As shown in Figure 7, the results obtained for indicator “average rate of successful change requests” show the influence of the implementation of the automated configuration system for the change management process in the IP area on the indicator. The results show that when performing the process manually (pre-test), request management from January to July 2019 has a mean of 9.68; while, in the post-test, request management from August 2019 to February 2020 has a mean of 13.89.
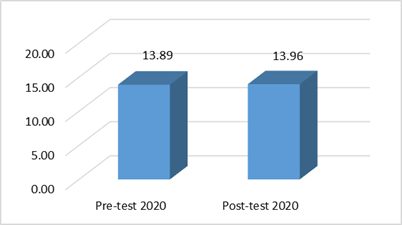
In Figure 8, the results obtained for indicator “average rate of successful change requests” continue to show the influence of the implementation of the automated configuration system for the change management process in the IP area on the indicator. The results show that when performing the process manually (pre-test), request management from August 2019 to February 2020 has a mean of 13.98; while, in the post-test, request management from June to December 2020 has a mean of 13.96.
Inferential statistics were used for hypothesis testing by means of the SPSS 26 software to test the two indicators of the dependent variable: success rate and growth rate.
For this purpose, the following will be taken into account:
Sig. ≤ 0.05, the sample data do not come from a normal distribution.
Sig. > 0.05, the sample data come from a normal distribution.
Indicator Average Rate of Successful Change Request (ASR)
Null hypothesis (H0): Implementation of an automated configuration system that influences the change management process is not necessary for the success rate of change management in the IP area of a mobile operator.
Alternative hypothesis (Ha): Implementation of an automated configuration system that influences the change management process is necessary for the success rate of change management in the IP area of a mobile operator.
Pre-test ASR: Record of successful change requests from June to December 2018.
Post-test ASR: Record of successful change requests from January to July 2019.
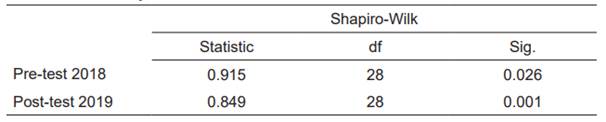
The Shapiro-Wilk normality test presented in Table 1 shows that the average rate of successful requests (ASR) indicator obtained a sig. value < 0.05 in both pre-test 2018 and post-test 2019, which indicates that it comes from a nonparametric distribution, therefore, it is analyzed using the Wilcoxon Signed Ranks test.
Table 2 Wilcoxon Signed Ranks Test.
| Test Statistics | Pre-test 2018 - Post-test 2019 |
|---|---|
| Z | -4.173 |
| Asymp. Sig. (2-tailed) | 0.000 |
Source: Prepared by the author.
The statistical analysis results in Table 2 obtained a sig. value < 0.05; therefore, the null hypothesis is rejected and the alternative hypothesis stating that the implementation of an automated configuration system that influences the change management process is necessary for the success rate of change management in the IP area of a mobile operator is accepted.
Indicator Average Rate of Successful Change Request (ASR)
Null hypothesis (H0): The automated configuration system does not improve the change management process in terms of the success rate of change in the IP area of a mobile operator.
Alternative hypothesis (Ha): The automated configuration system improves the change management process in terms of the success rate of change in the IP area of a mobile operator.
Pre-test ASR: Record of successful change requests before implementing the automated configuration system from January 2019 to July 2019.
Post-test ASR: Record of successful change requests after implementing the automated configuration system from August 2019 to February 2020.
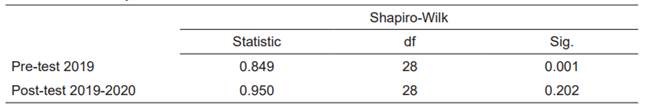
The Shapiro-Wilk normality test presented in Table 3 shows that the growth rate of change requests (GRR) indicator obtained a sig. value of 0.001 in the pre-test 2019 and a sig. value of 0.202 in the post-test 2019-2020, which indicates that former is derived from a nonparametric distribution, therefore, it is analyzed using the Wilcoxon Signed Ranks test.
Table 4 Wilcoxon Signed Ranks Test.
| Test Statistics | Pre-test 2019 - Post-test 2019-2020 |
|---|---|
| Z | -3.392 |
| Asymp. Sig. (2-tailed) | 0.001 |
Source: Prepared by the author.
Table 4 shows the results of the statistical analysis using the Wilcoxon signed rank test, as the pre-test and post-test come from a nonparametric distribution. A sig. value of 0.001 was obtained, i.e., a value less than 0.05; therefore, the null hypothesis is rejected and the alternative hypothesis is accepted: The automated configuration system improves the change management process in terms of the success rate of change requests in the IP area of a mobile operator.
Indicator Growth Rate of Change Requests (GRR)
Null hypothesis (H0): The automated configuration system supports the change management process in terms of the growth rate of change requests in the IP area of a mobile operator.
Alternative hypothesis (Ha): The automated configuration system does not support the change management process in terms of the growth rate of change requests in the IP area of a mobile operator.
Pre-test ASR: Record of successful change requests after implementing the automated configuration system from August 2019 to February 2020.
Post-test ASR: Record of successful change requests after implementing the automated configuration system from June to December 2020.
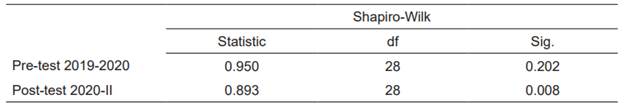
The Shapiro-Wilk normality test presented in Table 5 shows that the growth rate of change requests (GRR) indicator obtained a sig. value of 0.202 in the pre-test 2019-2020 and a sig. value of 0.008 in the post-test 2020-II, which indicates the latter comes from a nonparametric distribution, therefore, it is analyzed using the Wilcoxon Signed Ranks test.
Table 6 Wilcoxon Signed Ranks Test.
| Test Statistics | Pre-test 2019-2020 - Post-test 2020-II |
|---|---|
| Z | -0.298 |
| Asymp. Sig. (2-tailed) | 0.766 |
Source: Prepared by the author.
Table 6 shows the results of the statistical analysis using the Wilcoxon signed rank test, as the pre-test and post-test come from a nonparametric distribution. A sig. value of 0.766 was obtained, i. e., a value greater than 0.05; therefore, the null hypothesis is accepted: The automated configuration system supports the change management process in terms of the success rate of change requests in the IP area of a mobile operator.
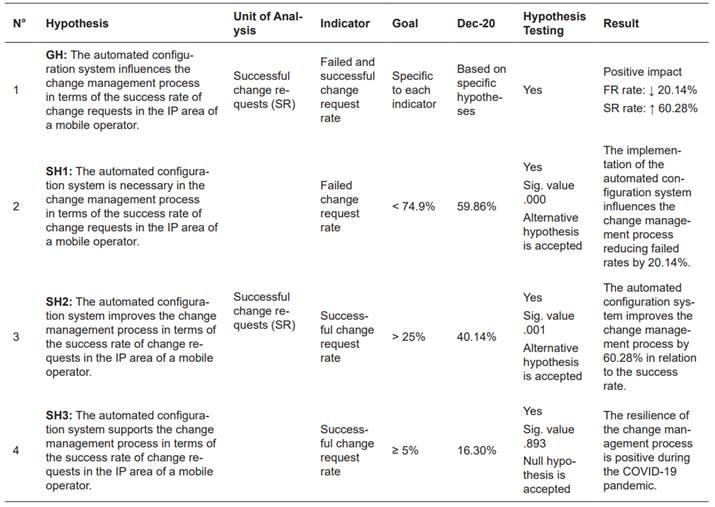
Table 7 presents the results of the hypothesis testing sorted by unit of analysis, indicator, target and results.
DISCUSSION
The implementation of the automated configuration system in the change management process in the IP area of a mobile operator increased the success rate from 25.05% to 40.14%, likewise, it decreased the rate of failed change requests from 74.95% to 59.86%. Meanwhile, in his thesis, Chávez (2017) applied a process management model that encompassed total quality, Business Process Management (BPM), Six Sigma and ICT, succeeded in increasing the values of the resolved incidents indicator of variable “incident process” from 47. 13% to 50.33% and decreased the time of variable “response time” from 14 min to 10.5 min. It is therefore demonstrated that the application of a stimulus to optimize a process in a company depends on the approach and the type of problem, as observed in both research papers.
Upon studying the impact of automation on customer satisfaction in their paper titled Influence of Service Automation Project on Customer Satisfaction in National Transport and Safety Authority, Kenya, Wambui and Gakuu (2019) conclude that it positively and significantly influences not only satisfaction, but also perceived usefulness, ease of use and quality. Although the variables used in this study are different, it is accurate to remark that a positive outcome that supports the hypothesis of the work was obtained: the automated configuration system positively influences the change management process of the IP area of a mobile operator during the Covid-19 pandemic. Both research works were undertaken to validate their hypotheses for the benefit of the respective companies.
CONCLUSIONS AND RECOMMENDATIONS
It is concluded that the automated configuration system positively influences the change management process of the IP area of a mobile operator during the Covid-19 pandemic increasing the success rate by 60.28% and reducing the failure rate by 20.14%
According to the analysis on the mobile operator change management process, the initial failed change request rate was 74.95% in the year 2019 and decreased to 59.86% in the year 2020. Likewise, the automated configuration system improves the mobile operator change management process, in terms of success rate, with an increase from 25.05% in the year 2019 to 40.14% in the year 2020. Finally, it is concluded that the automated configuration system demonstrates resilience in the change management process during the Covid-19 pandemic, due to the fact that the success rate increases by 16.30% in the midst of the health crisis.
Research in the area of artificial intelligence is recommended in order to continue increasing the success rate, due to the fact that network management is the future as a solution measure. Likewise, top management of this Peruvian mobile operator should allocate the necessary resources to implement the automated configuration system in the change management process. Additionally, it is recommended that the implementation of a GNOC model be evaluated in order to reduce operating expenses, reduce failure detection times and improve incident response times in this mobile telephony operator in Peru.
ACKNOWLEDGMENTS
My appreciation goes to the University and my advisor for guiding me along this journey and for passing on knowledge to me.
REFERENCES
Chávez, R. M. (2017). Modelo de Gestión por Procesos Apoyado con las Tecnologías de Información y Comunicaciones para el Help Desk en una Institución Pública. (Tesis doctoral). Universidad Nacional Federico Villarreal, Lima. http://repositorio.unfv.edu.pe/handle/UNFV/2101 [ Links ]
Domingo, J., y Fernandez, W. (2016). Gestión por procesos y su relación con el plan estratégico en un contexto de modernización de la gestión pública peruana. Gestión en el Tercer Milenio, 19(37). https://revistasinvestigacion.unmsm.edu.pe/index.php/administrativas/article/view/13773/12207 [ Links ]
Farfán, J. A. (2020). La implementación de un sistema automatizado reduce los tiempos de atención en los procesos aplicables a la ventanilla única de turismo en la Municipalidad Provincial del Callao. Revista Industrial Data, 23(2), 31-37. https://revistasinvestigacion.unmsm.edu.pe/index.php/idata/article/view/15566/16189 [ Links ]
InGenio Learning. (s.f.). ¿Cómo hacer una gestión de incidentes según ITIL?https://ingenio.edu.pe/gestion-de-incidentes-itil/ [ Links ]
Laya, A. (2017, 2 de octubre). ¿Qué es Gestión de Cambio? 11 maneras de definirla. https://es.linkedin.com/pulse/qu%C3%A9-es-gesti%C3%B3n-de-cambio-11-maneras-definirla-anabella-laya [ Links ]
López, J. F. (2019, 15 de noviembre). Tasa de crecimiento. Economipedia. https://economipedia.com/definiciones/tasa-de-crecimiento.html [ Links ]
Membrillo, L. A. (2019). Impacto de la aplicación de un nuevo modelo de gestión en el centro de operación de red Bitel. (Tesis de maestría). Universidad Nacional Mayor de San Marcos, Lima. [ Links ]
Nebrija Universidad. (2012). Indicador: Tasa de éxito /IN05-P1.2. https://www.nebrija.com/unidad-tecnica-de-calidad-nebrija/pdf/tasa-de-exito.pdf [ Links ]
Ñaupas, H., Valdivia, M., Palacios, J. J., y Romero, H. E. (2018). Metodología de la investigación (5a ed.). Bogotá, Colombia: Ediciones de la U. [ Links ]
Párraga, L., Zambrano, K., y Reyes, M. (2018). Implementación de las tecnologías de la información y comunicación en las PYMES de la zona 4 del Ecuador y su impacto en la competitividad empresarial. Dominio de las ciencias, 4(2), 224-238. https://dialnet.unirioja.es/descarga/articulo/6870908.pdf [ Links ]
Pérez, J., y Merino, M. (2016). Definición de configuración. https://definicion.de/configuracion/ [ Links ]
Rodríguez, A., Díaz, J., y Carnero, H. (2017). Sistema Automatizado para el procesamiento estadístico del Programa de la Madre y el Niño. Revista Habanera de Ciencias Médicas, 16(3). http://scielo.sld.cu/scielo.php?script=sci_arttext&pid=S1729-519X2017000300016 [ Links ]
Salimbeni, S. (2019). Gestión de Procesos de Negocios en el Sector Público. PODIUM, (35), 69-86. https://revistas.uees.edu.ec/index.php/Podium/article/view/313/214 [ Links ]
Wambui, E., y Gakuu, C. (2019). Influence of Service Automation Project on Customer Satisfaction in National Transport and Safety Authority, Kenya. International Academic Journal of Informaion Sciences and Project Management, 3(4), 23-54. http://iajournals.org/articles/iajispm_v3_i4_23_54.pdf [ Links ]
Zúñiga, M., Hurtado, G., y Pérez, J. (2020). La capacidad de la gestión de la configuración en las pequeñas organizaciones de desarrollo de software. Conciencia Digital, 3(3), 466-485. [ Links ]
Received: January 24, 2022; Accepted: March 15, 2022
 Este es un artículo publicado en acceso abierto bajo una licencia Creative Commons
