


Services on Demand
Journal

Article
 text in
  English (pdf)
 Article in xml format
 Article references
 Send this article by e-mail
Indicators
-
 Cited by SciELO
Related links
-
 Similars in
SciELO
Similars in
SciELO
Share

 Permalink
Industrial Data
Print version ISSN 1560-9146On-line version ISSN 1810-9993
Ind. data vol.25 no.1 Lima Jan./Jun. 2022 Epub July 31, 2022
http://dx.doi.org/10.15381/idata.v25i1.22194
Production and Management
Lean Six Sigma Application to Improve Sub-Process Failure Repair in Communication Links

1Master’s in Business Administration at Universidad del Pacífico (Lima, Peru). Currently working as an independent consultant. E-mail: iticonag@gmail.com
The troubleshooting process for communication links in telecommunications is a complex process that is divided into sub-processes; one of these sub-processes is Failure Repair. In this paper, Lean Six Sigma is applied in to improve this sub-process. As a result, the monthly average of the Repair Time (TR) improved in 36.7%, and the Repair Time Yield (YTR) improved in 300.08%.
Keywords: Telecommunications; Lean Six Sigma; Repair Time; Yield; failures
INTRODUCTION
The need to compete in the market demands companies to practice continuous quality improvement in their processes, even more so in those industries where the services offered are losing differentiation as is happening in the telecommunications sector. Quality is a relative concept, so the perspective from which it is being assessed must be clearly understood when studied. According to Evans and Lindsay (2015), there are up to (6) perspectives of quality: product, judgmental, user, value, manufacturing, and customer perspectives.
One of the key processes for a telecommunications service provider is Troubleshooting, which is divided into several sub-processes; one of them is Failure Repair. This study aims to contribute to knowledge through an example of practical application of Lean Six Sigma in the telecommunications services sector, which, compared to other sectors, has a smaller number of registered applications. The relevance and novelty of the contribution lies in the fact that the Lean Six Sigma methodology was applied in a process that occurs within national and international organizations that provide telecommunications services, which support other economic activities in a country. The solution proposed in this research can be applied in those companies in which the performance of their failure repair process is affected by the complications that arise as a result of organizing their human resources in rotating schedules and passing tasks between them in order to provide a continuous 24/7 operation. The solution proposed is simple to apply since it does not focus on technical repair activities, nor on whether the type of technology used is MPLS (Multiprotocol Label Switching), 5G (5th Generation) or SDN (Software Defined Networks). On the contrary, the solution focuses mainly on standardizing the way in which activities are documented and recorded in an environment where work is continuously taken over. Its contribution is relevant as it seeks to solve an existing problem by identifying its causes and proposing improvements.
Problem
To what extent does the application of Lean Six Sigma improve the failure repair sub-process?
This investigation seeks to determine to what extent the application of LSS improves the failure repair sub-process in a company that provides communication services to the corporate sector, for which the following objectives were proposed:
To improve the TR to a value less than 3.25 hours.
To improve the YTR to a value greater than or equal to 75%.
Where:
TR: Repair Time. It is the time elapsed since the failure report is received until it is solved; the waiting time attributable to the client is not counted in its calculation.
YTR: Repair Time Yield. It is the percentage of failures that are repaired with a value less than or equal to a target repair time; for the yield control, the TR is 3.5 hours.
Hypotheses
H0: The application of LSS does not improve the sub-process Failure Repair.
H1: The application of LSS improves the sub-process Failure Repair.
Background
In Mexico, Perez (2016) investigated the impact of LSS in Latin American organizations and concluded that the two most influential success factors were a competition organized by top management and the establishment of improvement goals that would quantify the progress achieved. He also states that the lack of empowerment and trust in personnel are the main obstacles. In Ecuador, Serrano and Ruiz (2018) applied LSS to improve the quality and productivity of cheese-making process, for which they used the 5S tool. In Cuba, Garcia (2014) applied LSS in a car repair shop using DMAIC as a problem-solving methodology, thereby reducing the defects in repairs from 52.9% to 20.45%.
In Peru, Barahona and Navarro (2013) applied LSS to reduce zinc consumption and failure rate in the galvanizing process of steel wire; to accomplish their task, they identified and eliminated activities that did not add value. Cardenas (2019) also applied LSS and used the DMAIC methodology to improve the efficiency of a specific packaging line, which resulted in an efficiency increase from 78.6% to 82%. In banking, Felipa (2014) developed an LSS application model that highlighted the importance of the involvement of management and the advantage of using graphics to facilitate the understanding of processes by users. Perales (2018) managed to improve attention processes in a public university by applying LSS, through the use of 5S, as the main tool. Finally, Yuiján (2014) improved the logistics process in a company that sells mass consumption products by reducing the failure rate in product deliveries by 20% and achieving an improvement in Sigma Level of 0.66.
Theoretical Framework
Processes play a very important role in companies, regardless of the industry, because it is through them that inputs are transformed into desired results. According to Perez (2010), a process is made up of an ordered group of activities that are executed to produce a product valued by the user. Boutros and Cardella (2016) point out that processes have five elements: resources, inputs, sequence of activities, outputs and control; they also propose a classification of processes: business, support, and administration.
Process improvement is an important practice for both manufacturing and service companies, which is why several tools and techniques have been developed to promote it. One of these techniques is Lean Six Sigma, which is the result of mixing the benefits of two process improvement techniques, Six Sigma and Lean, resulting in an improvement approach focused on process variability and waste reduction to gain agility. Furterer (2015) points out that LSS reduces the variability that occurs in a process and eliminates the waste that occurs within, thereby improving process quality. Antony, Vinodh and Gijo (2016) define waste in a process as any activity that is executed and involves investment of resources for which the customer is not willing to pay since it does not provide value; they expose inactivity time as an example.
Voehl et al. (2014) state that the cross-sectoral approach of LSS provides advantages for realizing improvement opportunities; they also point out that the involvement of suppliers, owners and customers is necessary for a successful implementation. Antony et al. (2016) point out that when implementing the LSS methodology, understanding and confidence in it should be sought through consultation with experts in the field, who should be supported, so that there is a focus on the main processes in order to ensure high impact; these authors also highlight the importance of aligning the improvement project with the company's strategic objectives and thus ensure the sustainability of the changes over time. According to George et al. (2005), SIPOC makes it possible to obtain information about the study process quickly, identifying its main inputs and outputs, as well as its participants.
LSS uses DMAIC to solve problems, which, being made up of five stages, provides a structured sequence to manage the improvement project, as well as specialized tools in each of the stages. According to Antony et al. (2016), DMAIC is very useful for dealing with problem scenarios where the causes and solutions are not obvious, as well as those scenarios where the risks are very high. It also indicates that the Define stage (D) is responsible for defining the scope of the problem, Measure (M) determines the current situation, Analyze (A) is oriented to identify the causes of the problem, Improve (I) identifies opportunities for improvement and, finally, Control (C) focuses on maintaining the sustainability of improvements.
Some of the tools used by LSS are Critical to the Quality (CTQ), Project charter, the SIPOC Diagram, Cause-effect analysis or Ishikawa diagram, the Pareto diagram, histograms and control charts. Antony et al. (2016) indicate that CTQ allows identifying the critical outputs to be provided by a process, while Franchetti (2015) defines the project charter as the roadmap that consolidates relevant information about the project.
Finding the causes of a problem is a key task within an improvement project, for which LSS has the cause-effect analysis. Kume (2002) defines this analysis, which is also known as fishbone diagram, as a graphical tool that facilitates the understanding of a complex problem. Since resources within a company are limited, it is important to focus on solving the components of the problem that have the greatest impact. For this purpose, LSS uses the Pareto diagram, which, according to George (2003), uses bars to graphically represent the weight of a factor within the problem to be solved. On the other hand, histograms and control charts, according to Kume (2002), are graphical tools: the first is focused on facilitating the understanding of data behavior in a problem, and the second allows controlling the impact of the improvements introduced.
METHODOLOGY
The failures studied had the following characteristics:
They occurred in its own network and in urban areas.
They were reported by customers, that is to say, they are reactive.
They caused total unavailability of services.
They were of an individual nature.
They impacted internet and/or data services.
The historical information was reviewed, and it was found that in April 2020, 24 failures that met the aforementioned characteristics were reported.
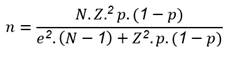
A simple random sample was chosen with a confidence level of 99%, p-value of 50%, e of 5% and Z of 2.575. When these values were used in the formula posed by Triola (2018), this resulted in a sample size of 23.19, which was rounded to 24.
Repair Time (TR) values were extracted from the database and organized into tables using Excel.
The normality test was performed on the TR values through Minitab.
The five stages of the DMAIC methodology were applied.
The control stage was performed for 5 months and the first 24 failures occurring in each control period were selected.
The hypothesis test for TR was done with respect to the total sample of the complete control period, whereas for YTR it was done with respect to the sample formed by the YTR of each control period. For both, a one sample Student’s T-test was used.
RESULTS
Define
The tools Critical to Quality (CTQ) and Project charter were applied to summarize the project information.
Critical to Quality (CTQ) was used to obtain the quality requirements from the customer perspective, as well as to set the CTQs to be met by each of them. Table 1 shows the result of the application, where TR and YTR are the Key Performance Indicators (KPI) that will be used to control the sub-process Failure Repair.
Table 1 Results after the application of Critical to Quality.
| Quality Driver | Requirement | Source of the Requirement | CTQ |
|---|---|---|---|
| Less average Repair Time (TR) | Reduce average Repair Time. | Customer/Management | TR ≤ 3.25 hours |
| Improved Repair Time Yield (YTR) | Increase % of failures repaired with a TR ≤ 3.5 hours. | Management | YTR ≥ 75% |
Source: Prepared by the author.
Project Charter
Project title: Improvement of the sub-process of repair of individual failures with total unavailability.
Context and reason for choosing the project: Telco's management has set the objective of improving customer experience, where the improvement of repair times is an important aspect.
Project Goal: To improve the two indicators of the sub-process Failure Repair:
Repair Time: TR ≤ 3.25 hours
Repair Time Yield: YTR ≥ 75%
Scope: Repair of individual failures sub-process.
Definition of non-conformity: when the failure has been resolved with a TR > 3.5 hours.
Measure
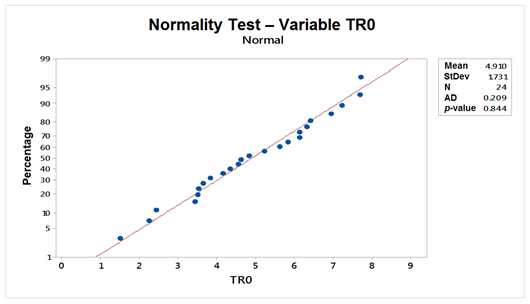
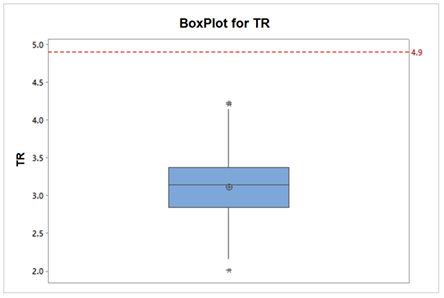
When using the TR of the sample, the value for the initial state was 4.9 hours, then the normality test was applied to the values and, since the p-value was greater than 0.05 (Figure 1), it is proven that the values follow a normal distribution, which will allow analyzing the process capability.
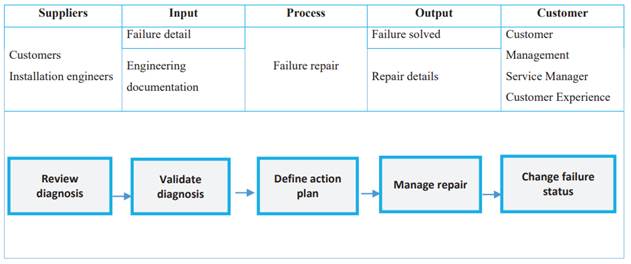
SIPOC diagram was used (Figure 2) to obtain an overview of the process, where:
Review diagnosis: Involves extracting the information contained in the trouble ticket; this may include symptoms of the problem, affected location, customer data.
Validate diagnosis: Failures may come with a preliminary diagnosis that needs to be validated.
Define action plan: Time is a limited resource, so the activities to be carried out must be carefully chosen and recorded in a plan.
Manage repair: Involves executing the action plan and reassessing when necessary.
Change failure status: Once the repair is over, the failure should be placed in status “solved”.
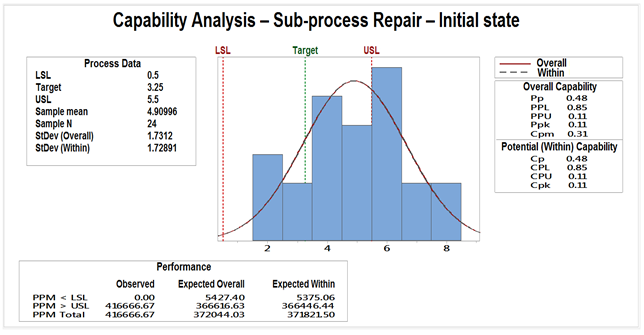
The process capability was analyzed with Minitab (Figure 3) and it was concluded that the sub-process Failure Repair was out of control.
Analyze
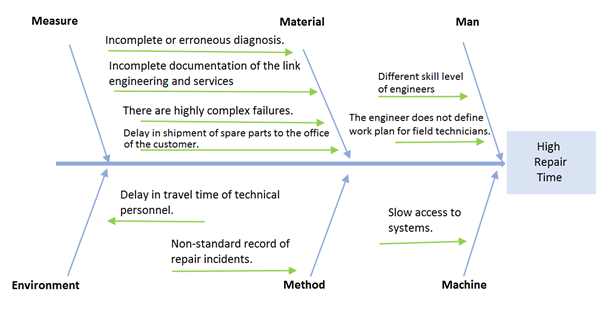
Ishikawa diagram was applied (Figure 4), and the root causes were classified as shown in Table 2. Based on the experience of the manager of the area involved in the process and considering the criteria of impact and frequency of occurrence of the causes, it was concluded that causes C9, C6, C7, C1 and C3 are the ones that impacted the most on the sub-process. The 5Whys tool was applied in order to delve deeper into these causes.
Source: Prepared by the author.
Figure 4 Ishikawa Diagram - Root Cause Analysis of the Sub-Process Failure Repair.
C9: Non-standard record of repair incidents
Why1: Several activities are performed simultaneously during the repair.
Why2: There are several trouble tickets to be worked on.
Why3: Solved tickets are not closed in due time.
Why4: The entire ticket needs to be reviewed to obtain details of the repair, such as what the failure was, where the failure was located, what action repaired the failure, what time the failure started and what time the link or services were restored.
Why5: The essential information that should be recorded regarding important moments of the repair and how these should be recorded has not been defined.
C6: The engineer does not define work plan for field technicians.
Why1: The engineer does not consider it an important part of the process.
Why2: The engineer is developing multiple activities simultaneously and prioritizes the controlled activities of the process or those that do not require much time investment on his part.
Why3: Since the plan is qualitative in nature and varies from one failure to another, it can take up a lot of time for the engineer.
Why4: The work plan defines resources and actions to be performed by the engineer and the field technician; projecting the work plan in a situation of uncertainty such as a failure causes the engineer to not always do it.
Why5: The guidelines for a basic plan that fits most situations are not defined.
C7: Delay in travel time of technical personnel
Why1: Biosecurity protocols and controls make travel on public roads and access protocols difficult.
Why2: The technician needs to travel to the node, sometimes due to failure of remote diagnosis.
Why3: The diagnosis fails because the engineer did not define well the scope of the problem.
Why4: The engineer does not make a correct definition of the problem because he does not run necessary tests.
Why5: The complexity of the diagnosis process makes it difficult to define minimum standard tests for any scenario.
C1: Incomplete or erroneous diagnosis
Why1: The engineer does not gather enough information about the problem.
Why2: The engineer does not ask the right questions when contacting the customer.
Why3: The engineers have varying levels of ability to ask questions.
Why4: The engineers have varying levels of experience and varying levels of reaction to failures.
Why5: Each engineer defines how he performs and documents his diagnosis.
C3: Delay in shipment of spare parts to the office of the customer
Why1: The spare part is not brought by the technician.
Why2: The technician does not have the necessary spare parts to attend the failure.
Why3: The spare part was used in a previous failure and has not yet been replaced by logistics.
Why4: Logistics is not aware that the spare part needs to be replaced.
Why5: The engineer did not regularize the orders to replace spare parts to Logistics, as the process does not stipulate when this should be done.
Table 2 Root Cause Classification.
| Category | Code | Repair Time |
|---|---|---|
| Material | C1 | Incomplete or erroneous diagnosis |
| Material | C2 | Incomplete documentation of the link engineering and services |
| Material | C3 | Delay in shipment of spare parts to the office of the customer |
| Material | C4 | There are highly complex failures |
| Man | C5 | Different skill level of engineers |
| Man | C6 | The engineer does not define work plan for field technicians |
| Environment | C7 | Delay in travel time of technical personnel |
| Machine | C8 | Slow system access |
| Method | C9 | Non-standard record of repair incidents |
Source: Prepared by the author.
Improve
The improvement proposal focuses on standardizing the diagnosis, the diagnosis record and the repair action record. Table 3 shows the details of the proposed solution.
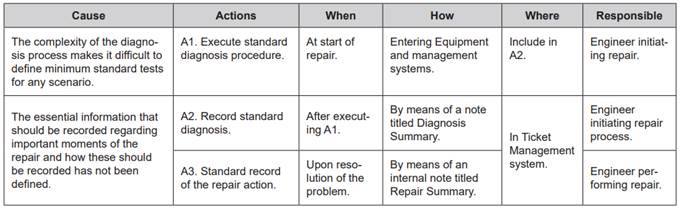
A1. Standard diagnosis procedure: The purpose of this procedure is to perform the minimum basic actions and tests on a channel that is down.
Review bandwidth consumption history.
Review last mile status according to the access technology used in the link.
Review history of the dynamic routing protocol status.
If the link has redundancy, validate that traffic has been switched.
If the last mile is operational and the service is unavailable, perform full connectivity test by pinging with different packet size and source LAN subinterface of our router installed at the customer.
If there is insufficient information, contact the customer by phone.
A2. Standard diagnosis record: It is intended to centralize and summarize the information about the failure diagnosis; it contains at least the following points:
Description of symptoms of the problem: It is suggested to include the answers to the following questions: how did the customer become aware of the problem? what are the symptoms of the failure? are any of the other services working? does the last mile modem have any red LEDs on? what is the start time of the problem?
Standard diagnosis execution results and action plan. Define the action plan to be performed, at least the following three activities. Specify name and surname of those responsible and use specific times. If you see a potential risk, either by complexity of the problem or lack of resources, escalate with the area manager.
A3. Standard repair record: It seeks to facilitate the closure of the failure and any subsequent analysis required on the ticket.
Describe what the root cause of the problem was.
Describe the services that were affected.
Indicate the action that repaired the failure.
List of equipment and components replaced.
Repair time
Allocated downtime
Propose and record the standard monitoring plan, see section 4.2.5.6.
Configure Autoclose with an additional 4 hours over the time indicated in the monitoring plan, as a reserve in case of unforeseen events
Control
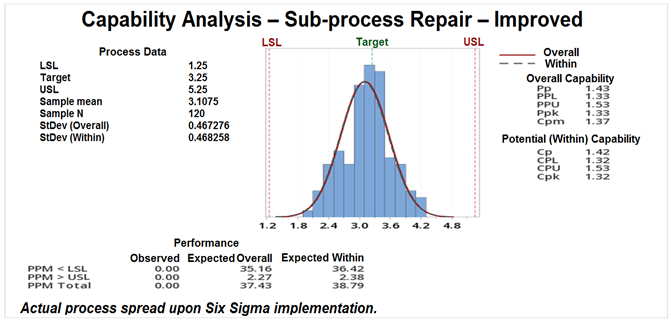
The capacity analysis of the improved process, after 5 months, yielded the results shown in Figure 5, where it can be seen that the process is now under control. The Table shows the results for TR and YTR for the five Control (C) periods.
Hypothesis test: Given that the normality tests for TR and YTR show that p is greater than 0.05 for both variables, it is concluded that they follow a normal distribution (Figures 6 and 7). From the above, Student's t-test was used for both variables. The descriptive statistics for both variables are shown in Table 4.
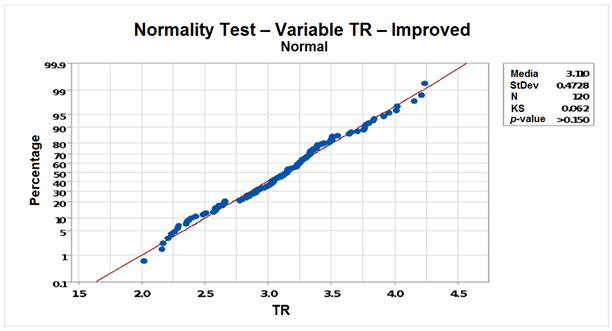
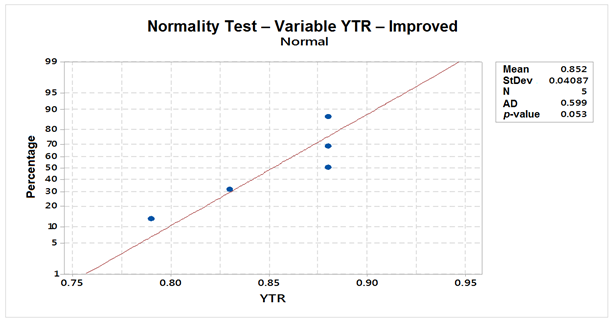
Table 4 Descriptive Statistics Post-Application.
| N | Mean | StDev | Standard error of the mean | Upper 95% limit for µ |
|---|---|---|---|---|
| 120 | 3.11 | 0.47 | 0.04 | 3.18 |
| 5 | 0.85 | 0.04 | 0.02 | 0.81 |
Source: Prepared by the author.
Hypothesis Test for TR:
Null hypothesis H₀: μ = 4.91. The application of LSS does not improve TR.
Alternative hypothesis H1: H₁: μ < 4.91. The application of LSS improves TR.
T-value: - 41.71
p-value: 0.00
Figure 8 shows the hypothesis test. The mean of TR is lower than the mean of the process in the 0 or initial state.
Hypothesis Test YTR
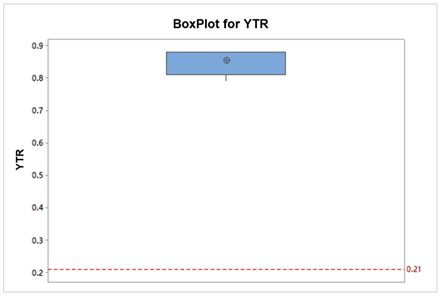
Null hypothesis H₀: μ = 0.21. The application of LSS does not improve YTR.
Alternative hypothesis H1: H1: μ > 0.21. The application of LSS improves YTR.
T-value: 35.13
p-value: 0.00
Figure 9 shows graphically the hypothesis test. The mean of YTR of the improved process is higher than the mean of the process in the 0 or initial state.
Since the p-value is less than 0.05 for TR and YTR, H0 is rejected and H1, which states that the application of LSS improves the sub-process Failure Repair, is accepted.
DISCUSSION
Table 5 summarizes the results of TR and YTR, before application (E0) and after application of LSS.
The application of LSS achieved a 37% reduction in repair time from the initial state, shortening the ticket lifetime by about 1.8 hours.
The Yield TR improved by 308% with respect to the YTR of the initial state.
The application of LSS allowed obtaining better values than the goals set in the improvement project: The average TR and YTR of the five control periods were 3.11 hours versus 3.25 hours and 85% versus 75%, respectively.
The improvements mainly focused on reducing the TR based on the proposed standard diagnosis and reducing the uncertainty of the process due to lack of information, standardizing the documentation of the diagnosis and the recording of the repair action.
CONCLUSIONS
As with any improvement process, it is important to involve the people who participate in the execution of the process, either as suppliers of inputs to the process or those who carry out the process.
LSS demonstrates its value as an improvement tool in the service industry by improving a complex sub-process that has outputs that are not as parameterized as tangible products.
In order to manage the difficulty of assessing the intangible characteristics of the product delivered by the sub-process, it is desirable to define the critical attributes for quality.
When LSS is applied in services, the level of variability that the variable in study has in the initial state can be taken as a reference of the degree of definition that the critical attributes for quality must have.
REFERENCIAS BIBLIOGRÁFICAS
Antony, J., Vinodh, S., y Gijo, E. (2016). Lean Six Sigma for Small and Medium Sized Enterprises: A Practical Guide. Boca Raton, FL, EE. UU.: CRC Press Taylor & Francis Group. [ Links ]
Barahona, L., y Navarro, J. (2013). Mejora del proceso de galvanizado en una empresa manufacturera de alambres de acero aplicando la metodología Lean Six Sigma. (Tesis de grado). Pontificia Universidad Católica del Perú, Lima. [ Links ]
Boutros, T., y Cardella, J. (2016). The Basics of Process Improvement. Boca Raton, FL, EE. UU.: CRC Press Taylor & Francis Group. [ Links ]
Cardenas, R. (2019). Mejora de la eficiencia de formación de una planta de fabricación de envases de vidrio. (Tesis de maestría). Pontificia Universidad Católica del Perú, Lima. [ Links ]
Evans, J., y Lindsay, W. (2015). Administración y Control de la Calidad (9a edición). México D. F., México: Cencage Learning. [ Links ]
Felipa, J. (2014). Metodología de implantación de modelo de mejoras de procesos Lean Six Sigma en entidades bancarias. (Tesis de maestría). Universidad de Piura, Piura. [ Links ]
Franchetti, M. (2015). Lean Six Sigma for Engineers and Managers. With Applied Case Studies. Boca Raton, FL, EE. UU.: CRC Press Taylor & Francis Group. [ Links ]
Furterer, S. (2015). Lean Six Sigma en el servicio. México D.F., México: Trillas. [ Links ]
García, Y. (2014). Aplicación de la Metodología Seis Sigma para el mejoramiento de la calidad de las reparaciones, en la Agencia SASA Villa Clara. (Tesis de maestría). Universidad Central Marta Abreu de las Villas, Santa Clara. [ Links ]
George, M. (2003). Lean Six Sigma for Service: How to Use Lean Speed and Six Sigma Quality to Improve Service and Transactions. EE. UU.: McGraw Hill. [ Links ]
George, M., Rowlands, D., Price, M., y Maxey, J. (2005). The Lean Six Sigma Pocket Toolbook, a Quick Reference Guide to Nearly 100 Tools for Improving Process Quality, Speed, and Complexity. EE. UU.: McGraw-Hill. [ Links ]
Kume, H. (2002). Herramientas estadísticas básicas para el mejoramiento de la calidad. Bogotá, Colombia: Grupo Editorial Norma. [ Links ]
Perales, M. (2018). Análisis, diagnóstico y propuesta de mejora en los procesos administrativos de la dirección general de administración en una universidad pública aplicando Lean Six Sigma. (Tesis de maestría). Pontificia Universidad Católica del Perú, Lima. [ Links ]
Pérez, J. (2010). Gestión por Procesos (4ta ed.). Madrid, España: ESIC Business and Marketing School. [ Links ]
Pérez, H. (2016). El impacto de Lean Six Sigma en organizaciones latinoamericanas y sus factores críticos de éxito. (Tesis doctoral). Universidad Antropológica de Guadalajara, Jalisco. [ Links ]
Serrano, G., y Ruiz, F. (2018). Aplicación de la metodología Lean Six Sigma en una empresa de lácteos: caso de estudio en la fabricación de quesos frescos, queso mozzarella y mantequilla. (Tesis de maestría). Universidad San Francisco de Quito, Quito. [ Links ]
Triola, M. (2018). Estadística (12ª edición). México D.F., México: Pearson Education. [ Links ]
Voehl, F., Harrington, H., Mignosa, C., y Charron, R. (2014). The Lean Six Sigma Black Belt Handbook: Tools and Methods for Process Acceleration. Boca Raton, FL, EE. UU.: CRC Press Taylor & Francis Group. [ Links ]
Yuiján, D. (2014). Mejora del área de logística mediante la implementación de Lean Six Sigma en una empresa comercial. (Tesis de grado). Universidad Nacional Mayor de San Marcos, Lima. [ Links ]
Received: February 05, 2022; Accepted: April 13, 2022
 Este es un artículo publicado en acceso abierto bajo una licencia Creative Commons
